
134 lines
8.8 KiB
Markdown
134 lines
8.8 KiB
Markdown
|
|
> Name
|
|
|
|
EMA-SAR-中长期趋势跟踪策略-EMA-SAR-Medium-to-Long-Term-Trend-Following-Strategy
|
|
|
|
> Author
|
|
|
|
ChaoZhang
|
|
|
|
> Strategy Description
|
|
|
|
|
|
[trans]
|
|
#### 概述
|
|
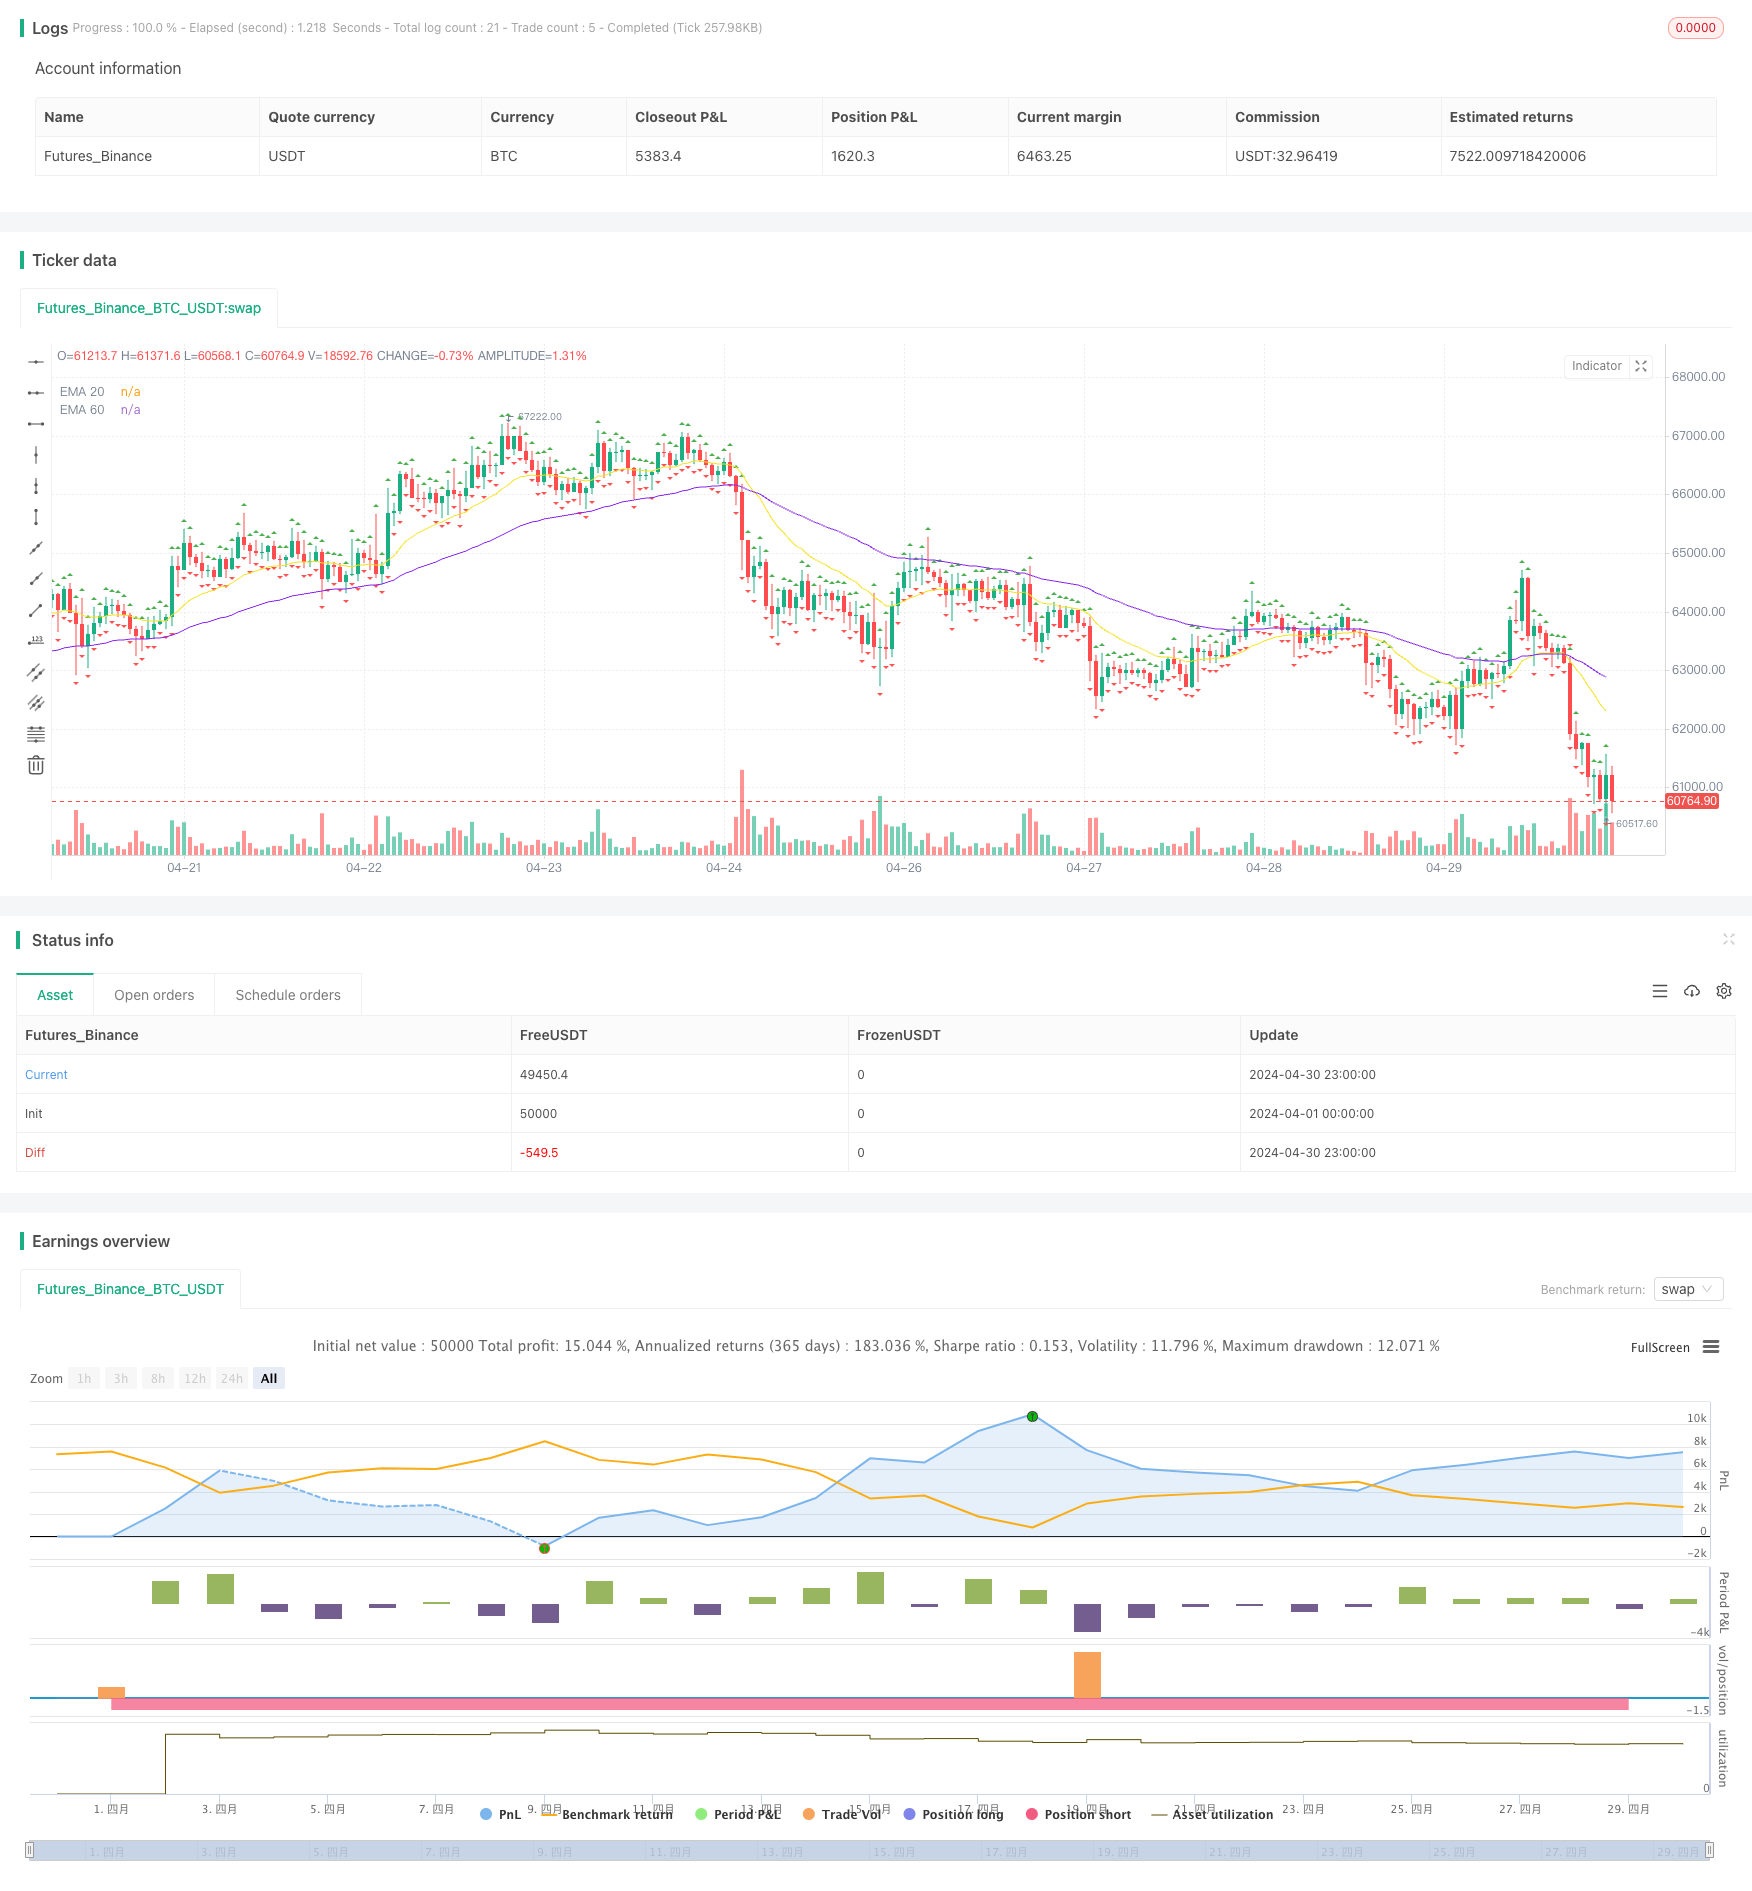
EMA SAR 中长期趋势跟踪策略是一种利用指数移动平均线(EMA)和抛物线指标(SAR)的组合来捕捉市场中长期趋势的量化交易策略。该策略通过比较20周期和60周期的EMA,结合SAR指标来确定当前市场的趋势方向,并在趋势确立后进行交易。该策略的主要目标是在趋势形成的早期阶段介入,并持有头寸直到趋势反转的信号出现。
|
|
|
|
#### 策略原理
|
|
该策略的核心是利用两条不同周期的EMA(20和60)的交叉来判断趋势的方向。当20周期EMA从下方向上穿越60周期EMA时,表明上升趋势可能正在形成;反之,当20周期EMA从上方向下穿越60周期EMA时,表明下降趋势可能正在形成。为了进一步确认趋势的真实性,该策略还引入了SAR指标作为辅助判断。只有在EMA交叉的同时,SAR指标也显示出与趋势一致的信号时(上升趋势时SAR在价格下方,下降趋势时SAR在价格上方),该策略才会考虑进场交易。
|
|
|
|
#### 优势分析
|
|
1. 通过组合使用EMA和SAR指标,该策略能够较好地过滤掉噪音和假信号,提高趋势判断的准确性。
|
|
2. 该策略的交易频率相对较低,更适合捕捉中长期的趋势,有助于降低交易成本和频繁交易带来的风险。
|
|
3. 在趋势形成的早期阶段介入,能够最大化每个趋势的利润空间。
|
|
4. 止损设置在前一个交易日的高点(做多)或低点(做空),能够有效控制单次交易的风险。
|
|
|
|
#### 风险分析
|
|
1. 该策略在震荡市中可能会出现较多的错误信号,导致频繁交易和资金损失。
|
|
2. 策略的表现在很大程度上依赖于EMA和SAR参数的选择,不同的参数设置可能导致策略表现差异较大。
|
|
3. 在强趋势市场中,该策略可能会错过最佳的入场机会,因为它需要等待EMA交叉和SAR确认。
|
|
4. 该策略缺乏对风险与收益的动态权衡,在每次交易中承担的风险可能不尽相同。
|
|
|
|
#### 优化方向
|
|
1. 考虑引入其他技术指标或市场情绪指标,以进一步提高趋势判断的准确性和可靠性。
|
|
2. 对EMA和SAR的参数进行优化,找到在不同市场状况下表现最佳的参数组合。
|
|
3. 引入动态止损和止盈机制,根据市场波动性和个股特性实时调整风险控制。
|
|
4. 结合市场领涨股或行业轮动等策略,提高在强趋势市场中的适应性和收益潜力。
|
|
|
|
#### 总结
|
|
EMA SAR 中长期趋势跟踪策略通过组合使用EMA和SAR指标,在趋势形成的早期阶段介入,以捕捉市场中长期趋势性机会。该策略的优势在于能够较好地过滤噪音,并在趋势确立后持有头寸以最大化利润。然而,其在震荡市中可能出现较多错误信号,且表现受参数选择影响较大。未来可以通过引入其他指标、优化参数、动态风控等方式对该策略进行进一步增强,提高其在不同市场环境下的稳健性和收益潜力。
|
|
|
|
||
|
|
|
|
#### Overview
|
|
The EMA SAR Medium-to-Long-Term Trend Following Strategy is a quantitative trading strategy that utilizes a combination of Exponential Moving Averages (EMAs) and the Parabolic Stop and Reverse (SAR) indicator to capture medium-to-long-term trends in the market. The strategy determines the current market trend direction by comparing the 20-period and 60-period EMAs and confirming with the SAR indicator. The main objective of the strategy is to enter trades early in the formation of a trend and hold positions until a reversal signal appears.
|
|
|
|
#### Strategy Principle
|
|
The core of this strategy is to use the crossover of two EMAs with different periods (20 and 60) to determine the trend direction. When the 20-period EMA crosses above the 60-period EMA from below, it indicates that an uptrend may be forming; conversely, when the 20-period EMA crosses below the 60-period EMA from above, it suggests a potential downtrend. To further confirm the authenticity of the trend, the strategy also incorporates the SAR indicator. The strategy will only consider entering a trade when the EMA crossover occurs simultaneously with the SAR indicator showing a signal consistent with the trend (SAR below price in an uptrend, SAR above price in a downtrend).
|
|
|
|
#### Advantage Analysis
|
|
1. By combining the EMA and SAR indicators, the strategy effectively filters out noise and false signals, improving the accuracy of trend identification.
|
|
2. The strategy has a relatively low trading frequency, making it more suitable for capturing medium-to-long-term trends, which helps reduce trading costs and risks associated with frequent trading.
|
|
3. Entering trades early in the formation of a trend allows the strategy to maximize the profit potential of each trend.
|
|
4. The stop-loss is set at the previous trading day's high (for long positions) or low (for short positions), effectively controlling the risk of individual trades.
|
|
|
|
#### Risk Analysis
|
|
1. The strategy may generate numerous false signals during range-bound markets, leading to frequent trading and capital losses.
|
|
2. The performance of the strategy heavily depends on the selection of EMA and SAR parameters, and different parameter settings may result in significant performance variations.
|
|
3. In strong trending markets, the strategy may miss the best entry opportunities as it requires confirmation from both EMA crossover and SAR.
|
|
4. The strategy lacks dynamic risk-reward balancing, and the risk taken in each trade may not be consistent.
|
|
|
|
#### Optimization Direction
|
|
1. Consider incorporating additional technical indicators or market sentiment indicators to further improve the accuracy and reliability of trend identification.
|
|
2. Optimize the parameters of the EMA and SAR to find the best-performing combinations under different market conditions.
|
|
3. Introduce dynamic stop-loss and take-profit mechanisms to adjust risk control in real-time based on market volatility and individual stock characteristics.
|
|
4. Combine with market leadership or sector rotation strategies to enhance adaptability and profit potential in strong trending markets.
|
|
|
|
#### Summary
|
|
The EMA SAR Medium-to-Long-Term Trend Following Strategy combines EMA and SAR indicators to enter trades early in the formation of a trend, aiming to capture medium-to-long-term trending opportunities in the market. The strategy's advantages lie in its ability to filter out noise and hold positions once a trend is established to maximize profits. However, it may generate numerous false signals in range-bound markets, and its performance is significantly influenced by parameter selection. Future enhancements to the strategy could involve incorporating additional indicators, parameter optimization, dynamic risk management, and integration with other strategies to improve its robustness and profit potential across different market environments.
|
|
[/trans]
|
|
|
|
|
|
|
|
> Source (PineScript)
|
|
|
|
``` pinescript
|
|
/*backtest
|
|
start: 2024-04-01 00:00:00
|
|
end: 2024-04-30 23:59:59
|
|
period: 1h
|
|
basePeriod: 15m
|
|
exchanges: [{"eid":"Futures_Binance","currency":"BTC_USDT"}]
|
|
*/
|
|
|
|
//@version=5
|
|
strategy("EMA SAR Strategy", overlay=true)
|
|
|
|
// EMA Settings
|
|
ema_20 = ta.ema(close, 20)
|
|
ema_60 = ta.ema(close, 60)
|
|
|
|
/// SAR Settings
|
|
sar = ta.sar(0.02, 0.2, 0.2)
|
|
sar_value = sar
|
|
is_trend_up = sar[1] > sar[2] ? true : false // Evaluating the trend direction
|
|
|
|
/// Condition for Buy Signal
|
|
buy_condition = ta.crossover(ema_20, ema_60) and (sar_value < ema_20) and (is_trend_up)
|
|
|
|
// Condition for Sell Signal
|
|
sell_condition = ta.crossunder(ema_20, ema_60) and (sar_value > ema_20) and (not is_trend_up)
|
|
|
|
// Define Entry Time
|
|
entry_time = time + 180000
|
|
|
|
// Strategy Entry
|
|
strategy.entry("Buy", strategy.long, when=buy_condition, comment="Buy Signal", stop=high[1])
|
|
strategy.entry("Sell", strategy.short, when=sell_condition, comment="Sell Signal", stop=low[1], when=entry_time)
|
|
|
|
// Plot EMAs
|
|
plot(ema_20, color=#f3e221, linewidth=1, title="EMA 20")
|
|
plot(ema_60, color=#8724f0, linewidth=1, title="EMA 60")
|
|
|
|
// Plot SAR
|
|
plotshape(sar_value, style=shape.triangleup, location=location.abovebar, color=color.green, size=size.small, title="SAR Up")
|
|
plotshape(sar_value, style=shape.triangledown, location=location.belowbar, color=color.red, size=size.small, title="SAR Down")
|
|
|
|
// Plot Buy and Sell Signals
|
|
plotshape(series=buy_condition, title="Buy Signal", location=location.belowbar, color=color.green, style=shape.triangleup, size=size.small)
|
|
plotshape(series=sell_condition, title="Sell Signal", location=location.abovebar, color=color.red, style=shape.triangledown, size=size.small)
|
|
|
|
// Send Alerts
|
|
alertcondition(condition=buy_condition, title="Buy Signal", message="Buy Signal - EMA SAR Strategy")
|
|
alertcondition(condition=sell_condition, title="Sell Signal", message="Sell Signal - EMA SAR Strategy")
|
|
|
|
```
|
|
|
|
> Detail
|
|
|
|
https://www.fmz.com/strategy/451728
|
|
|
|
> Last Modified
|
|
|
|
2024-05-17 15:22:15
|