
15 KiB
Name
EMA-RSI-Volume-Price-Trend-Engulfing-Pattern-均线交叉相对强弱指标成交量价格趋势吞没形态策略
Author
ChaoZhang
Strategy Description
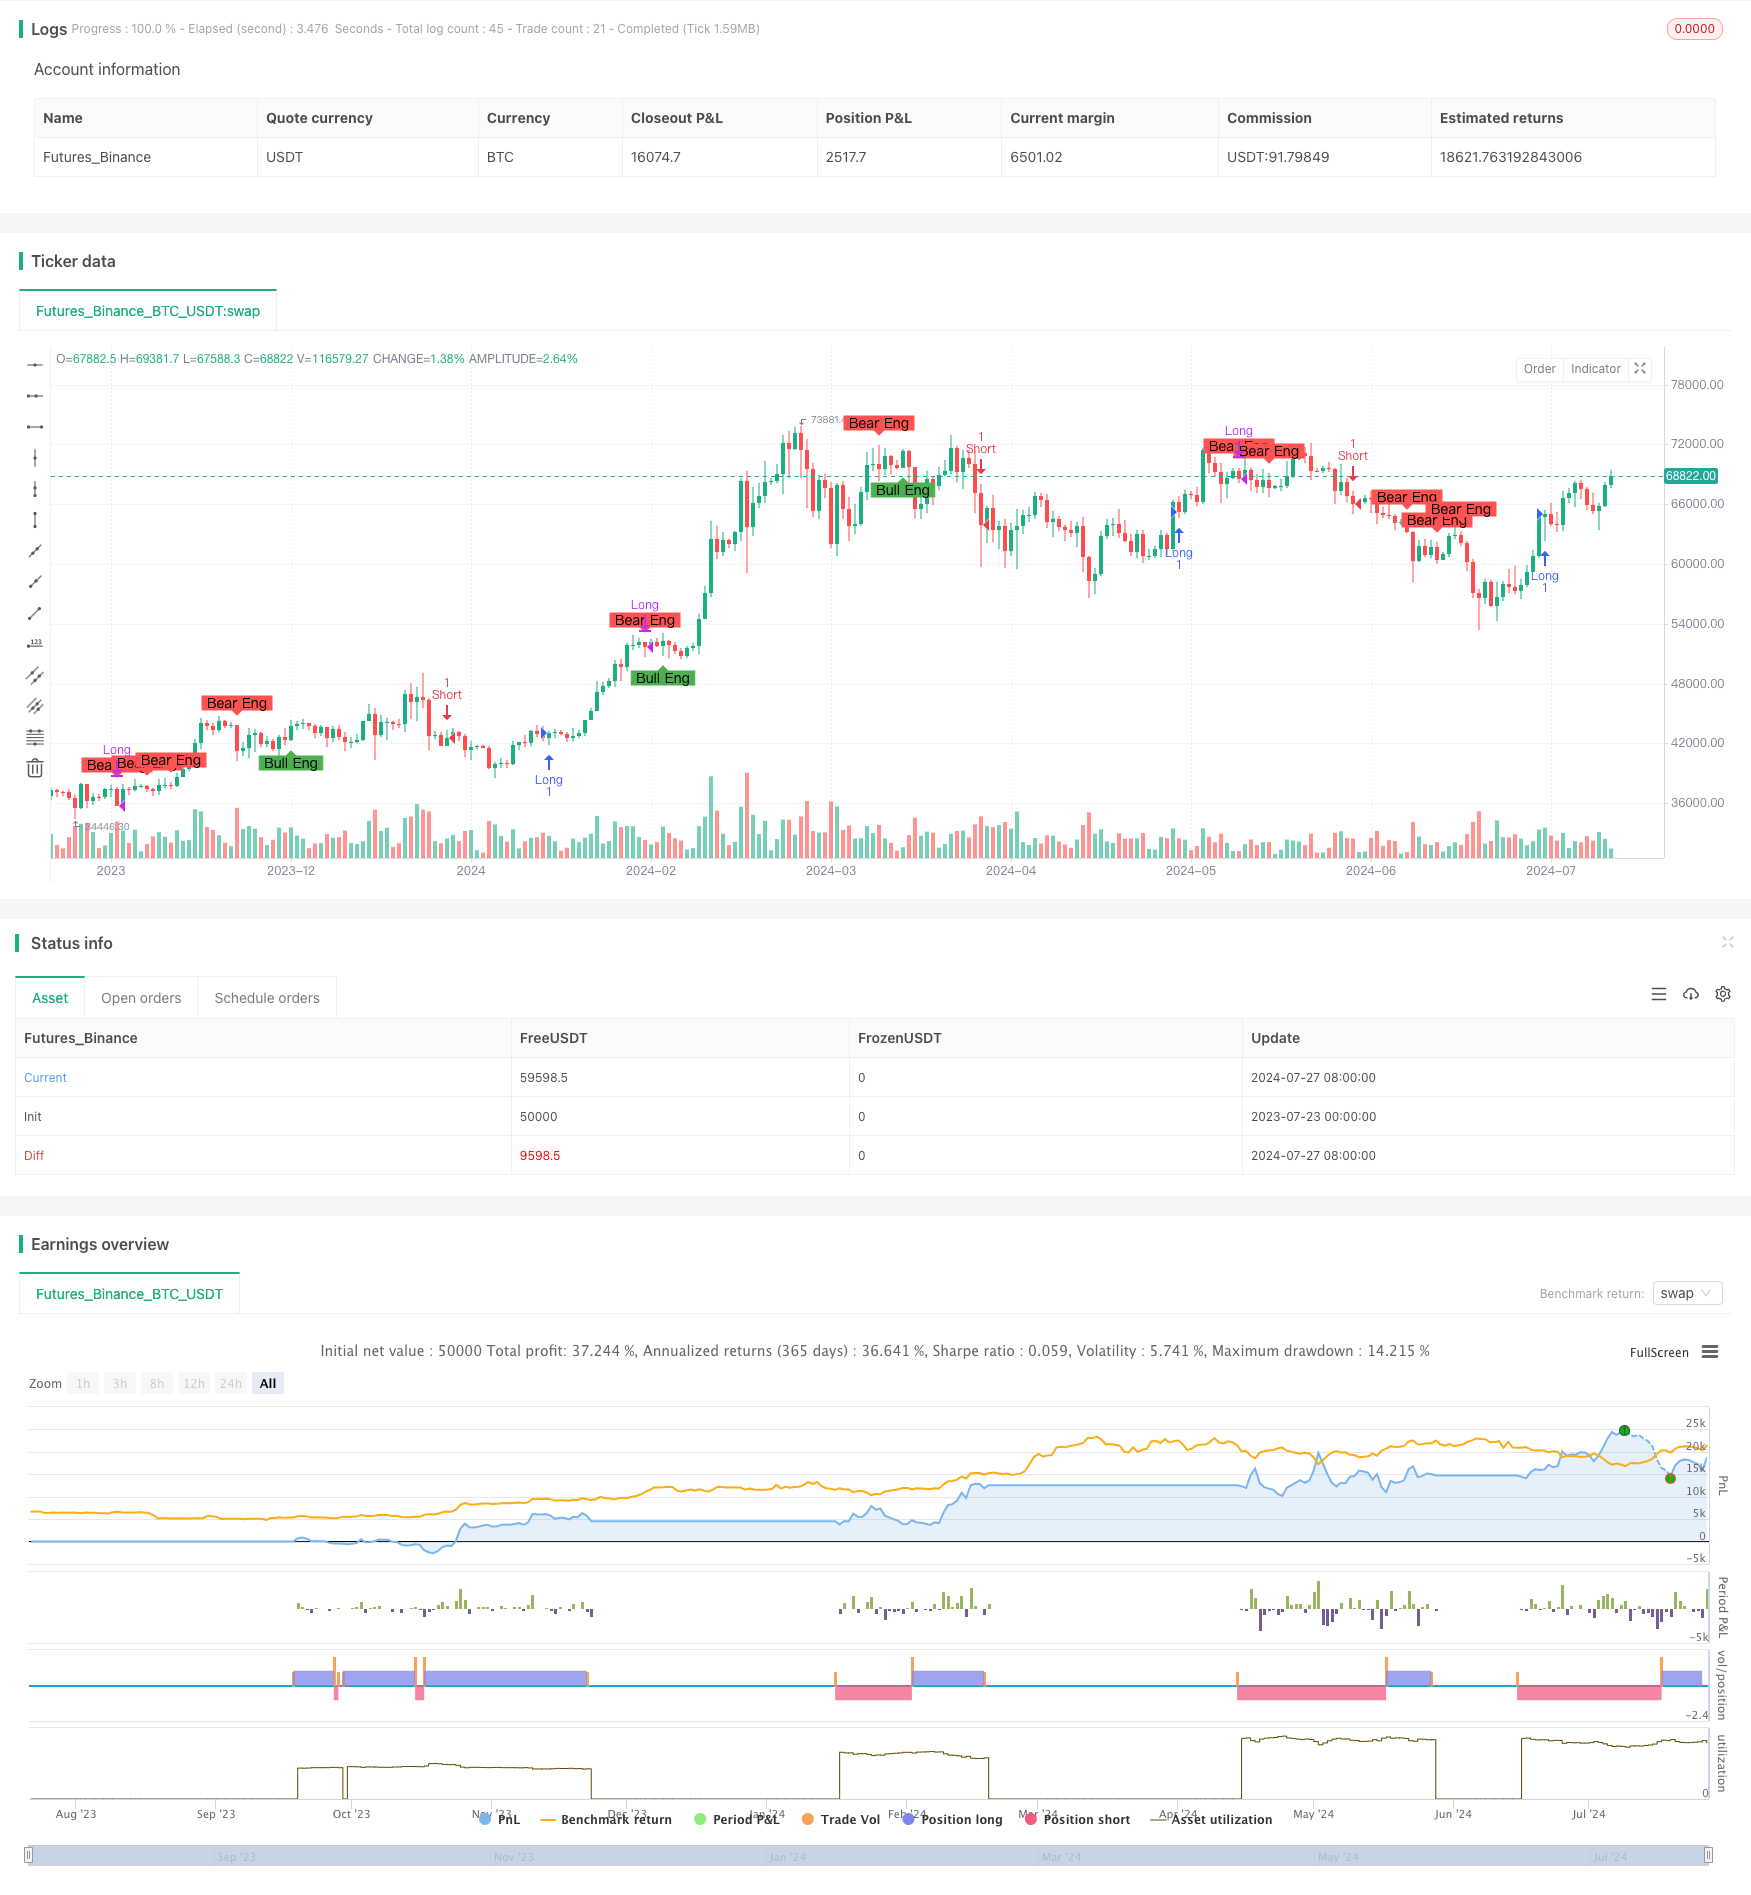
[trans]
概述
本策略是一个结合了多种技术分析工具的综合交易系统。它利用指数移动平均线(EMA)交叉、随机相对强弱指标(Stochastic RSI)、成交量价格关系以及蜡烛图形态来生成交易信号。该策略的核心在于通过多维度分析市场动态,提高交易决策的准确性和可靠性。
策略的主要组成部分包括:
- 基于8期和20期EMA的交叉系统
- 利用成交量和价格关系计算的趋势指标
- 随机RSI指标用于确认趋势反转
- 牛熊背离检测机制
- 吞没形态识别系统
通过整合这些元素,策略旨在捕捉市场趋势的转折点,同时通过设置止损和获利了结机制来管理风险。
策略原理
-
EMA交叉系统:
- 当8期EMA上穿20期EMA时,产生买入信号
- 当8期EMA下穿20期EMA时,产生卖出信号
-
成交量价格趋势计算:
- 通过成交量与收盘价的比值来衡量市场情绪
- 用于检测潜在的牛熊背离
-
随机RSI:
- 计算14期的随机RSI,用于确认潜在的趋势反转点
-
牛熊背离检测:
- 比较近期低点/高点与成交量价格趋势
- 当价格创新低但成交量价格趋势上升时,视为牛市背离
- 当价格创新高但成交量价格趋势下降时,视为熊市背离
-
吞没形态识别:
- 识别牛市和熊市吞没形态
- 用于设置止损点和获利了结点
-
交易逻辑:
- 在牛市背离或EMA金叉时买入
- 在熊市背离或EMA死叉时卖出
- 第一次出现反向吞没形态时设置止损
- 第二次出现反向吞没形态时平仓获利
策略优势
-
多维度分析:结合技术指标、成交量分析和蜡烛图形态,提供更全面的市场视角。
-
趋势跟踪与反转预警:EMA交叉系统有助于捕捉主要趋势,而背离检测和吞没形态则可以预警潜在的反转。
-
风险管理:通过吞没形态设置动态止损和获利点,有助于控制风险和锁定利润。
-
灵活性:策略可以适应不同的市场条件,既能在趋势市场中获利,又能在震荡市场中捕捉反转机会。
-
自动化:策略可以编程实现,减少人为情绪干扰,提高执行效率。
-
客观性:基于明确的技术指标和图形模式,减少主观判断带来的偏差。
策略风险
-
过度交易:在震荡市场中,频繁的EMA交叉可能导致过度交易,增加交易成本。
-
滞后性:EMA和RSI等指标本质上是滞后指标,可能在快速变化的市场中错过重要拐点。
-
假突破:在横盘整理阶段,可能出现短期的假突破,导致错误信号。
-
参数敏感性:策略效果高度依赖于EMA周期、RSI参数等设置,不同市场可能需要不同的优化。
-
市场环境依赖:在强趋势市场中表现可能优于震荡市场,需要考虑市场周期。
-
信号冲突:不同指标可能产生相互矛盾的信号,需要建立明确的优先级规则。
策略优化方向
-
动态参数调整:
- 根据市场波动率自动调整EMA周期和RSI参数
- 实现:使用ATR(平均真实波幅)指标来衡量波动率,据此动态调整参数
-
加入市场情绪指标:
- 引入VIX或PUT/CALL比率等情绪指标
- 目的:在极端市场情绪下过滤可能的假信号
-
优化止损机制:
- 考虑使用跟踪止损,如ATR倍数止损
- 优势:可以更好地适应市场波动,保护利润
-
引入时间框架分析:
- 在多个时间框架上验证信号
- 好处:减少假信号,提高交易的可靠性
-
整合基本面数据:
- 考虑加入经济日历事件、季度报告等基本面因素
- 目的:在重要事件前后调整策略敏感度,避免不必要的风险
-
机器学习优化:
- 使用机器学习算法优化参数选择和信号生成
- 潜力:可以自适应市场变化,提高策略的稳定性和盈利能力
总结
该"均线交叉、相对强弱指标、成交量价格趋势、吞没形态策略"是一个全面而复杂的交易系统,结合了多种技术分析工具和风险管理技术。通过整合EMA交叉、随机RSI、成交量价格关系分析以及蜡烛图形态识别,该策略旨在提供一个全方位的市场分析框架。
策略的主要优势在于其多维度分析能力和灵活的风险管理机制。通过结合趋势跟踪和反转预警系统,它能够在不同的市场环境中寻找交易机会。同时,基于吞没形态的动态止损和获利机制,为资金管理提供了一个系统化的方法。
然而,该策略也面临一些潜在风险,如过度交易、参数敏感性和市场环境依赖等。为了应对这些挑战,我们提出了几个优化方向,包括动态参数调整、引入市场情绪指标、优化止损机制、多时间框架分析、整合基本面数据以及应用机器学习技术。
总的来说,这是一个复杂而全面的交易策略,具有较强的适应性和潜力。通过持续优化和回测,它有望成为一个强大的交易工具。然而,使用者需要充分理解策略的原理和局限性,并在实际交易中谨慎应用。
||
Overview
This strategy is a comprehensive trading system that combines multiple technical analysis tools. It utilizes Exponential Moving Average (EMA) crossovers, Stochastic Relative Strength Index (RSI), volume-price relationships, and candlestick patterns to generate trading signals. The core of this strategy lies in analyzing market dynamics from multiple dimensions to improve the accuracy and reliability of trading decisions.
The main components of the strategy include:
- A crossover system based on 8-period and 20-period EMAs
- A trend indicator calculated using the relationship between volume and price
- Stochastic RSI for confirming trend reversals
- Bullish and bearish divergence detection mechanism
- Engulfing pattern recognition system
By integrating these elements, the strategy aims to capture market trend turning points while managing risk through stop-loss and profit-taking mechanisms.
Strategy Principles
-
EMA Crossover System:
- Buy signal generated when 8-period EMA crosses above 20-period EMA
- Sell signal generated when 8-period EMA crosses below 20-period EMA
-
Volume-Price Trend Calculation:
- Measures market sentiment through the ratio of volume to closing price
- Used for detecting potential bullish and bearish divergences
-
Stochastic RSI:
- Calculates 14-period stochastic RSI to confirm potential trend reversal points
-
Bullish and Bearish Divergence Detection:
- Compares recent lows/highs with the volume-price trend
- Bullish divergence identified when price makes new lows but volume-price trend rises
- Bearish divergence identified when price makes new highs but volume-price trend declines
-
Engulfing Pattern Recognition:
- Identifies bullish and bearish engulfing patterns
- Used for setting stop-loss and take-profit points
-
Trading Logic:
- Buy on bullish divergence or EMA golden cross
- Sell on bearish divergence or EMA death cross
- Set stop-loss on first occurrence of reverse engulfing pattern
- Close position for profit on second occurrence of reverse engulfing pattern
Strategy Advantages
-
Multi-dimensional Analysis: Combines technical indicators, volume analysis, and candlestick patterns for a more comprehensive market perspective.
-
Trend Following and Reversal Warning: EMA crossover system helps capture major trends, while divergence detection and engulfing patterns warn of potential reversals.
-
Risk Management: Uses engulfing patterns to set dynamic stop-loss and profit points, helping to control risk and lock in profits.
-
Flexibility: Strategy can adapt to different market conditions, profiting from both trending and oscillating markets.
-
Automation: Strategy can be programmed, reducing human emotional interference and improving execution efficiency.
-
Objectivity: Based on clear technical indicators and chart patterns, reducing bias from subjective judgments.
Strategy Risks
-
Overtrading: Frequent EMA crossovers in oscillating markets may lead to excessive trading, increasing transaction costs.
-
Lag: EMA and RSI are inherently lagging indicators, potentially missing important turning points in rapidly changing markets.
-
False Breakouts: Short-term false breakouts may occur during consolidation phases, leading to incorrect signals.
-
Parameter Sensitivity: Strategy effectiveness highly depends on EMA periods, RSI parameters, etc., which may require different optimizations for different markets.
-
Market Environment Dependency: May perform better in strong trend markets than in oscillating markets, requiring consideration of market cycles.
-
Signal Conflicts: Different indicators may produce contradictory signals, necessitating clear priority rules.
Strategy Optimization Directions
-
Dynamic Parameter Adjustment:
- Automatically adjust EMA periods and RSI parameters based on market volatility
- Implementation: Use ATR (Average True Range) indicator to measure volatility and adjust parameters accordingly
-
Incorporate Market Sentiment Indicators:
- Introduce sentiment indicators like VIX or PUT/CALL ratio
- Purpose: Filter potential false signals during extreme market sentiment
-
Optimize Stop-Loss Mechanism:
- Consider using trailing stops, such as ATR multiple stops
- Advantage: Better adapts to market volatility, protects profits
-
Introduce Multi-Timeframe Analysis:
- Verify signals across multiple timeframes
- Benefit: Reduces false signals, improves trade reliability
-
Integrate Fundamental Data:
- Consider adding economic calendar events, quarterly reports, and other fundamental factors
- Purpose: Adjust strategy sensitivity before and after important events, avoiding unnecessary risks
-
Machine Learning Optimization:
- Use machine learning algorithms to optimize parameter selection and signal generation
- Potential: Can adapt to market changes, improving strategy stability and profitability
Conclusion
This "EMA Crossover, RSI, Volume-Price Trend, and Engulfing Pattern Strategy" is a comprehensive and complex trading system that combines multiple technical analysis tools and risk management techniques. By integrating EMA crossovers, Stochastic RSI, volume-price relationship analysis, and candlestick pattern recognition, this strategy aims to provide a holistic market analysis framework.
The main advantages of the strategy lie in its multi-dimensional analysis capability and flexible risk management mechanism. By combining trend-following and reversal warning systems, it can seek trading opportunities in different market environments. Meanwhile, the dynamic stop-loss and profit-taking mechanism based on engulfing patterns provides a systematic approach to money management.
However, the strategy also faces potential risks such as overtrading, parameter sensitivity, and market environment dependency. To address these challenges, we have proposed several optimization directions, including dynamic parameter adjustment, incorporating market sentiment indicators, optimizing the stop-loss mechanism, multi-timeframe analysis, integrating fundamental data, and applying machine learning techniques.
Overall, this is a complex and comprehensive trading strategy with strong adaptability and potential. Through continuous optimization and backtesting, it has the potential to become a powerful trading tool. However, users need to fully understand the principles and limitations of the strategy and apply it cautiously in actual trading.
[/trans]
Source (PineScript)
/*backtest
start: 2023-07-23 00:00:00
end: 2024-07-28 00:00:00
period: 1d
basePeriod: 1h
exchanges: [{"eid":"Futures_Binance","currency":"BTC_USDT"}]
*/

//@version=5
strategy("Combined Strategy with Custom Signals and Reversal Patterns", overlay=true)

// Extract data
dataClose = close
dataVolume = volume
dataHigh = high
dataLow = low

// Calculate Volume-Price Relation
volume_price_trend = dataVolume / dataClose

// Calculate Stochastic RSI
stoch_rsi = ta.stoch(dataClose, dataClose, dataClose, 14)

// Calculate EMA
ema_12 = ta.ema(dataClose, 8)
ema_26 = ta.ema(dataClose, 20)

// Bullish Divergence
bullish_divergence = ((ta.lowest(dataLow, 6) < ta.lowest(dataLow, 7)) and (volume_price_trend > ta.lowest(volume_price_trend, 6)))

// Bearish Divergence
bearish_divergence = ((ta.highest(dataHigh, 6) > ta.highest(dataHigh, 7)) and (volume_price_trend < ta.highest(volume_price_trend, 6)))

// Check for buy signals
buy_signal = (bullish_divergence or ((ema_12 > ema_26) and (ema_12[1] <= ema_26[1]))) // Previous crossover point

// Check for sell signals
sell_signal = (bearish_divergence or ((ema_12 < ema_26) and (ema_12[1] >= ema_26[1]))) // Previous crossover point

// Plot custom signals
plotshape(buy_signal, style=shape.triangleup, location=location.belowbar, color=color.green, size=size.small, title="Buy Signal")
plotshape(sell_signal, style=shape.triangledown, location=location.abovebar, color=color.red, size=size.small, title="Sell Signal")

// Optional: Add alerts for buy and sell signals
alertcondition(buy_signal, title="Buy Signal Alert", message="Buy signal detected!")
alertcondition(sell_signal, title="Sell Signal Alert", message="Sell signal detected!")

// Define patterns for Reversal Candlestick Patterns
isBullishEngulfing() =>
    bullishEngulfing = close > open and close[1] < open[1] and close > open[1] and open < close[1]
    bullishEngulfing

isBearishEngulfing() =>
    bearishEngulfing = close < open and close[1] > open[1] and close < open[1] and open > close[1]
    bearishEngulfing

// Calculate patterns
bullishEngulfing = isBullishEngulfing()
bearishEngulfing = isBearishEngulfing()

// Plot reversal signals
plotshape(bullishEngulfing, title="Bullish Engulfing", location=location.belowbar, color=color.green, style=shape.labelup, text="Bull Eng")
plotshape(bearishEngulfing, title="Bearish Engulfing", location=location.abovebar, color=color.red, style=shape.labeldown, text="Bear Eng")

// Variables to count occurrences of engulfing patterns
var int bullishEngulfingCount = 0
var int bearishEngulfingCount = 0

// Strategy logic for combined signals and patterns
if (buy_signal)
    strategy.entry("Long", strategy.long)
if (sell_signal)
    strategy.entry("Short", strategy.short)

// Logic to increment the engulfing pattern counts
if (bullishEngulfing)
    bullishEngulfingCount += 1
else if (not bullishEngulfing)
    bullishEngulfingCount := 0

if (bearishEngulfing)
    bearishEngulfingCount += 1
else if (not bearishEngulfing)
    bearishEngulfingCount := 0

// Exit conditions based on engulfing patterns
if (bearishEngulfing and strategy.position_size > 0)
    strategy.close("Long")
if (bullishEngulfing and strategy.position_size < 0)
    strategy.close("Short")

// Exit conditions for the second occurrence of engulfing patterns for taking profit
if (bullishEngulfingCount == 2 and strategy.position_size < 0)
    strategy.close("Short")
if (bearishEngulfingCount == 2 and strategy.position_size > 0)
    strategy.close("Long")
Detail
https://www.fmz.com/strategy/458068
Last Modified
2024-07-29 16:56:08