
17 KiB
Name
EMA与CCI多重交叉趋势追踪策略-Multi-EMA-and-CCI-Crossover-Trend-Following-Strategy
Author
ChaoZhang
Strategy Description
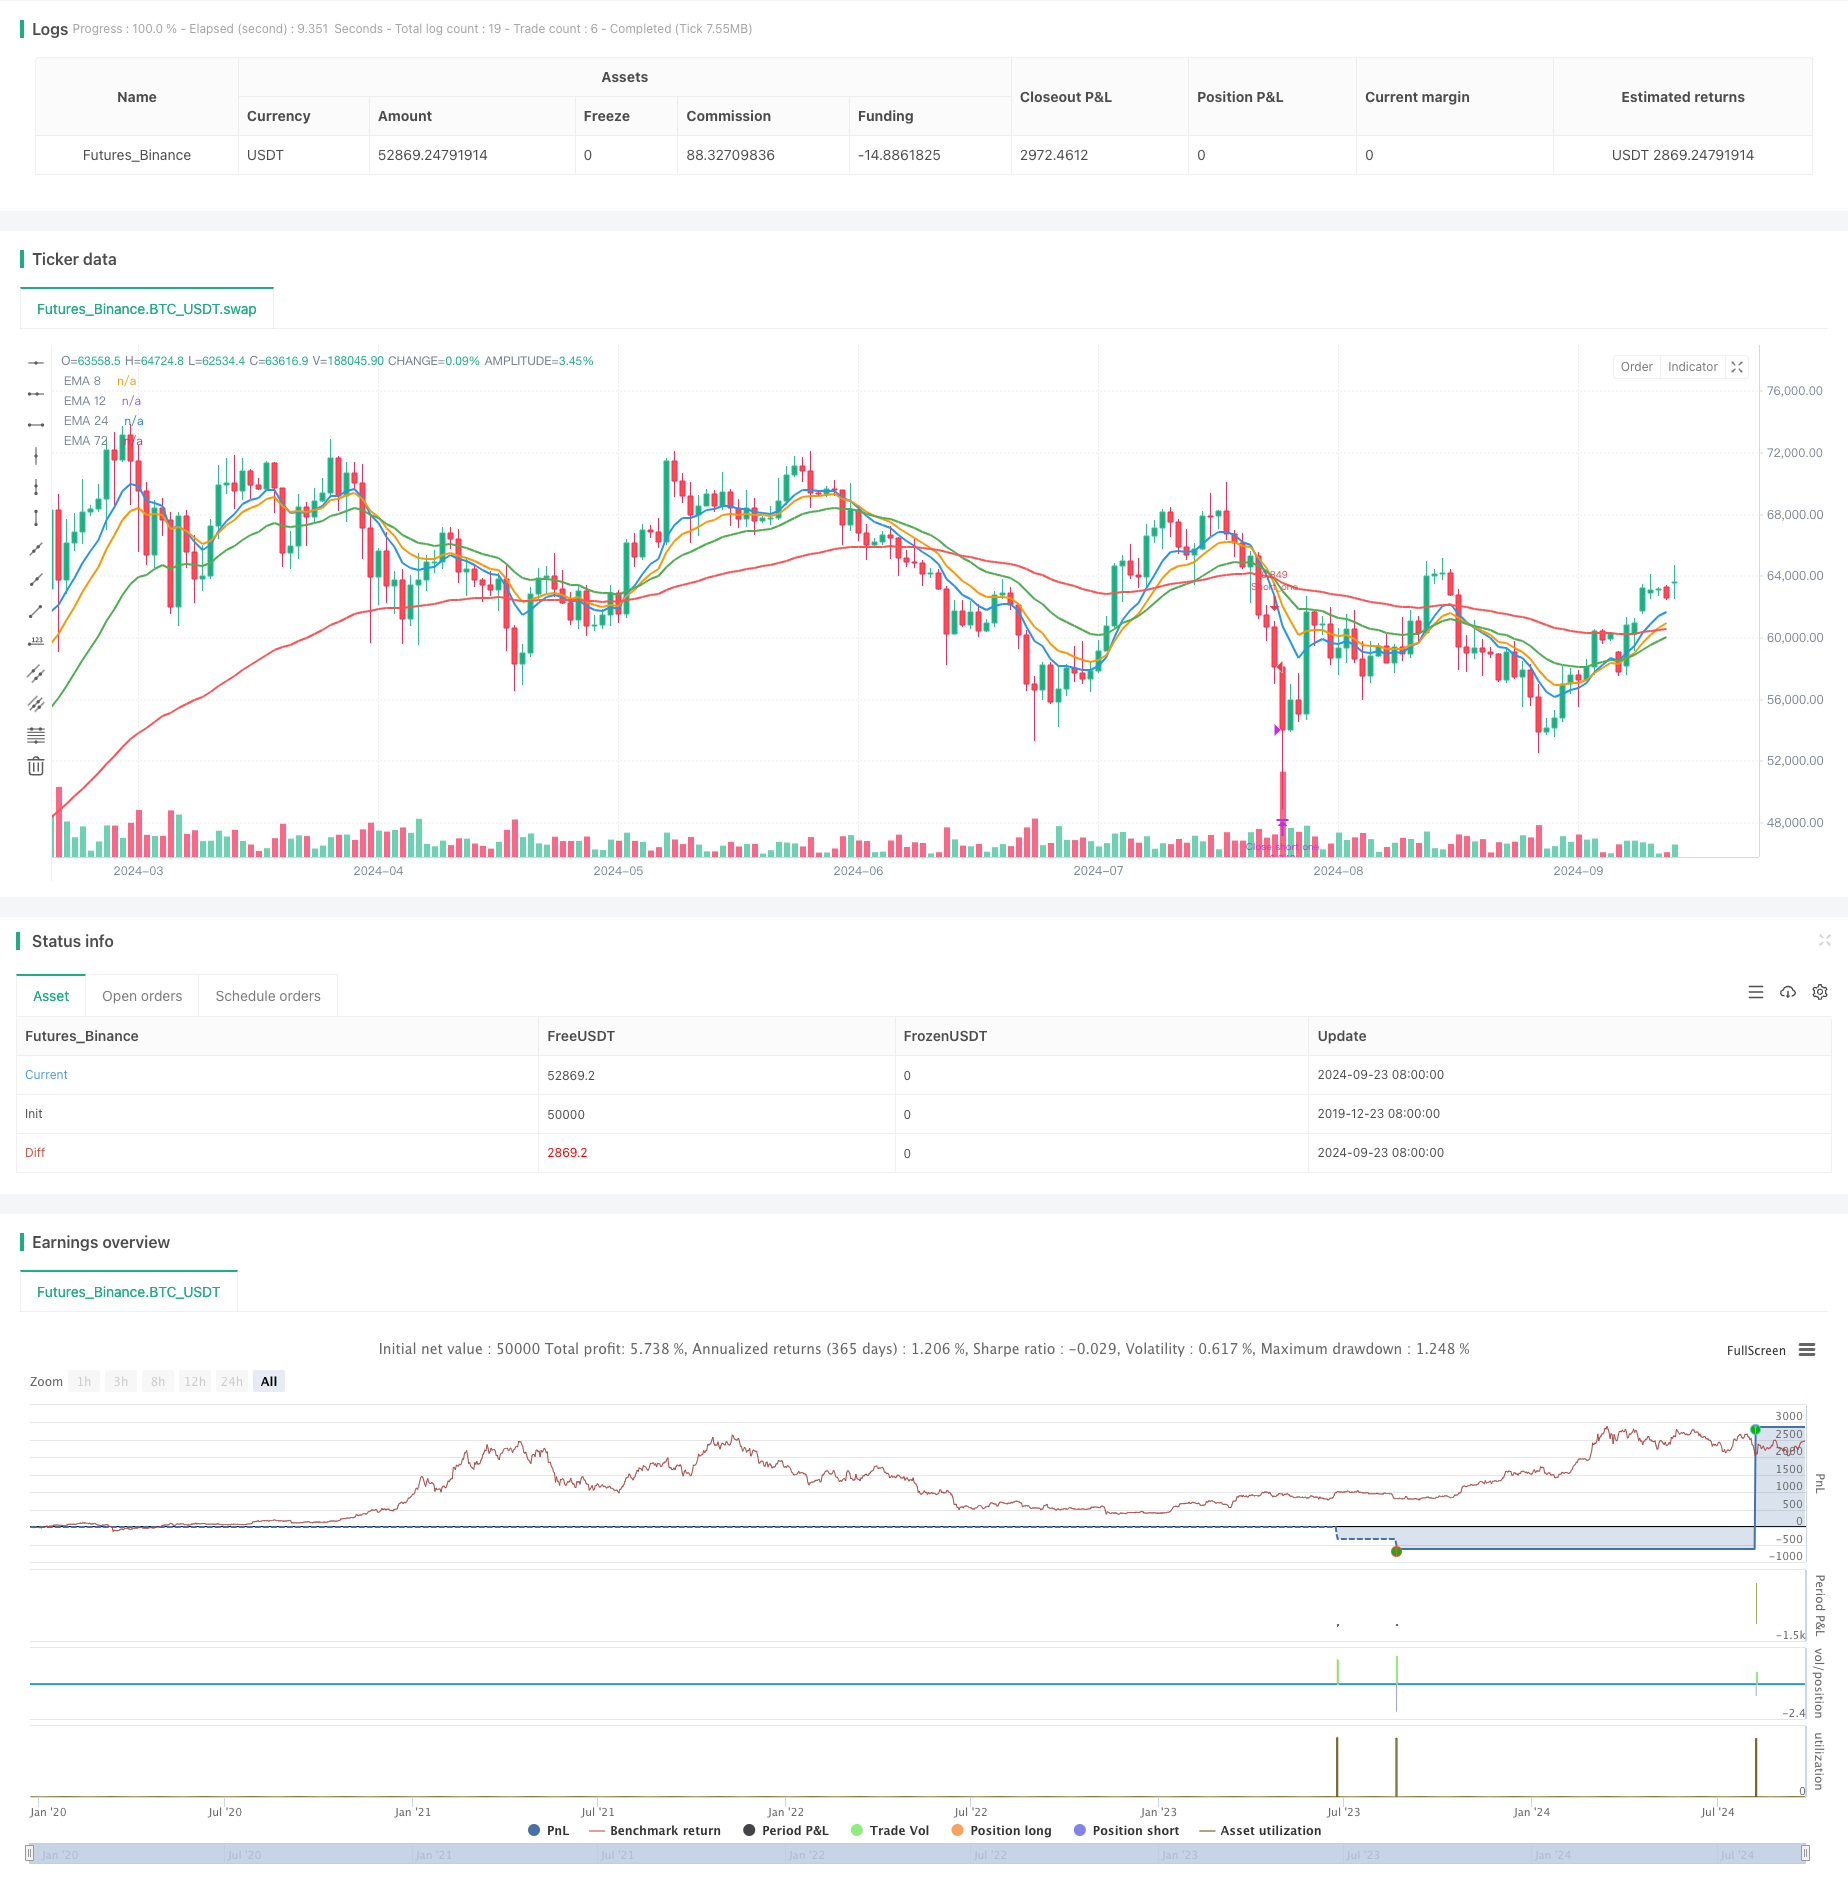
[trans]
概述
这是一个基于多重指数移动平均线(EMA)和商品通道指数(CCI)的趋势跟踪策略。该策略利用多个时间周期的EMA交叉来识别潜在的趋势变化,并结合CCI指标来确认市场超买或超卖状态,从而提高入场时机的准确性。策略还包含了基于时间和价格的动态止盈止损机制,以管理风险并锁定利润。
策略原理
该策略主要基于以下几个关键元素:
-
多重EMA交叉:使用8、12、24和72周期的EMA。当短周期EMA(8、12、24)同时上穿72周期EMA时,视为潜在的做多信号;反之则为做空信号。
-
CCI指标确认:使用20周期的CCI指标,当CCI大于150时确认超买状态,小于-150时确认超卖状态。
-
入场条件:
- 做多:短周期EMA同时上穿72周期EMA,且CCI大于150,价格在72周期EMA之上。
- 做空:短周期EMA同时下穿72周期EMA,且CCI小于-150,价格在72周期EMA之下。
-
动态止盈止损:
- 设置两种入场模式:一次性交叉和时间窗口内交叉。
- 根据不同入场模式,设置不同的止盈止损百分比。
-
仓位管理:策略采用全仓位交易,即使用账户100%的资金进行交易。
策略优势
-
多重确认机制:通过多重EMA交叉和CCI指标的配合,有效降低了虚假信号的影响,提高了入场准确性。
-
灵活的入场机制:策略考虑了一次性交叉和时间窗口内交叉两种情况,适应不同市场环境。
-
动态风险管理:根据不同入场模式设置不同的止盈止损比例,更好地平衡了收益和风险。
-
趋势跟踪能力:利用多重EMA交叉,能够有效捕捉中长期趋势的变化。
-
过滤震荡行情:通过CCI指标的超买超卖判断,有助于避免在横盘震荡市场频繁交易。
策略风险
-
滞后性:EMA和CCI都是滞后指标,可能在剧烈波动的市场中反应不够及时。
-
频繁交易:在震荡市场中,可能会产生较多的假突破信号,导致频繁交易和手续费增加。
-
全仓位风险:采用100%仓位交易可能带来较大的回撤风险。
-
固定百分比止损:在波动性较大的市场中,固定百分比止损可能会过早退出有利行情。
-
依赖历史数据:策略性能可能受历史数据影响,在未来市场环境发生变化时需要重新优化参数。
策略优化方向
-
引入波动率指标:考虑加入ATR(Average True Range)指标,根据市场波动调整止盈止损水平,以适应不同的市场环境。
-
优化仓位管理:引入动态仓位管理机制,根据市场趋势强度和账户风险承受能力调整仓位大小。
-
增加过滤条件:可以考虑加入成交量、趋势强度等指标,进一步过滤交易信号,提高胜率。
-
参数优化:使用遗传算法或网格搜索等方法,优化EMA周期、CCI阈值等参数,以提高策略在不同市场环境下的适应性。
-
加入市场regime识别:开发市场状态(趋势、震荡、高波动)识别模块,根据不同市场状态调整策略参数或暂停交易。
总结
EMA与CCI多重交叉趋势追踪策略是一个结合了技术分析和动态风险管理的量化交易系统。通过多重EMA交叉和CCI指标的配合,该策略能够有效捕捉市场趋势,同时通过灵活的入场机制和动态止盈止损来管理风险。虽然策略存在一些固有的风险,如滞后性和全仓位交易的潜在高回撤,但通过进一步优化和改进,如引入波动率调整、动态仓位管理和市场regime识别等方法,可以显著提高策略的稳定性和适应性。总的来说,这是一个具有良好基础的策略框架,有潜力在不同市场环境下产生稳定收益。
||
Overview
This is a trend-following strategy based on multiple Exponential Moving Averages (EMA) and the Commodity Channel Index (CCI). The strategy utilizes EMA crossovers from multiple time periods to identify potential trend changes, combined with the CCI indicator to confirm overbought or oversold market conditions, thereby improving the accuracy of entry timing. The strategy also includes dynamic take-profit and stop-loss mechanisms based on time and price to manage risk and lock in profits.
Strategy Principles
The strategy is primarily based on the following key elements:
-
Multiple EMA Crossovers: Uses 8, 12, 24, and 72-period EMAs. When shorter-period EMAs (8, 12, 24) simultaneously cross above the 72-period EMA, it's considered a potential long signal; the opposite is true for short signals.
-
CCI Indicator Confirmation: Uses a 20-period CCI indicator, confirming overbought conditions when CCI is above 150 and oversold conditions when below -150.
-
Entry Conditions:
- Long: Shorter-period EMAs simultaneously cross above the 72-period EMA, CCI is above 150, and price is above the 72-period EMA.
- Short: Shorter-period EMAs simultaneously cross below the 72-period EMA, CCI is below -150, and price is below the 72-period EMA.
-
Dynamic Take-Profit and Stop-Loss:
- Sets two entry modes: one-time crossover and crossover within a time window.
- Different take-profit and stop-loss percentages are set based on different entry modes.
-
Position Management: The strategy employs full position trading, using 100% of the account funds for trading.
Strategy Advantages
-
Multiple Confirmation Mechanism: The combination of multiple EMA crossovers and the CCI indicator effectively reduces the impact of false signals, improving entry accuracy.
-
Flexible Entry Mechanism: The strategy considers both one-time crossovers and crossovers within a time window, adapting to different market environments.
-
Dynamic Risk Management: Different take-profit and stop-loss ratios are set based on different entry modes, better balancing returns and risks.
-
Trend Following Capability: Utilizes multiple EMA crossovers to effectively capture medium to long-term trend changes.
-
Filtering Choppy Markets: The overbought and oversold judgments of the CCI indicator help avoid frequent trading in sideways, choppy markets.
Strategy Risks
-
Lag: Both EMA and CCI are lagging indicators, which may not react quickly enough in volatile markets.
-
Frequent Trading: In choppy markets, it may generate many false breakout signals, leading to frequent trading and increased transaction costs.
-
Full Position Risk: Using 100% position trading may bring significant drawdown risks.
-
Fixed Percentage Stop-Loss: In highly volatile markets, fixed percentage stop-losses may exit favorable trends too early.
-
Dependence on Historical Data: Strategy performance may be influenced by historical data and may need parameter re-optimization when future market conditions change.
Strategy Optimization Directions
-
Introduce Volatility Indicators: Consider adding the ATR (Average True Range) indicator to adjust take-profit and stop-loss levels based on market volatility, adapting to different market environments.
-
Optimize Position Management: Introduce dynamic position management mechanisms to adjust position size based on trend strength and account risk tolerance.
-
Add Filtering Conditions: Consider adding indicators such as volume and trend strength to further filter trading signals and improve win rates.
-
Parameter Optimization: Use genetic algorithms or grid search methods to optimize parameters such as EMA periods and CCI thresholds to improve strategy adaptability in different market environments.
-
Add Market Regime Recognition: Develop a market state (trend, choppy, high volatility) recognition module to adjust strategy parameters or pause trading based on different market states.
Summary
The Multi-EMA and CCI Crossover Trend Following Strategy is a quantitative trading system that combines technical analysis with dynamic risk management. Through the combination of multiple EMA crossovers and the CCI indicator, this strategy can effectively capture market trends while managing risk through flexible entry mechanisms and dynamic take-profit and stop-loss settings. Although the strategy has some inherent risks, such as lag and potential high drawdowns from full position trading, it can significantly improve stability and adaptability through further optimization and improvements, such as introducing volatility adjustments, dynamic position management, and market regime recognition. Overall, this is a strategy framework with a solid foundation and potential to generate stable returns in different market environments.
[/trans]
Source (PineScript)
/*backtest
start: 2019-12-23 08:00:00
end: 2024-09-24 08:00:00
period: 1d
basePeriod: 1d
exchanges: [{"eid":"Futures_Binance","currency":"BTC_USDT"}]
*/

//@version=5
strategy("EMA & CCI Strategy", overlay=true, default_qty_type=strategy.percent_of_equity, default_qty_value=100)

// Параметры EMA
ema8_length = 8
ema12_length = 12
ema24_length = 24
ema72_length = 72

// Расчет EMA
ema8 = ta.ema(close, ema8_length)
ema12 = ta.ema(close, ema12_length)
ema24 = ta.ema(close, ema24_length)
ema72 = ta.ema(close, ema72_length)

// Параметры CCI
cci_length = 20
cci_overbought = 150
cci_oversold = -150

// Параметры тейк-профита и стоп-лосса
takeProfitPercent = input.float(1.5, title="Take Profit (%)", step=0.1)
stopLossPercent = input.float(0.5, title="Stop Loss (%)", step=0.1)
takeProfitPercentTime = input.float(0.5, title="Take Profit (%) for Time-based", step=0.1)
stopLossPercentTime = input.float(0.2, title="Stop Loss (%) for Time-based", step=0.1)
max_wait_bars = input.float(2, title="Max wait candles", step=1)
// Расчет CCI
cci = ta.cci(close, cci_length)

// Состояние открытой позиции
sz = strategy.position_size

// Флаги для отслеживания пересечений EMA вверх
var int ema8_cross_index_up = na
var int ema12_cross_index_up = na
var int ema24_cross_index_up = na

// Флаги для отслеживания пересечений EMA вниз
var int ema8_cross_index_down = na
var int ema12_cross_index_down = na
var int ema24_cross_index_down = na

// Проверка пересечения EMA с 72 вверх и обновление индекса пересечения
if (ta.crossover(ema8, ema72))
    ema8_cross_index_up := bar_index
if (ta.crossover(ema12, ema72))
    ema12_cross_index_up := bar_index
if (ta.crossover(ema24, ema72))
    ema24_cross_index_up := bar_index

// Проверка пересечений EMA вниз и обновление индекса пересечения
if (ta.crossunder(ema8, ema72))
    ema8_cross_index_down := bar_index
if (ta.crossunder(ema12, ema72))
    ema12_cross_index_down := bar_index
if (ta.crossunder(ema24, ema72))
    ema24_cross_index_down := bar_index

// Условия пересечения за одну свечу (лонг и шорт)
cross_condition_one_candle_long = (na(ema8_cross_index_up) == false and (bar_index - ema8_cross_index_up) == 0) and
                                  (na(ema12_cross_index_up) == false and (bar_index - ema12_cross_index_up) == 0) and
                                  (na(ema24_cross_index_up) == false and (bar_index - ema24_cross_index_up) == 0)

cross_condition_one_candle_short = (na(ema8_cross_index_down) == false and (bar_index - ema8_cross_index_down) == 0) and
                                   (na(ema12_cross_index_down) == false and (bar_index - ema12_cross_index_down) == 0) and
                                   (na(ema24_cross_index_down) == false and (bar_index - ema24_cross_index_down) == 0)

// Условия пересечения в течение указанного времени (лонг и шорт)
cross_condition_within_time_long = (not na(ema8_cross_index_up) and (bar_index - ema8_cross_index_up) <= max_wait_bars) and
                                   (not na(ema12_cross_index_up) and (bar_index - ema12_cross_index_up) <= max_wait_bars) and
                                   (not na(ema24_cross_index_up) and (bar_index - ema24_cross_index_up) <= max_wait_bars)

cross_condition_within_time_short = (not na(ema8_cross_index_down) and (bar_index - ema8_cross_index_down) <= max_wait_bars) and (not na(ema12_cross_index_down) and (bar_index - ema12_cross_index_down) <= max_wait_bars) and (not na(ema24_cross_index_down) and (bar_index - ema24_cross_index_down) <= max_wait_bars)

// Условие для открытия лонга
long_condition_one = cross_condition_one_candle_long and cci > cci_overbought and close > ema72
long_condition_time = cross_condition_within_time_long and cci > cci_overbought and close > ema72

// Условие для открытия шорта
short_condition_one = cross_condition_one_candle_short and cci < cci_oversold and close < ema72
short_condition_time = cross_condition_within_time_short and cci < cci_oversold and close < ema72

// Вход в лонг
if (long_condition_one and sz == 0)
    strategy.entry(id='Long_one', direction=strategy.long)

if (long_condition_time and sz == 0)
    strategy.entry(id='Long_time', direction=strategy.long)

// Вход в шорт
if (short_condition_one and sz == 0)
    strategy.entry(id='Short_one', direction=strategy.short)

if (short_condition_time and sz == 0)
    strategy.entry(id='Short_time', direction=strategy.short)

// Вычисление цен тейк-профита и стоп-лосса для лонга
if (sz > 0 and strategy.opentrades.entry_id(0) == 'Long_one')
    entryPriceLong = strategy.opentrades.entry_price(0)
    takeProfitPriceLong = entryPriceLong * (1 + takeProfitPercent / 100)
    stopLossPriceLong = entryPriceLong * (1 - stopLossPercent / 100)
    strategy.exit("Close long one", "Long_one", limit=takeProfitPriceLong, stop=stopLossPriceLong)
    ema8_cross_index_up := na
    ema12_cross_index_up := na
    ema24_cross_index_up := na

if (sz > 0 and strategy.opentrades.entry_id(0) == 'Long_time')
    entryPriceLongTime = strategy.opentrades.entry_price(0)
    takeProfitPriceLongTime = entryPriceLongTime * (1 + takeProfitPercentTime / 100)
    stopLossPriceLongTime = entryPriceLongTime * (1 - stopLossPercentTime / 100)
    strategy.exit("Close long time", "Long_time", limit=takeProfitPriceLongTime, stop=stopLossPriceLongTime)
    ema8_cross_index_up := na
    ema12_cross_index_up := na
    ema24_cross_index_up := na

// Вычисление цен тейк-профита и стоп-лосса для шорта
if (sz < 0 and strategy.opentrades.entry_id(0) == 'Short_one')
    entryPriceShort = strategy.opentrades.entry_price(0)
    takeProfitPriceShort = entryPriceShort * (1 - takeProfitPercent / 100)
    stopLossPriceShort = entryPriceShort * (1 + stopLossPercent / 100)
    strategy.exit("Close short one", "Short_one", limit=takeProfitPriceShort, stop=stopLossPriceShort)
    ema8_cross_index_down := na
    ema12_cross_index_down := na
    ema24_cross_index_down := na

if (sz < 0 and strategy.opentrades.entry_id(0) == 'Short_time')
    entryPriceShortTime = strategy.opentrades.entry_price(0)
    takeProfitPriceShortTime = entryPriceShortTime * (1 - takeProfitPercentTime / 100)
    stopLossPriceShortTime = entryPriceShortTime * (1 + stopLossPercentTime / 100)
    strategy.exit("Close short time", "Short_time", limit=takeProfitPriceShortTime, stop=stopLossPriceShortTime)
    ema8_cross_index_down := na
    ema12_cross_index_down := na
    ema24_cross_index_down := na

// Отображение EMA на графике
plot(ema8, title="EMA 8", color=color.blue, linewidth=2)
plot(ema12, title="EMA 12", color=color.orange, linewidth=2)
plot(ema24, title="EMA 24", color=color.green, linewidth=2)
plot(ema72, title="EMA 72", color=color.red, linewidth=2)

// Вывод CCI в подвале
//plot(cci, title="CCI", color=color.purple)
//hline(100, "CCI 150", color=color.green)
//hline(-100, "CCI -150", color=color.red)
//hline(0, "CCI 0", color=color.gray)


// Отладочная информация
//plotshape(series=long_condition_one, location=location.belowbar, color=color.lime, style=shape.labelup, title="Long Condition")
//plotshape(series=cross_condition_one_candle_long, location=location.belowbar, color=color.blue, style=shape.triangleup, title="Cross Condition Long")
//plotshape(series=long_condition_time, location=location.belowbar, color=#e6d700, style=shape.labelup, title="Long Condition Time")
//plotshape(series=cross_condition_within_time_long, location=location.belowbar, color=#a21dbd, style=shape.triangleup, title="Cross Condition Time Long")
//plotshape(series=short_condition_one, location=location.abovebar, color=color.red, style=shape.labeldown, title="Short Condition")
//plotshape(series=cross_condition_one_candle_short, location=location.abovebar, color=color.blue, style=shape.triangledown, title="Cross Condition Short")
//plotshape(series=short_condition_time, location=location.abovebar, color=#e6d700, style=shape.labeldown, title="Short Condition Time")
//plotshape(series=cross_condition_within_time_short, location=location.abovebar, color=#a21dbd, style=shape.triangledown, title="Cross Condition Time Short")
Detail
https://www.fmz.com/strategy/468325
Last Modified
2024-09-26 15:43:50