
245 lines
15 KiB
Markdown
245 lines
15 KiB
Markdown
|
|
> Name
|
|
|
|
CCI动量背离趋势交易策略CCI-Momentum-Divergence-Trend-Trading-Strategy
|
|
|
|
> Author
|
|
|
|
ChaoZhang
|
|
|
|
> Strategy Description
|
|
|
|
|
|
|
|
[trans]
|
|
#### 概述
|
|
|
|
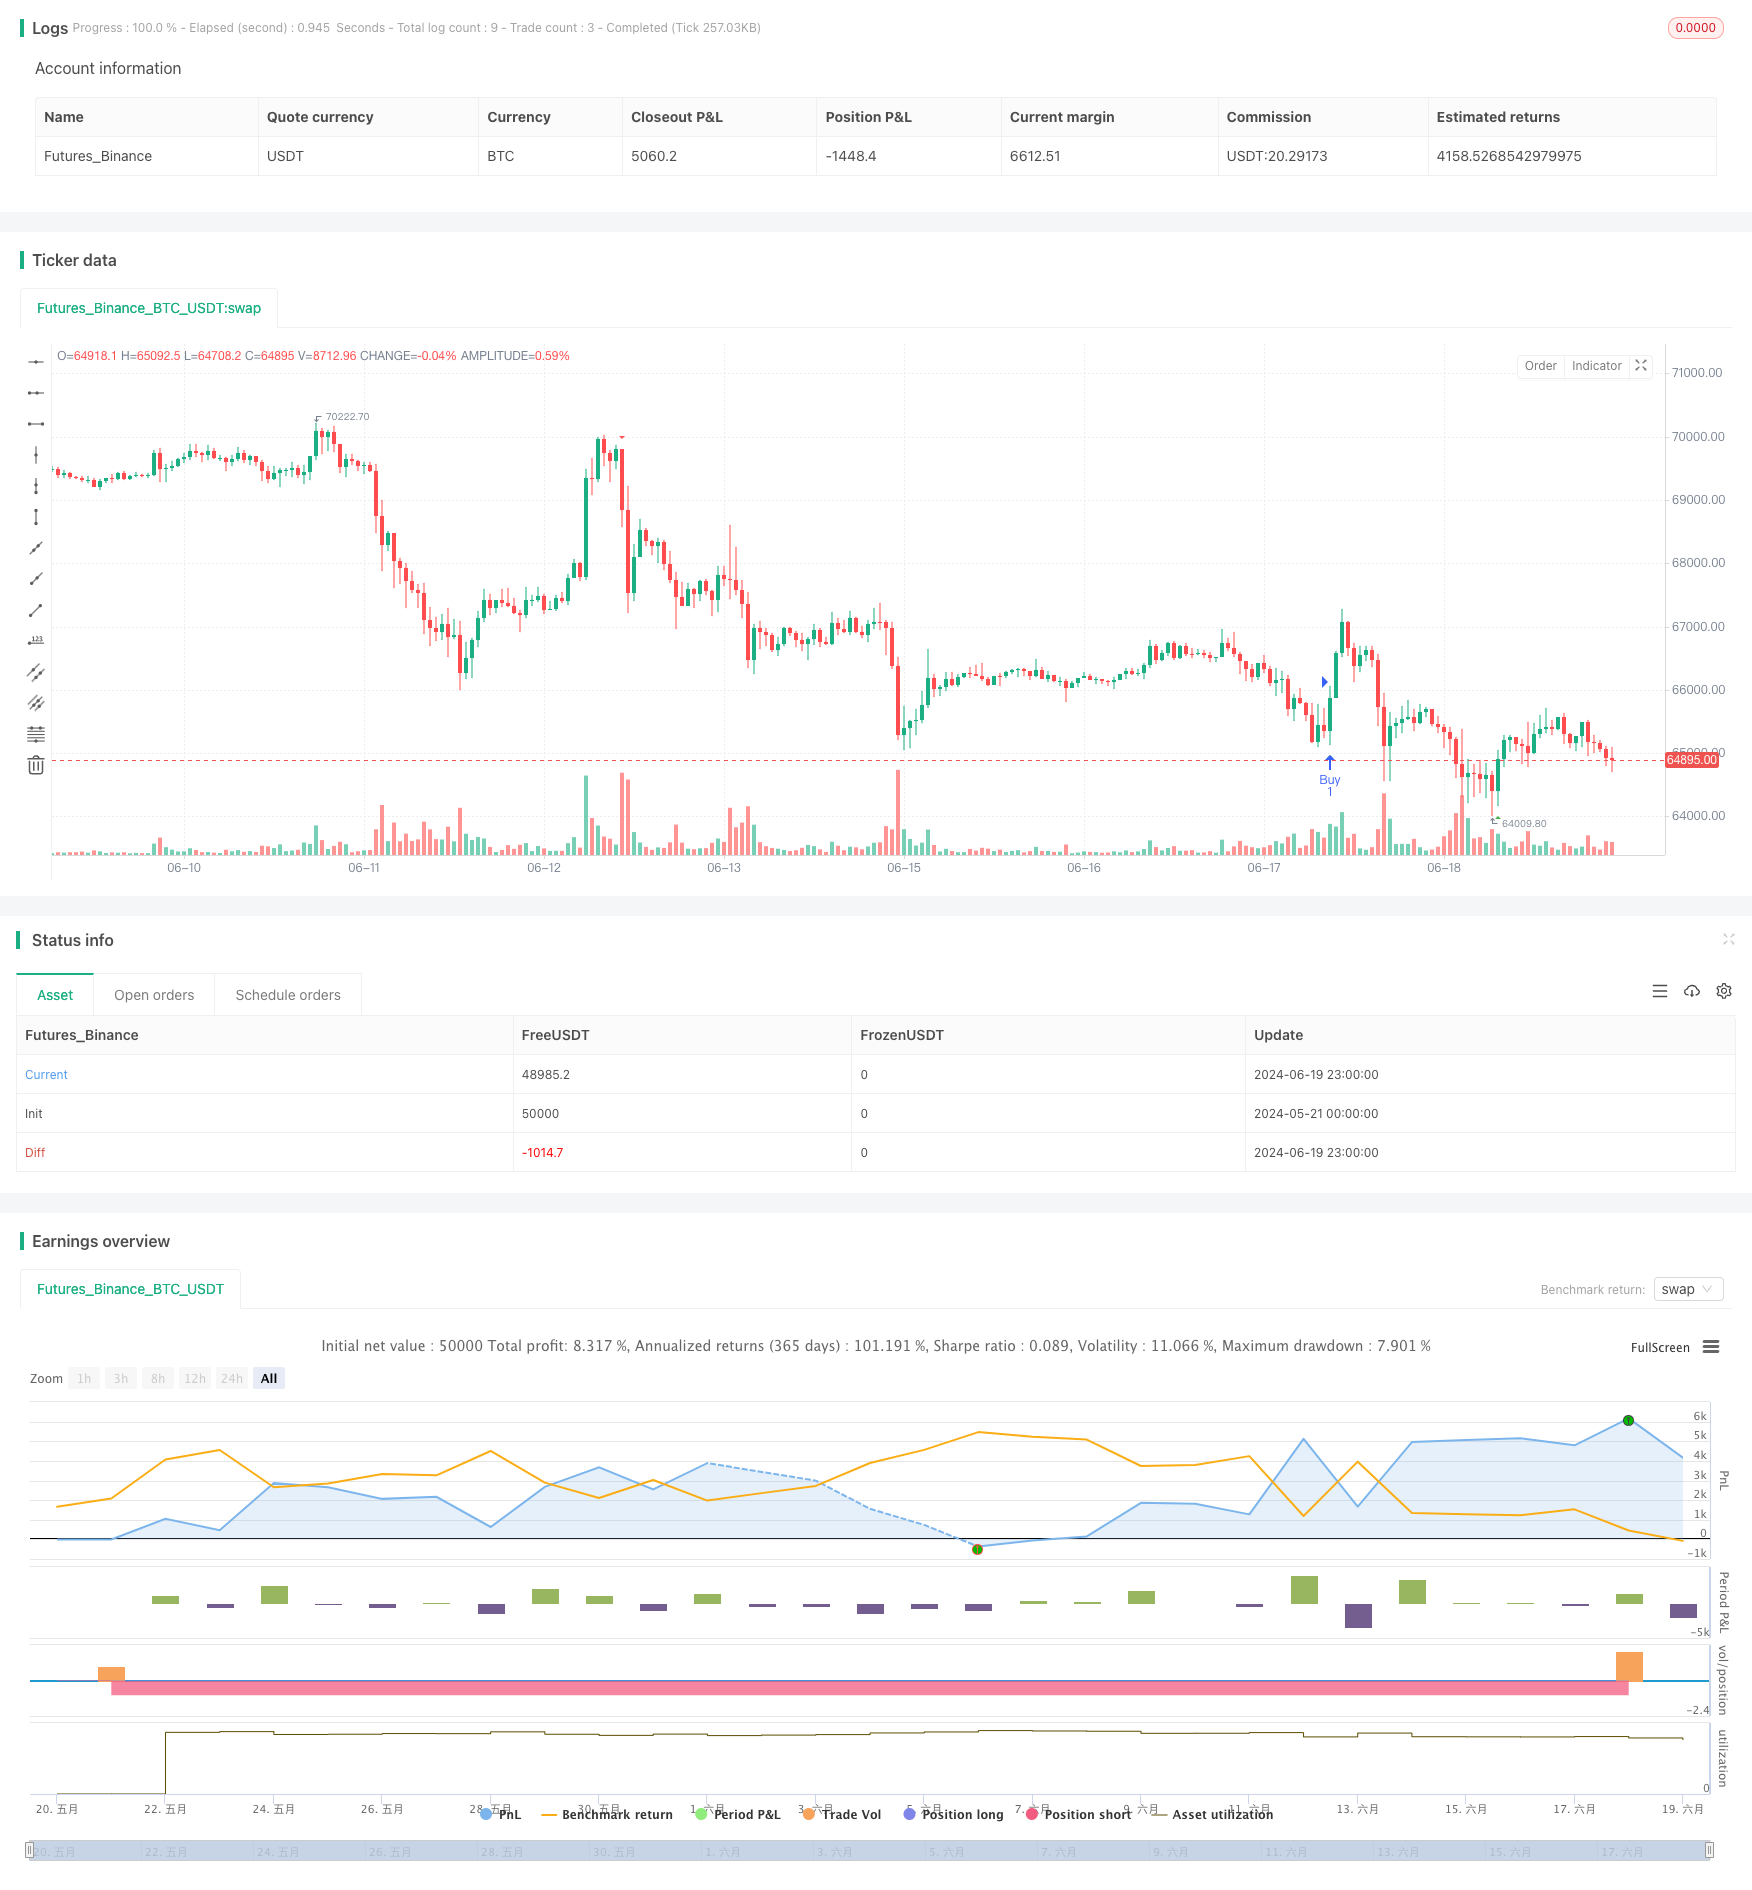
这个量化交易策略结合了CCI (商品通道指标)或动量指标、RSI (相对强弱指标)和背离分析,旨在捕捉市场趋势的转折点。该策略主要利用CCI或动量指标的零线交叉信号,结合RSI的超买超卖水平和潜在的背离模式来生成交易信号。这种多指标融合的方法旨在提高交易的准确性和可靠性,同时通过考虑多个市场因素来减少假信号。
|
|
|
|
#### 策略原理
|
|
|
|
1. 信号源选择:策略允许用户选择CCI或动量指标作为主要的信号源。这种灵活性使交易者能够根据个人偏好或特定市场条件调整策略。
|
|
|
|
2. 交叉信号:策略使用所选指标(CCI或动量)与零线的交叉来识别潜在的趋势变化。向上交叉被视为看涨信号,向下交叉被视为看跌信号。
|
|
|
|
3. RSI过滤:策略整合了RSI指标来确定市场是否处于超买或超卖状态。这有助于确认潜在的反转点,增加交易信号的可靠性。
|
|
|
|
4. 背离分析:策略可选择性地考虑RSI的常规背离。bullish背离(价格低点上升而RSI低点下降)被用作额外的看涨确认,而bearish背离则用作看跌确认。
|
|
|
|
5. 入场条件:
|
|
- 做多:当选定的指标向上穿越零线,RSI处于超卖区域,且(如果启用)出现bullish背离时。
|
|
- 做空:当选定的指标向下穿越零线,RSI处于超买区域,且(如果启用)出现bearish背离时。
|
|
|
|
6. 可视化:策略在图表上绘制买入和卖出信号,便于快速识别交易机会。
|
|
|
|
7. 警报:策略设置了条件触发警报,当生成买入或卖出信号时通知交易者。
|
|
|
|
#### 策略优势
|
|
|
|
1. 多指标融合:通过结合CCI/动量、RSI和背离分析,策略提供了一个全面的市场视角,有助于减少假信号并提高交易准确性。
|
|
|
|
2. 灵活性:允许用户选择CCI或动量作为主要信号源,使策略能够适应不同的市场环境和交易风格。
|
|
|
|
3. 趋势识别:利用零线交叉信号有效捕捉潜在的趋势变化,助力交易者及时进场。
|
|
|
|
4. 过滤机制:使用RSI的超买超卖水平作为过滤器,有助于避免在极端市场条件下的不利交易。
|
|
|
|
5. 背离确认:可选的背离分析为交易信号提供了额外的确认,增强了策略的可靠性。
|
|
|
|
6. 可视化和警报:通过图表上的信号标记和警报功能,交易者可以轻松识别和跟踪交易机会。
|
|
|
|
7. 参数化:策略的关键参数(如指标长度、RSI阈值等)都是可调整的,允许交易者根据具体需求进行优化。
|
|
|
|
#### 策略风险
|
|
|
|
1. 假信号风险:尽管策略采用了多重确认机制,但在剧烈波动的市场中仍可能产生假信号,导致不必要的交易。
|
|
|
|
2. 滞后性:所使用的指标都具有一定的滞后性,可能导致在快速变化的市场中错过一些交易机会或延迟入场。
|
|
|
|
3. 过度依赖技术指标:策略完全基于技术指标,忽视了基本面因素,这在某些市场情况下可能导致误判。
|
|
|
|
4. 参数敏感性:策略的性能可能对参数设置高度敏感,不当的参数选择可能导致策略表现不佳。
|
|
|
|
5. 市场条件变化:在某些市场条件下(如长期横盘或极端波动),策略可能表现不佳。
|
|
|
|
6. 过度交易:在某些市场条件下,策略可能生成过多的交易信号,增加交易成本并可能导致过度交易。
|
|
|
|
7. 背离识别的主观性:背离的识别可能存在一定的主观性,不同的交易者可能对同一市场情况有不同的解读。
|
|
|
|
#### 策略优化方向
|
|
|
|
1. 动态参数调整:实现参数的动态调整机制,使策略能够自适应不同的市场条件。例如,根据市场波动性自动调整RSI的超买超卖阈值。
|
|
|
|
2. 增加趋势过滤器:引入额外的趋势指标(如移动平均线)来确认整体市场趋势,只在趋势方向上开仓,以减少逆势交易。
|
|
|
|
3. 整合成交量分析:将成交量指标纳入策略,用于确认价格走势的有效性,提高信号质量。
|
|
|
|
4. 优化入场时机:在当前信号基础上,增加更精细的入场规则,如等待回调后再入场,以获得更好的价格。
|
|
|
|
5. 实现动态止损/止盈:根据市场波动性或关键支撑阻力位设置动态的止损止盈水平,改善风险管理。
|
|
|
|
6. 时间过滤:加入时间过滤器,避开波动性较大或流动性较低的时段,如市场开盘和收盘前后。
|
|
|
|
7. 多时间框架分析:整合多个时间框架的分析,以提高交易信号的可靠性和降低虚假信号的风险。
|
|
|
|
8. 机器学习优化:利用机器学习算法优化参数选择和信号生成过程,提高策略的适应性和性能。
|
|
|
|
#### 总结
|
|
|
|
CCI动量背离趋势交易策略是一个综合性的技术分析方法,它巧妙地结合了多个技术指标来捕捉市场趋势的转折点。通过融合CCI或动量指标的零线交叉信号、RSI的超买超卖水平以及可选的背离分析,该策略为交易者提供了一个全面的市场视角。
|
|
|
|
策略的主要优势在于其多层次的信号确认机制,这有助于提高交易的准确性和可靠性。同时,策略的灵活性允许交易者根据个人偏好和市场条件进行调整。然而,像所有技术分析策略一样,它也面临着假信号、滞后性和市场条件变化等风险。
|
|
|
|
为了进一步提高策略的稳健性和适应性,建议考虑实施动态参数调整、增加趋势过滤器、整合成交量分析等优化方向。这些改进可以帮助策略更好地应对不同的市场环境,减少假信号,并提高整体性能。
|
|
|
|
总的来说,这个策略为交易者提供了一个有潜力的框架,可以通过持续的优化和个性化调整,成为一个有效的交易工具。然而,使用者仍需谨慎,进行充分的回测和实盘验证,并始终牢记风险管理的重要性。
|
|
|
|
||
|
|
|
|
#### Overview
|
|
|
|
This quantitative trading strategy combines the CCI (Commodity Channel Index) or Momentum indicator with the RSI (Relative Strength Index) and divergence analysis to capture market trend reversal points. The strategy primarily uses the zero-line crossover signals of CCI or Momentum, combined with RSI overbought/oversold levels and potential divergence patterns to generate trading signals. This multi-indicator fusion approach aims to improve trading accuracy and reliability while reducing false signals by considering multiple market factors.
|
|
|
|
#### Strategy Principles
|
|
|
|
1. Signal Source Selection: The strategy allows users to choose either CCI or Momentum as the primary signal source. This flexibility enables traders to adjust the strategy according to personal preferences or specific market conditions.
|
|
|
|
2. Crossover Signals: The strategy uses the selected indicator's (CCI or Momentum) crossover with the zero line to identify potential trend changes. An upward crossover is seen as a bullish signal, while a downward crossover is considered bearish.
|
|
|
|
3. RSI Filtering: The strategy incorporates the RSI indicator to determine if the market is in overbought or oversold conditions. This helps confirm potential reversal points, increasing the reliability of trading signals.
|
|
|
|
4. Divergence Analysis: The strategy optionally considers regular divergence in RSI. Bullish divergence (price making higher lows while RSI makes lower lows) is used as additional bullish confirmation, while bearish divergence serves as bearish confirmation.
|
|
|
|
5. Entry Conditions:
|
|
- Long: When the selected indicator crosses above the zero line, RSI is in oversold territory, and (if enabled) bullish divergence is present.
|
|
- Short: When the selected indicator crosses below the zero line, RSI is in overbought territory, and (if enabled) bearish divergence is present.
|
|
|
|
6. Visualization: The strategy plots buy and sell signals on the chart for easy identification of trading opportunities.
|
|
|
|
7. Alerts: The strategy sets up conditional alerts to notify traders when buy or sell signals are generated.
|
|
|
|
#### Strategy Advantages
|
|
|
|
1. Multi-Indicator Fusion: By combining CCI/Momentum, RSI, and divergence analysis, the strategy provides a comprehensive market perspective, helping to reduce false signals and improve trading accuracy.
|
|
|
|
2. Flexibility: Allowing users to choose between CCI and Momentum as the primary signal source enables the strategy to adapt to different market environments and trading styles.
|
|
|
|
3. Trend Identification: Utilizing zero-line crossover signals effectively captures potential trend changes, helping traders enter positions in a timely manner.
|
|
|
|
4. Filtering Mechanism: Using RSI overbought/oversold levels as a filter helps avoid unfavorable trades in extreme market conditions.
|
|
|
|
5. Divergence Confirmation: Optional divergence analysis provides additional confirmation for trading signals, enhancing the strategy's reliability.
|
|
|
|
6. Visualization and Alerts: Through signal markers on the chart and alert functionality, traders can easily identify and track trading opportunities.
|
|
|
|
7. Parameterization: Key parameters of the strategy (such as indicator lengths, RSI thresholds) are adjustable, allowing traders to optimize according to specific needs.
|
|
|
|
#### Strategy Risks
|
|
|
|
1. False Signal Risk: Despite employing multiple confirmation mechanisms, the strategy may still generate false signals in highly volatile markets, leading to unnecessary trades.
|
|
|
|
2. Lagging Nature: The indicators used all have a certain degree of lag, which may result in missed trading opportunities or delayed entries in rapidly changing markets.
|
|
|
|
3. Over-reliance on Technical Indicators: The strategy is entirely based on technical indicators, ignoring fundamental factors, which may lead to misjudgments in certain market situations.
|
|
|
|
4. Parameter Sensitivity: The strategy's performance may be highly sensitive to parameter settings, and inappropriate parameter selection could lead to poor strategy performance.
|
|
|
|
5. Changing Market Conditions: The strategy may underperform in certain market conditions, such as prolonged sideways markets or extreme volatility.
|
|
|
|
6. Overtrading: In some market conditions, the strategy may generate too many trading signals, increasing transaction costs and potentially leading to overtrading.
|
|
|
|
7. Subjectivity in Divergence Identification: The identification of divergences may involve some subjectivity, and different traders may interpret the same market situation differently.
|
|
|
|
#### Strategy Optimization Directions
|
|
|
|
1. Dynamic Parameter Adjustment: Implement a mechanism for dynamic parameter adjustment, allowing the strategy to self-adapt to different market conditions. For example, automatically adjust RSI overbought/oversold thresholds based on market volatility.
|
|
|
|
2. Add Trend Filter: Introduce additional trend indicators (such as moving averages) to confirm overall market trends and only open positions in the trend direction to reduce counter-trend trades.
|
|
|
|
3. Integrate Volume Analysis: Incorporate volume indicators into the strategy to confirm the validity of price movements and improve signal quality.
|
|
|
|
4. Optimize Entry Timing: On the basis of current signals, add more refined entry rules, such as waiting for pullbacks before entering, to obtain better prices.
|
|
|
|
5. Implement Dynamic Stop-Loss/Take-Profit: Set dynamic stop-loss and take-profit levels based on market volatility or key support/resistance levels to improve risk management.
|
|
|
|
6. Time Filtering: Add time filters to avoid periods of high volatility or low liquidity, such as around market open and close.
|
|
|
|
7. Multiple Timeframe Analysis: Integrate analysis from multiple timeframes to increase the reliability of trading signals and reduce the risk of false signals.
|
|
|
|
8. Machine Learning Optimization: Utilize machine learning algorithms to optimize parameter selection and signal generation processes, improving the strategy's adaptability and performance.
|
|
|
|
#### Conclusion
|
|
|
|
The CCI Momentum Divergence Trend Trading Strategy is a comprehensive technical analysis method that cleverly combines multiple technical indicators to capture market trend reversal points. By fusing CCI or Momentum zero-line crossover signals, RSI overbought/oversold levels, and optional divergence analysis, this strategy provides traders with a comprehensive market perspective.
|
|
|
|
The main advantage of the strategy lies in its multi-layered signal confirmation mechanism, which helps improve trading accuracy and reliability. At the same time, the strategy's flexibility allows traders to adjust according to personal preferences and market conditions. However, like all technical analysis strategies, it also faces risks such as false signals, lagging nature, and changing market conditions.
|
|
|
|
To further improve the strategy's robustness and adaptability, it is recommended to consider implementing dynamic parameter adjustments, adding trend filters, integrating volume analysis, and other optimization directions. These improvements can help the strategy better cope with different market environments, reduce false signals, and enhance overall performance.
|
|
|
|
Overall, this strategy provides traders with a promising framework that can become an effective trading tool through continuous optimization and personalized adjustments. However, users should still exercise caution, conduct thorough backtesting and live trading validation, and always keep in mind the importance of risk management.
|
|
|
|
[/trans]
|
|
|
|
|
|
|
|
> Source (PineScript)
|
|
|
|
``` pinescript
|
|
/*backtest
|
|
start: 2024-05-21 00:00:00
|
|
end: 2024-06-20 00:00:00
|
|
period: 1h
|
|
basePeriod: 15m
|
|
exchanges: [{"eid":"Futures_Binance","currency":"BTC_USDT"}]
|
|
*/
|
|
|
|
//@version=5
|
|
strategy("bayush", overlay=true)
|
|
|
|
// Input settings
|
|
entrySignalSource = input.string("CCI", "Entry Signal Source", options=["CCI", "Momentum"], tooltip="Choose the entry signal source: CCI or Momentum")
|
|
ccimomLength = input.int(10, minval=1, title="CCI/Momentum Length")
|
|
useDivergence = input.bool(true, title="Use Divergence", tooltip="Consider regular bullish/bearish divergence")
|
|
rsiOverbought = input.int(65, minval=1, title="RSI Overbought Level")
|
|
rsiOversold = input.int(35, minval=1, title="RSI Oversold Level")
|
|
rsiLength = input.int(14, minval=1, title="RSI Length")
|
|
|
|
// Calculate CCI and Momentum
|
|
source = entrySignalSource == "Momentum" ? close - close[ccimomLength] : ta.cci(close, ccimomLength)
|
|
crossUp = ta.cross(source, 0)
|
|
crossDown = ta.cross(0, source)
|
|
|
|
// Calculate RSI
|
|
rsi = ta.rsi(close, rsiLength)
|
|
oversold = rsi <= rsiOversold or rsi[1] <= rsiOversold or rsi[2] <= rsiOversold or rsi[3] <= rsiOversold
|
|
overbought = rsi >= rsiOverbought or rsi[1] >= rsiOverbought or rsi[2] >= rsiOverbought or rsi[3] >= rsiOverbought
|
|
|
|
// Divergence Conditions
|
|
bullishDivergence = rsi[0] > rsi[1] and rsi[1] < rsi[2]
|
|
bearishDivergence = rsi[0] < rsi[1] and rsi[1] > rsi[2]
|
|
|
|
// Entry Conditions
|
|
longEntryCondition = crossUp and oversold and (not useDivergence or bullishDivergence)
|
|
shortEntryCondition = crossDown and overbought and (not useDivergence or bearishDivergence)
|
|
|
|
// Execute trades based on signals
|
|
strategy.entry("Buy", strategy.long, when=longEntryCondition)
|
|
strategy.entry("Sell", strategy.short, when=shortEntryCondition)
|
|
|
|
// Plot buy and sell signals
|
|
plotshape(series=longEntryCondition, style=shape.triangleup, location=location.belowbar, color=color.green, size=size.small, title="Buy Signal")
|
|
plotshape(series=shortEntryCondition, style=shape.triangledown, location=location.abovebar, color=color.red, size=size.small, title="Sell Signal")
|
|
|
|
// Entry signal alerts
|
|
alertcondition(longEntryCondition, title="BUY Signal", message="Buy Entry Signal")
|
|
alertcondition(shortEntryCondition, title="SELL Signal", message="Sell Entry Signal")
|
|
```
|
|
|
|
> Detail
|
|
|
|
https://www.fmz.com/strategy/454730
|
|
|
|
> Last Modified
|
|
|
|
2024-06-21 14:07:45
|