
213 lines
7.4 KiB
Markdown
213 lines
7.4 KiB
Markdown
|
|
> Name
|
|
|
|
BollingerRSI双重策略仅多头v12Bollinger-RSI-Double-Strategy-Long-Only-v12
|
|
|
|
> Author
|
|
|
|
ChaoZhang
|
|
|
|
> Strategy Description
|
|
|
|
|
|
[trans]
|
|
|
|
## 一、策略名称
|
|
Bollinger+RSI双重多头策略
|
|
|
|
## 二、策略概述
|
|
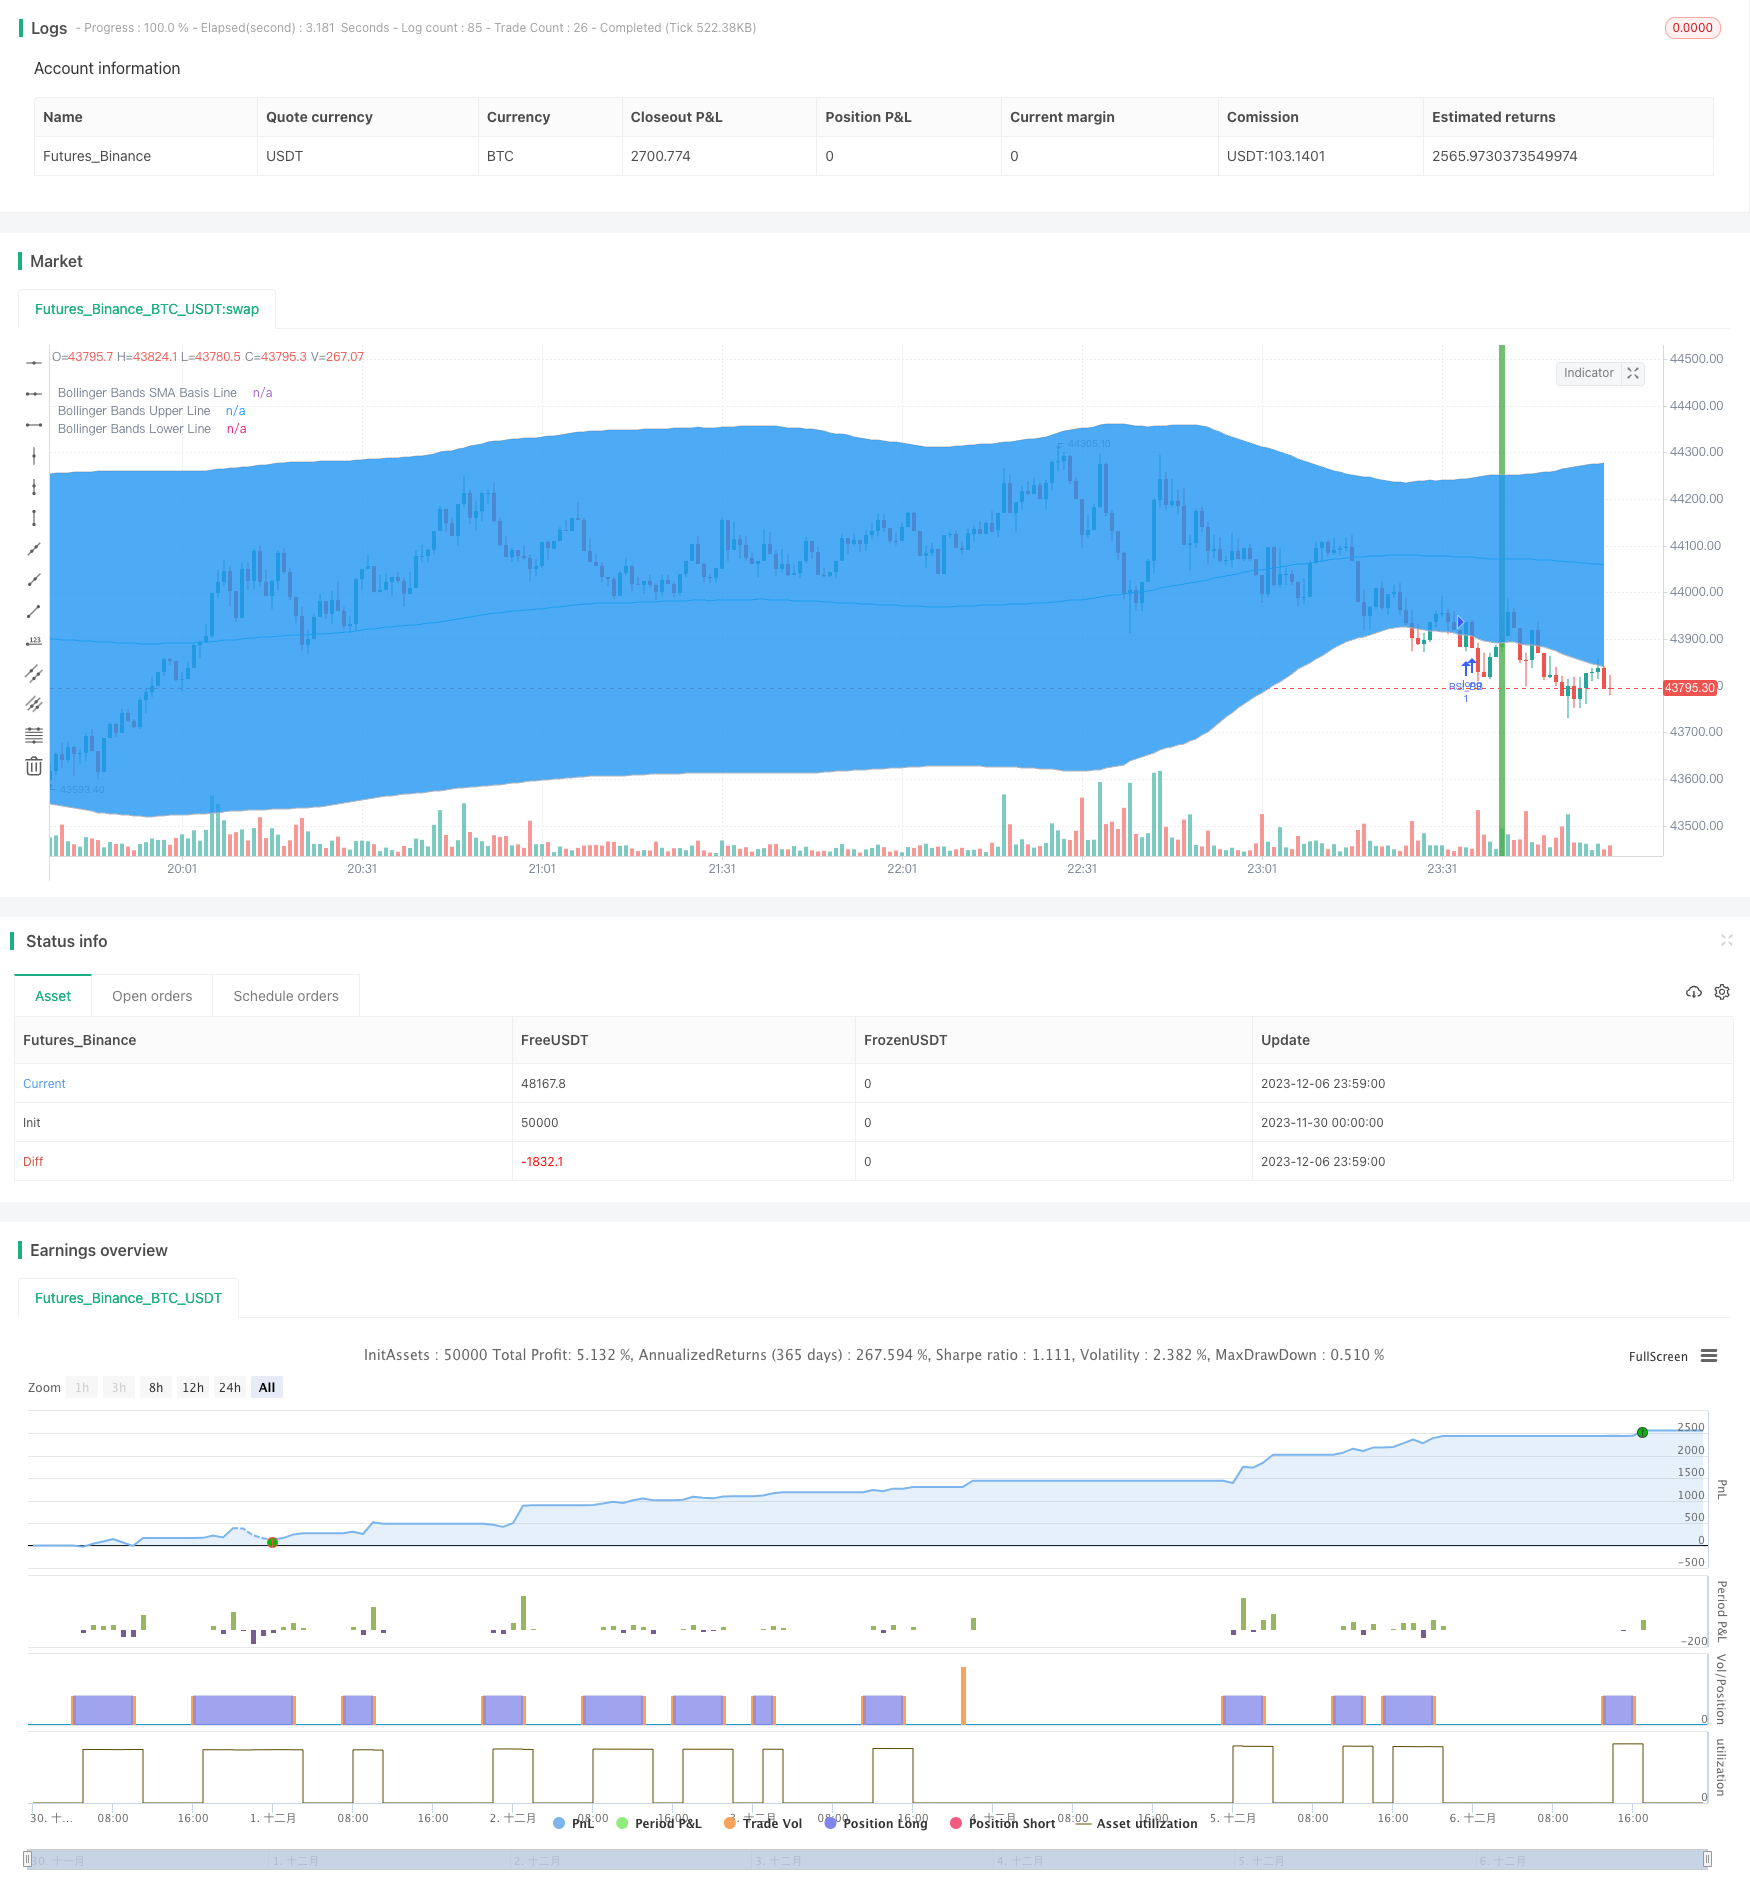
本策略利用布林线指标与RSI指标的组合,在两者同时显示超卖信号时建仓做多,在两者同时显示超买信号时平仓。相比单一指标,能更可靠确认交易信号,避免假信号。
|
|
|
|
## 三、策略原理
|
|
1. 使用RSI指标判断超买超卖
|
|
- RSI低于50视为超卖
|
|
- RSI高于50视为超买
|
|
2. 使用布林线判断价格异常
|
|
- 价格低于下轨视为超卖
|
|
- 价格高于上轨视为超买
|
|
3. 当RSI和布林线同时显示超卖信号时,做多建仓
|
|
- RSI指标线低于50
|
|
- 价格线低于布林线下轨
|
|
4. 当RSI和布林线同时显示超买信号时,平仓
|
|
- RSI指标线高于50
|
|
- 价格线高于布林线上轨
|
|
|
|
## 四、策略优势
|
|
1. 两种指标结合,信号更可靠,避免假信号
|
|
2. 仅建立多头仓位,简化逻辑,降低交易风险
|
|
|
|
## 五、策略风险及解决方法
|
|
1. 布林线参数设置不当,上下轨限制太宽泛,增加误交易风险
|
|
- 优化布林线参数,合理设置布林线周期及标准差
|
|
2. RSI参数设置不当,超买超卖判断标准不当,增加误交易风险
|
|
- 优化RSI参数,调整RSI周期,合理设置超买超卖标准
|
|
3. 行情不具有趋势性时, Ravin效果不佳
|
|
- 结合趋势型指标,避免震荡行情操作
|
|
|
|
## 六、策略优化方向
|
|
1. 优化布林线及RSI参数设置
|
|
2. 增加止损机制
|
|
3. 结合MACD等趋势型指标
|
|
4. 增加短线与长线结合判断
|
|
|
|
## 七、总结
|
|
本策略结合布林线与RSI两种指标的优势,在两者同时显示超买超卖信号时交易,避免单一指标产生的假信号,从而提高信号准确率。相比先前版本,仅建立多头仓位,降低了交易风险。后续可通过参数优化、止损机制、与趋势型指标结合等方式进行策略优化,使之更适应不同市场环境。
|
|
|
|
||
|
|
|
|
## I. Strategy Name
|
|
Bollinger Bands + RSI Double Long Strategy
|
|
|
|
## II. Strategy Overview
|
|
This strategy combines the Bollinger Bands indicator and the RSI indicator to go long when both show an oversold signal, and to close the long position when both show an overbought signal. Compared with a single indicator, it can more reliably confirm trading signals and avoid false signals.
|
|
|
|
## III. Strategy Principle
|
|
1. Use RSI indicator to judge overbought/oversold
|
|
- RSI below 50 is considered oversold
|
|
- RSI above 50 is considered overbought
|
|
2. Use Bollinger Bands to judge price extremes
|
|
- Price below lower band is oversold
|
|
- Price above upper band is overbought
|
|
3. Go long when both RSI and Bollinger Bands show oversold signal
|
|
- RSI below 50
|
|
- Price below Bollinger lower band
|
|
4. Close long position when both RSI and Bollinger Bands show overbought signal
|
|
- RSI above 50
|
|
- Price above Bollinger upper band
|
|
|
|
## IV. Strategy Strengths
|
|
1. Combining two indicators makes signals more reliable and avoids false signals
|
|
2. Only long positions simplify logic and reduce trading risk
|
|
|
|
## V. Strategy Risks and Solutions
|
|
1. Improper Bollinger Bands parameter setting, too wide upper/lower bands increase false trading risk
|
|
- Optimize Bollinger Bands parameters, set reasonable period and standard deviation
|
|
2. Improper RSI parameter setting, wrong overbought/oversold standards increase false trading risk
|
|
- Optimize RSI parameters, adjust RSI period, set reasonable overbought/oversold standards
|
|
3. Poor profitability when market lacks a trend
|
|
- Combine with trend indicators to avoid choppy markets
|
|
|
|
## VI. Strategy Optimization Directions
|
|
1. Optimize Bollinger Bands and RSI parameter settings
|
|
2. Add stop loss mechanism
|
|
3. Combine with trend indicators like MACD
|
|
4. Add combination of short-term and long-term analysis
|
|
|
|
## VII. Summary
|
|
This strategy combines the strengths of Bollinger Bands and RSI indicators to trade when both show extremes. This avoids false signals from a single indicator and improves signal accuracy. Compared to previous versions, only establishing long positions reduces trading risk. Future optimizations can be done through parameter tuning, stop loss mechanisms, combining with trend indicators etc. to make the strategy adaptable to different market environments.[/trans]
|
|
|
|
> Strategy Arguments
|
|
|
|
|
|
|
|
|Argument|Default|Description|
|
|
|----|----|----|
|
|
|v_input_1|6|RSI Period Length|
|
|
|v_input_2|200|Bollinger Period Length|
|
|
|v_input_3|true|Enable Bar Color?|
|
|
|v_input_4|true|Enable Background Color?|
|
|
|
|
|
|
> Source (PineScript)
|
|
|
|
``` pinescript
|
|
/*backtest
|
|
start: 2023-11-30 00:00:00
|
|
end: 2023-12-07 00:00:00
|
|
period: 1m
|
|
basePeriod: 1m
|
|
exchanges: [{"eid":"Futures_Binance","currency":"BTC_USDT"}]
|
|
*/
|
|
|
|
//@version=3
|
|
strategy("Bollinger + RSI, Double Strategy Long-Only (by ChartArt) v1.2", shorttitle="CA_-_RSI_Bol_Strat_1.2", overlay=true)
|
|
|
|
// ChartArt's RSI + Bollinger Bands, Double Strategy UPDATE: Long-Only
|
|
//
|
|
// Version 1.2
|
|
// Idea by ChartArt on October 4, 2017.
|
|
//
|
|
// This strategy uses the RSI indicator
|
|
// together with the Bollinger Bands
|
|
// to buy when the price is below the
|
|
// lower Bollinger Band (and to close the
|
|
// long trade when this value is above
|
|
// the upper Bollinger band).
|
|
//
|
|
// This simple strategy only longs when
|
|
// both the RSI and the Bollinger Bands
|
|
// indicators are at the same time in
|
|
// a oversold condition.
|
|
//
|
|
// In this new version 1.2 the strategy was
|
|
// simplified by going long-only, which made
|
|
// it more successful in backtesting.
|
|
//
|
|
// List of my work:
|
|
// https://www.tradingview.com/u/ChartArt/
|
|
//
|
|
// __ __ ___ __ ___
|
|
// / ` |__| /\ |__) | /\ |__) |
|
|
// \__, | | /~~\ | \ | /~~\ | \ |
|
|
//
|
|
//
|
|
|
|
|
|
///////////// RSI
|
|
RSIlength = input(6,title="RSI Period Length")
|
|
RSIoverSold = 50
|
|
RSIoverBought = 50
|
|
price = close
|
|
vrsi = rsi(price, RSIlength)
|
|
|
|
|
|
///////////// Bollinger Bands
|
|
BBlength = input(200, minval=1,title="Bollinger Period Length")
|
|
BBmult = 2 // input(2.0, minval=0.001, maxval=50,title="Bollinger Bands Standard Deviation")
|
|
BBbasis = sma(price, BBlength)
|
|
BBdev = BBmult * stdev(price, BBlength)
|
|
BBupper = BBbasis + BBdev
|
|
BBlower = BBbasis - BBdev
|
|
source = close
|
|
buyEntry = crossover(source, BBlower)
|
|
sellEntry = crossunder(source, BBupper)
|
|
plot(BBbasis, color=aqua,title="Bollinger Bands SMA Basis Line")
|
|
p1 = plot(BBupper, color=silver,title="Bollinger Bands Upper Line")
|
|
p2 = plot(BBlower, color=silver,title="Bollinger Bands Lower Line")
|
|
fill(p1, p2)
|
|
|
|
|
|
///////////// Colors
|
|
switch1=input(true, title="Enable Bar Color?")
|
|
switch2=input(true, title="Enable Background Color?")
|
|
TrendColor = RSIoverBought and (price[1] > BBupper and price < BBupper) and BBbasis < BBbasis[1] ? red : RSIoverSold and (price[1] < BBlower and price > BBlower) and BBbasis > BBbasis[1] ? green : na
|
|
barcolor(switch1?TrendColor:na)
|
|
bgcolor(switch2?TrendColor:na,transp=50)
|
|
|
|
|
|
///////////// RSI + Bollinger Bands Strategy
|
|
long = (crossover(vrsi, RSIoverSold) and crossover(source, BBlower))
|
|
close_long = (crossunder(vrsi, RSIoverBought) and crossunder(source, BBupper))
|
|
|
|
if (not na(vrsi))
|
|
|
|
if long
|
|
strategy.entry("RSI_BB", strategy.long, stop=BBlower, comment="RSI_BB")
|
|
else
|
|
strategy.cancel(id="RSI_BB")
|
|
|
|
if close_long
|
|
strategy.close("RSI_BB")
|
|
|
|
|
|
//plot(strategy.equity, title="equity", color=red, linewidth=2, style=areabr)
|
|
```
|
|
|
|
> Detail
|
|
|
|
https://www.fmz.com/strategy/434670
|
|
|
|
> Last Modified
|
|
|
|
2023-12-08 10:39:52
|