
178 lines
10 KiB
Markdown
178 lines
10 KiB
Markdown
|
|
> Name
|
|
|
|
Bollinger-Bands动量反转量化策略Bollinger-Bands-Momentum-Reversal-Quantitative-Strategy
|
|
|
|
> Author
|
|
|
|
ChaoZhang
|
|
|
|
> Strategy Description
|
|
|
|
|
|
|
|
[trans]
|
|
#### 概述
|
|
|
|
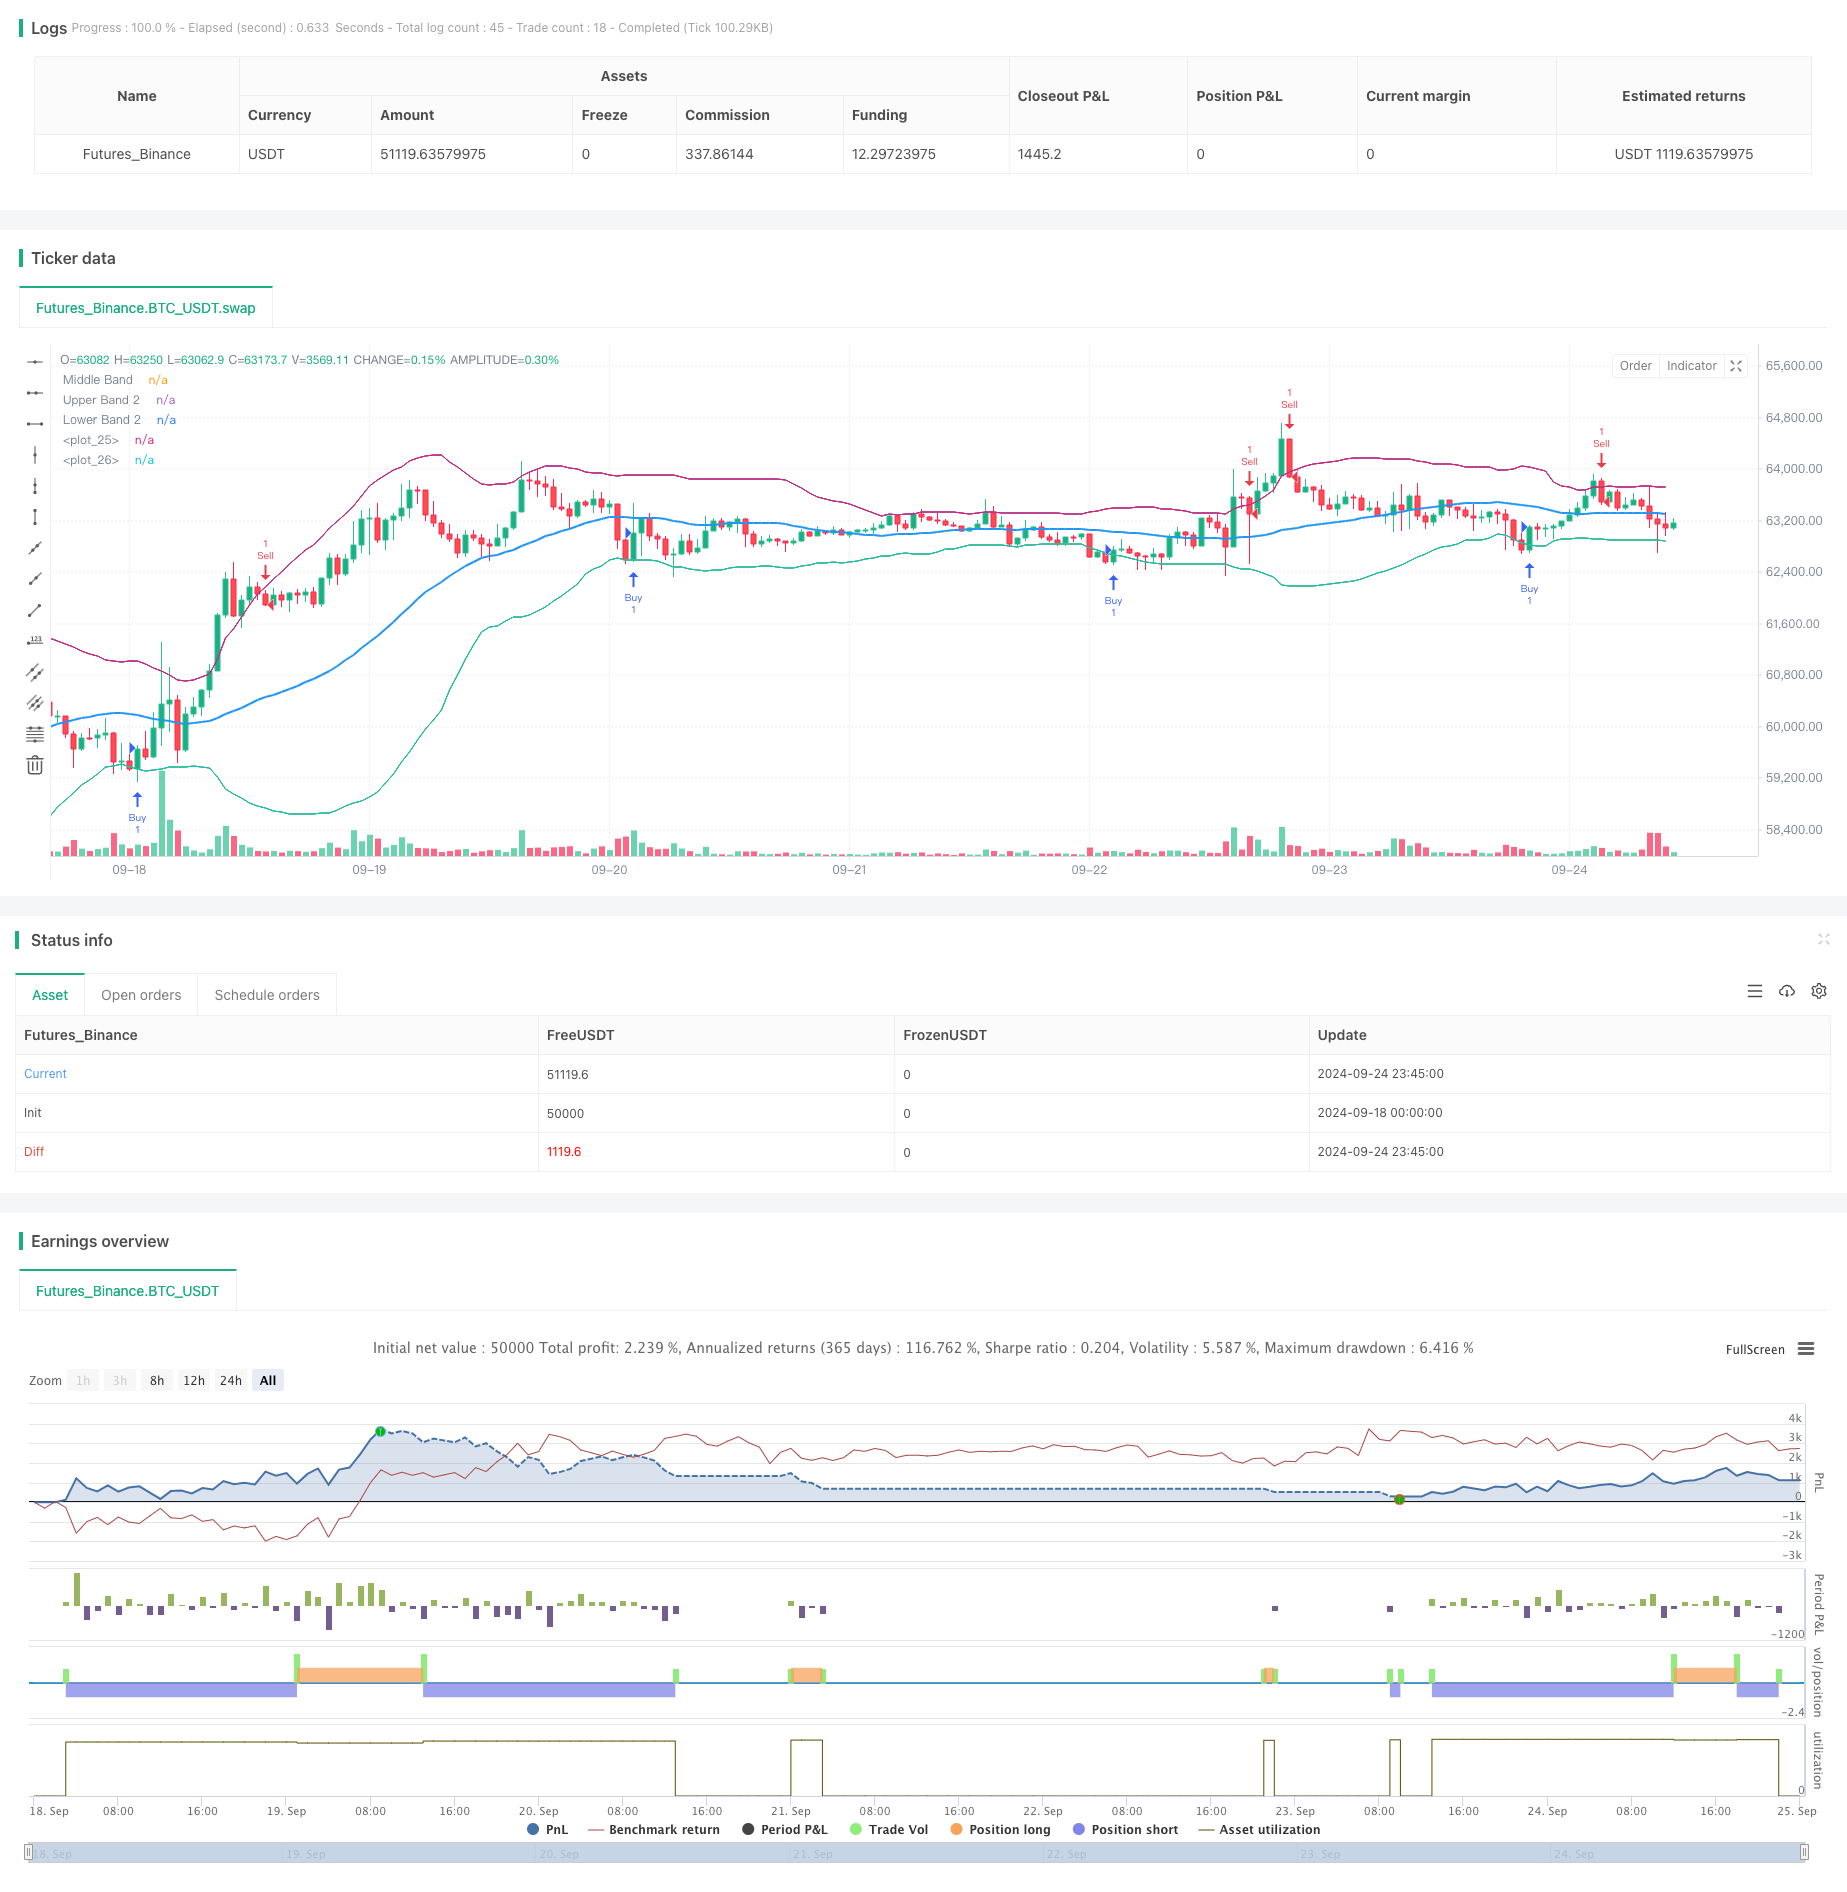
Bollinger Bands动量反转量化策略是一种基于技术分析的交易系统,主要利用Bollinger Bands指标来识别市场的超买和超卖状态,从而捕捉潜在的反转机会。该策略通过观察价格与Bollinger Bands上下轨的交叉来判断入场时机,同时采用动态止损来控制风险。这种方法结合了趋势跟踪和反转交易的理念,旨在在市场波动中获取利润。
|
|
|
|
#### 策略原理
|
|
|
|
该策略的核心原理是利用Bollinger Bands来识别市场的极端状态并预测可能的反转。具体来说:
|
|
|
|
1. 使用34周期的简单移动平均线(SMA)作为Bollinger Bands的中轨。
|
|
2. 上下轨分别设置为中轨加减2倍标准差。
|
|
3. 当价格从下穿越下轨后又回到下轨之上时,视为超卖反转信号,开立多头仓位。
|
|
4. 当价格从上穿越上轨后又回到上轨之下时,视为超买反转信号,开立空头仓位。
|
|
5. 对于多头仓位,止损设置在下轨之下;对于空头仓位,止损设置在上轨之上。
|
|
|
|
这种设计允许策略在市场出现极端走势时进行交易,同时通过动态止损来限制潜在损失。
|
|
|
|
#### 策略优势
|
|
|
|
1. 客观性强:使用明确的数学模型(Bollinger Bands)来定义市场状态,减少主观判断带来的偏差。
|
|
2. 风险管理完善:通过动态止损机制,根据市场波动性自动调整风险敞口。
|
|
3. 适应性好:Bollinger Bands能够根据市场波动性自动调整,使策略在不同市场环境下保持相对稳定的表现。
|
|
4. 反转捕捉能力:专注于捕捉市场超买超卖后的反转,有潜力在震荡市场中获得良好收益。
|
|
5. 简单易懂:策略逻辑直观,易于理解和实施,适合不同经验水平的交易者。
|
|
|
|
#### 策略风险
|
|
|
|
1. 假突破风险:在横盘市场中,价格可能频繁触及Bollinger Bands边界而不形成真正的反转,导致频繁交易和潜在损失。
|
|
2. 趋势市场表现欠佳:在强劲趋势中,策略可能过早平仓或反向开仓,错过大趋势带来的收益。
|
|
3. 参数敏感性:策略表现高度依赖于Bollinger Bands的参数设置(周期和标准差倍数),不同市场可能需要不同的优化设置。
|
|
4. 滑点和交易成本:频繁交易可能导致较高的交易成本,影响整体收益。
|
|
|
|
#### 策略优化方向
|
|
|
|
1. 引入趋势过滤器:结合更长期的趋势指标(如长周期移动平均线),只在主趋势方向进行交易,以减少假信号。
|
|
2. 优化入场时机:考虑在价格回归到Bollinger Bands内部一定比例后再入场,以提高信号质量。
|
|
3. 动态调整参数:根据市场波动性自动调整Bollinger Bands的周期和标准差倍数,以适应不同市场环境。
|
|
4. 增加辅助指标:结合其他技术指标(如RSI或MACD)来确认反转信号,提高交易准确性。
|
|
5. 实现部分利润获取:设置移动止盈,在价格向有利方向移动时锁定部分利润,以应对可能的回撤。
|
|
|
|
#### 总结
|
|
|
|
Bollinger Bands动量反转量化策略是一种结合了技术分析和风险管理的交易系统。通过利用Bollinger Bands来识别市场的超买超卖状态,该策略旨在捕捉潜在的价格反转机会。其优势在于客观性强、风险管理完善和适应性好,但也面临假突破和趋势市场表现欠佳等风险。通过引入趋势过滤、优化入场时机和动态调整参数等方法,可以进一步提升策略的稳定性和盈利能力。总的来说,这是一个值得考虑的中短期交易策略,特别适合那些寻求在市场波动中获利的交易者。
|
|
|
|
||
|
|
|
|
#### Overview
|
|
|
|
The Bollinger Bands Momentum Reversal Quantitative Strategy is a trading system based on technical analysis that primarily uses the Bollinger Bands indicator to identify overbought and oversold market conditions, aiming to capture potential reversal opportunities. This strategy determines entry points by observing price crossovers with the upper and lower Bollinger Bands, while employing dynamic stop-loss to manage risk. This approach combines trend-following and reversal trading concepts, designed to profit from market volatility.
|
|
|
|
#### Strategy Principle
|
|
|
|
The core principle of this strategy is to use Bollinger Bands to identify extreme market conditions and predict possible reversals. Specifically:
|
|
|
|
1. A 34-period Simple Moving Average (SMA) is used as the middle band of the Bollinger Bands.
|
|
2. The upper and lower bands are set at 2 standard deviations above and below the middle band.
|
|
3. When the price crosses below the lower band and then moves back above it, it's considered an oversold reversal signal, triggering a long position.
|
|
4. When the price crosses above the upper band and then moves back below it, it's considered an overbought reversal signal, triggering a short position.
|
|
5. For long positions, the stop-loss is set below the lower band; for short positions, it's set above the upper band.
|
|
|
|
This design allows the strategy to trade when the market shows extreme movements while limiting potential losses through dynamic stop-loss.
|
|
|
|
#### Strategy Advantages
|
|
|
|
1. High objectivity: Uses a clear mathematical model (Bollinger Bands) to define market conditions, reducing bias from subjective judgments.
|
|
2. Robust risk management: Employs a dynamic stop-loss mechanism that automatically adjusts risk exposure based on market volatility.
|
|
3. Good adaptability: Bollinger Bands automatically adjust to market volatility, allowing the strategy to maintain relatively stable performance in different market environments.
|
|
4. Reversal capture capability: Focuses on capturing market reversals after overbought/oversold conditions, potentially yielding good returns in oscillating markets.
|
|
5. Simplicity: The strategy logic is intuitive, easy to understand and implement, suitable for traders of different experience levels.
|
|
|
|
#### Strategy Risks
|
|
|
|
1. False breakout risk: In range-bound markets, prices may frequently touch Bollinger Band boundaries without forming true reversals, leading to frequent trades and potential losses.
|
|
2. Underperformance in trending markets: In strong trends, the strategy may close positions too early or open counter-trend positions, missing out on profits from major trends.
|
|
3. Parameter sensitivity: Strategy performance highly depends on Bollinger Bands parameter settings (period and standard deviation multiplier), which may require different optimizations for different markets.
|
|
4. Slippage and trading costs: Frequent trading may lead to higher transaction costs, impacting overall returns.
|
|
|
|
#### Strategy Optimization Directions
|
|
|
|
1. Introduce trend filters: Incorporate longer-term trend indicators (e.g., long-period moving averages) to trade only in the direction of the main trend, reducing false signals.
|
|
2. Optimize entry timing: Consider entering positions after the price has regressed a certain percentage inside the Bollinger Bands to improve signal quality.
|
|
3. Dynamic parameter adjustment: Automatically adjust the Bollinger Bands period and standard deviation multiplier based on market volatility to adapt to different market environments.
|
|
4. Add auxiliary indicators: Combine other technical indicators (such as RSI or MACD) to confirm reversal signals and improve trading accuracy.
|
|
5. Implement partial profit-taking: Set trailing stop-losses to lock in partial profits as price moves favorably, addressing potential pullbacks.
|
|
|
|
#### Summary
|
|
|
|
The Bollinger Bands Momentum Reversal Quantitative Strategy is a trading system that combines technical analysis with risk management. By utilizing Bollinger Bands to identify overbought and oversold market conditions, this strategy aims to capture potential price reversal opportunities. Its strengths lie in its objectivity, robust risk management, and adaptability, but it also faces risks such as false breakouts and underperformance in trending markets. Through the introduction of trend filters, optimization of entry timing, and dynamic parameter adjustment, the strategy's stability and profitability can be further enhanced. Overall, this is a worthy consideration for medium to short-term trading, particularly suitable for traders seeking to profit from market volatility.
|
|
|
|
[/trans]
|
|
|
|
|
|
|
|
> Source (PineScript)
|
|
|
|
``` pinescript
|
|
/*backtest
|
|
start: 2024-09-18 00:00:00
|
|
end: 2024-09-25 00:00:00
|
|
period: 45m
|
|
basePeriod: 45m
|
|
exchanges: [{"eid":"Futures_Binance","currency":"BTC_USDT"}]
|
|
*/
|
|
|
|
//@version=5
|
|
strategy(shorttitle='MBB_Strategy', title='Bollinger Bands Strategy', overlay=true)
|
|
|
|
// Inputs
|
|
price = input.source(close, title="Source")
|
|
period = input.int(34, minval=1, title="Period") // Renombramos 'length' a 'period'
|
|
multiplier = input.float(2.0, minval=0.001, maxval=50, title="Multiplier") // Renombramos 'mult' a 'multiplier'
|
|
|
|
// Calculando las bandas de Bollinger
|
|
middle_band = ta.sma(price, period) // Renombramos 'basis' a 'middle_band'
|
|
deviation = ta.stdev(price, period) // Renombramos 'dev' a 'deviation'
|
|
deviation2 = multiplier * deviation // Renombramos 'dev2' a 'deviation2'
|
|
|
|
upper_band1 = middle_band + deviation // Renombramos 'upper1' a 'upper_band1'
|
|
lower_band1 = middle_band - deviation // Renombramos 'lower1' a 'lower_band1'
|
|
upper_band2 = middle_band + deviation2 // Renombramos 'upper2' a 'upper_band2'
|
|
lower_band2 = middle_band - deviation2 // Renombramos 'lower2' a 'lower_band2'
|
|
|
|
// Plotting Bollinger Bands
|
|
plot(middle_band, linewidth=2, color=color.blue, title="Middle Band")
|
|
plot(upper_band2, color=color.new(color.blue, 0), title="Upper Band 2")
|
|
plot(lower_band2, color=color.new(color.orange, 0), title="Lower Band 2")
|
|
|
|
// Rellenando áreas entre las bandas
|
|
fill(plot(middle_band), plot(upper_band2), color=color.new(color.blue, 80), title="Upper Fill")
|
|
fill(plot(middle_band), plot(lower_band2), color=color.new(color.orange, 80), title="Lower Fill")
|
|
|
|
// Lógica de la estrategia
|
|
var bool is_long = false
|
|
var bool is_short = false
|
|
|
|
if (ta.crossover(price, lower_band2))
|
|
strategy.entry("Buy", strategy.long)
|
|
is_long := true
|
|
is_short := false
|
|
|
|
if (ta.crossunder(price, upper_band2))
|
|
strategy.entry("Sell", strategy.short)
|
|
is_long := false
|
|
is_short := true
|
|
|
|
// Lógica del stop loss
|
|
stop_loss_level_long = lower_band2
|
|
stop_loss_level_short = upper_band2
|
|
|
|
if (is_long)
|
|
strategy.exit("Exit Long", "Buy", stop=stop_loss_level_long)
|
|
|
|
if (is_short)
|
|
strategy.exit("Exit Short", "Sell", stop=stop_loss_level_short)
|
|
|
|
```
|
|
|
|
> Detail
|
|
|
|
https://www.fmz.com/strategy/468336
|
|
|
|
> Last Modified
|
|
|
|
2024-09-26 16:21:10
|