
19 KiB
Name
BTST高概率突破策略与精选股票筛选系统-BTST-High-Probability-Breakout-Strategy-with-Selective-Stock-Screening-System
Author
ianzeng123
Strategy Description
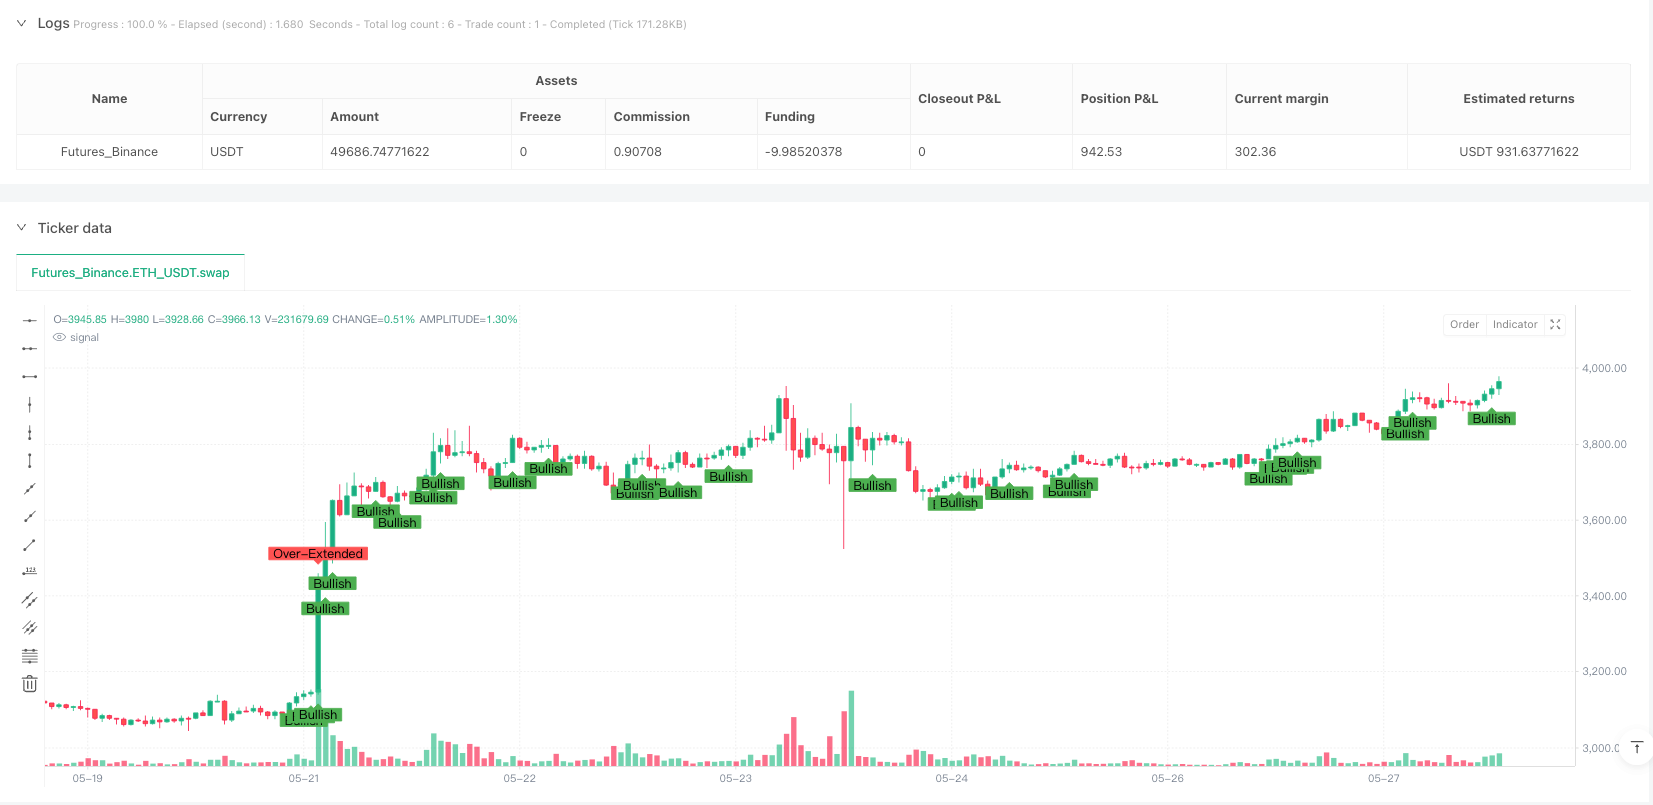
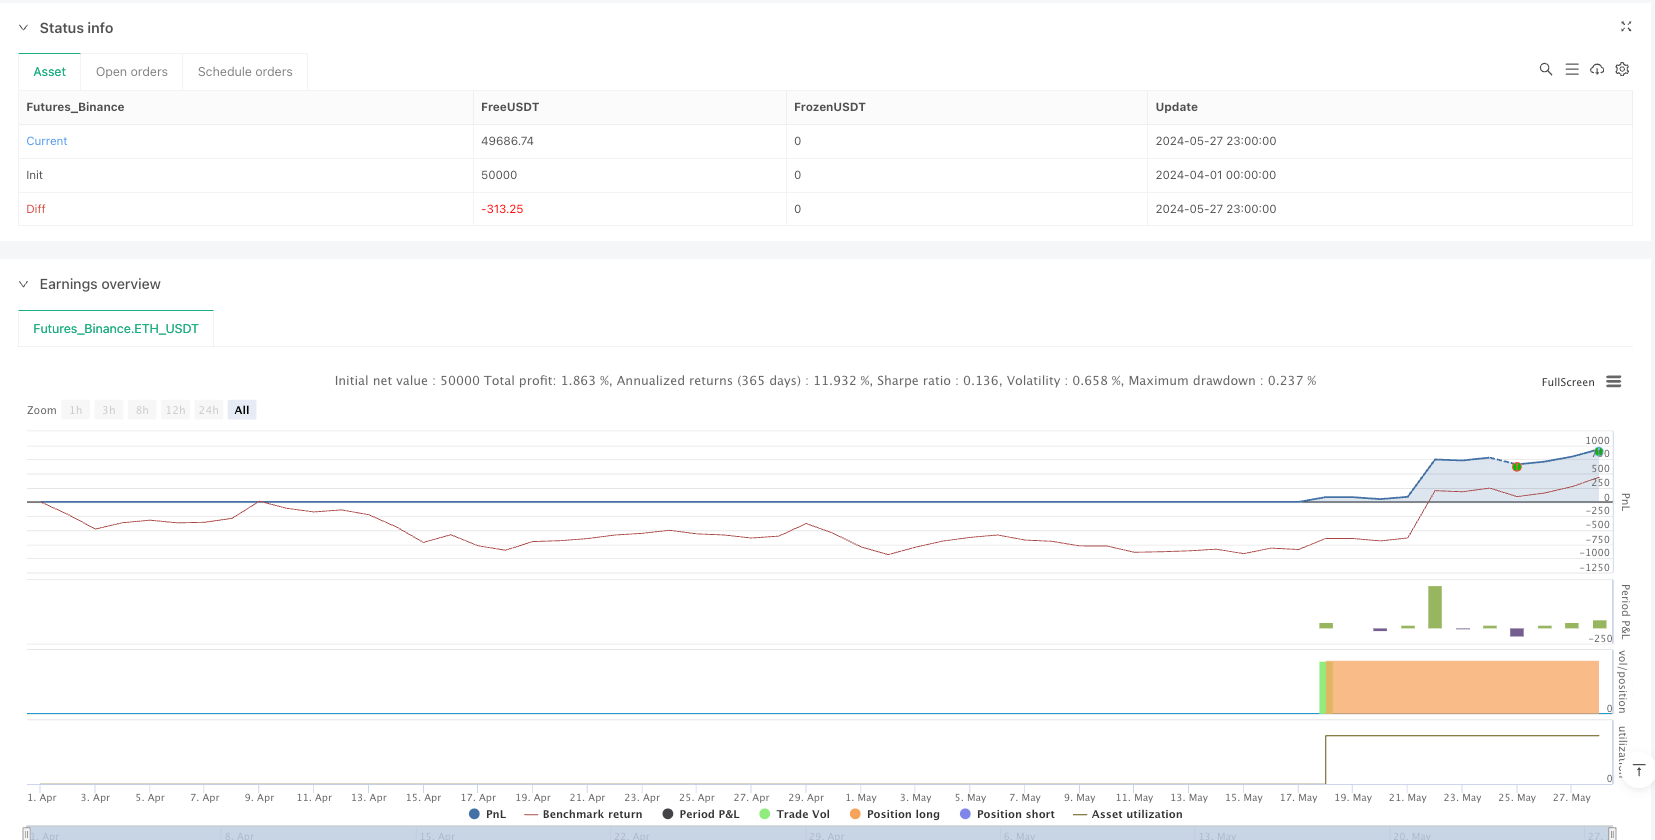
[trans]
概述
BTST高概率突破策略与精选股票筛选系统是一种专为日内和隔夜交易设计的量化策略,旨在识别并捕捉短期价格动量突破机会。该策略结合了时间特定的价格波动筛选、经典技术形态确认和动态阻力位突破判断,构建了一个多层次的交易决策系统。策略核心在于下午3点时精准筛选出已有2-3%涨幅的标的,通过烛台形态分析进一步确认看涨信号,并设置合理的进出场机制,规避过度扩张的风险,以实现短期高概率的交易机会。
策略原理
该策略的运作原理基于多重条件的逐层筛选与确认:
-
初始筛选(下午3点): 策略首先在每日下午3点精确时间点,筛选出当日涨幅在2-3%区间的标的。这一特定时间窗口的选择基于市场动量可能在尾盘继续发展的假设。
-
日线烛台形态分析: 策略融合了三种经典的看涨形态判断:
- 看涨吞没形态(Bullish Engulfing): 当日K线完全吞没前一日K线,且当日收盘价高于开盘价。
- 晨星形态(Morning Star): 由三根K线组成,显示从看跌到看涨的转变过程。
- 三白兵形态(Three White Soldiers): 连续三根阳线且每根阳线的收盘价都高于前一根阳线的收盘价。
-
30分钟阻力位突破: 策略每30分钟动态设置阻力位(当前30分钟的最高点),并判断价格是否突破该阻力位,作为潜在的续涨或获利了结信号。
-
避免过度扩张: 策略通过计算当日内涨幅,避开已上涨超过5%或下跌超过10%的标的,以规避可能的回调风险。
-
次日观察名单: 结合上述条件,将符合初始筛选、看涨形态确认且未过度扩张的标的加入次日观察名单。
-
出场策略: 模拟盘前和开盘观察,如标的出现2%以上跳空高开且价格保持在前日低点之上,则保持持仓至少15分钟,等待潜在的进一步上涨。
-
买卖触发器: 买入信号基于看涨形态、初始筛选条件和非过度扩张的综合判断;卖出信号则依据阻力位突破条件和非过度扩张状态。
策略优势
-
时间精准性: 策略在下午3点这一特定时间点进行筛选,有效捕捉日内动量发展的关键阶段,为次日可能的延续行情提供早期预警。
-
多重确认机制: 通过结合价格百分比变化、技术形态和阻力位突破三重确认,显著提高了信号的可靠性,降低了假信号风险。
-
风险管理集成: 策略内置了避免过度扩张股票的筛选条件,这一设计有效规避了追高风险,提高了交易的安全边际。
-
灵活的退出机制: 策略根据阻力位突破和价格表现设置了灵活的退出条件,有助于在获利或风险显现时及时了结头寸。
-
可视化辅助: 策略在图表上标记各类条件和信号,使交易者能够直观理解市场状态和策略逻辑,便于实时决策调整。
-
警报系统整合: 内置的警报条件设置,让交易者能够及时接收买入和卖出信号提醒,无需持续盯盘,提高了交易效率。
策略风险
-
假突破风险: 30分钟阻力位突破可能出现假突破现象,尤其在市场波动较大时,可能导致不必要的交易信号。解决方法是增加成交量确认或设置更高的突破阈值。
-
形态识别局限性: 烛台形态识别基于固定规则,在复杂市场环境下可能无法捕捉所有有效形态。建议结合其他技术指标如RSI或MACD进行交叉验证。
-
时间依赖性: 策略严重依赖下午3点的筛选条件,若错过该时间点或数据延迟,可能导致错失交易机会。可以考虑扩展筛选时间窗口或设置备选时间点。
-
过度筛选风险: 多重条件的叠加可能导致符合条件的交易机会过少,影响策略的实用性。可以适当放宽某些筛选条件,或根据市场状态动态调整参数。
-
市场状态适应性: 该策略在特定市场状态(如温和上涨趋势)中表现较好,但在横盘或剧烈波动市场中可能效果欠佳。建议根据整体市场环境选择性启用策略。
策略优化方向
-
动态参数调整: 当前策略使用固定的百分比阈值(2-3%涨幅筛选,5-10%过度扩张判断),可以考虑根据市场波动率动态调整这些参数,提高策略在不同市场环境下的适应性。
-
加入成交量确认: 策略目前主要基于价格行为,可以添加成交量分析维度,例如要求突破发生在放量情况下,或设置成交量较前期平均水平增加特定百分比的条件,提高信号质量。
-
时间框架扩展: 考虑在不同时间框架(如15分钟、60分钟)上进行形态和突破确认,构建多时间框架确认系统,减少假信号并增强信号可靠性。
-
趋势过滤器整合: 引入中期趋势判断指标,如移动平均线系统或ADX指标,确保短期交易方向与中期趋势一致,避免逆势操作提高成功率。
-
机器学习优化: 利用机器学习算法对历史数据中的成功案例进行模式识别和参数优化,提取更精细的交易规则和动态阈值调整机制。
-
回撤控制机制: 增加基于固定百分比或ATR倍数的止损设置,并考虑实现部分获利机制,如分批平仓或移动止损,以更好地控制风险和锁定利润。
总结
BTST高概率突破策略与精选股票筛选系统通过结合时间特定筛选、技术形态分析和动态阻力位突破判断,构建了一个系统化的短期交易决策框架。该策略特别适合寻找日内积累了一定动量且具备技术确认的标的,以捕捉次日可能出现的延续性行情。虽然策略在设计上考虑了多重确认和风险控制,但仍需根据实际市场状态进行灵活调整和持续优化。通过实施建议的优化方向,尤其是动态参数调整、成交量确认和多时间框架分析,策略的稳健性和适应性有望得到进一步提升,为交易者提供更加可靠的决策支持工具。 ||
Overview
The BTST High-Probability Breakout Strategy with Selective Stock Screening System is a quantitative approach designed for intraday and overnight trading, aimed at identifying and capturing short-term price momentum breakthrough opportunities. This strategy combines time-specific price movement screening, classic technical pattern confirmation, and dynamic resistance breakout analysis to construct a multi-layered trading decision system. The core of the strategy lies in precisely filtering targets with a 2-3% gain at 3 PM, further confirming bullish signals through candlestick pattern analysis, and setting reasonable entry and exit mechanisms to avoid overextension risks, thereby achieving high-probability short-term trading opportunities.
Strategy Principles
The operational principles of this strategy are based on multi-condition progressive filtering and confirmation:
-
Initial Screening (3 PM): The strategy first screens for instruments with a daily gain of 2-3% at precisely 3 PM. This specific time window selection is based on the assumption that market momentum may continue to develop into the close.
-
Daily Candlestick Pattern Analysis: The strategy incorporates three classic bullish pattern assessments:
- Bullish Engulfing Pattern: When the current day's candlestick completely engulfs the previous day's candlestick, and the current day's closing price is higher than its opening price.
- Morning Star Pattern: Composed of three candlesticks, showing a transition from bearish to bullish sentiment.
- Three White Soldiers Pattern: Three consecutive positive candlesticks with each closing price higher than the previous candlestick's closing price.
-
30-Minute Resistance Breakout: The strategy dynamically sets resistance levels every 30 minutes (the highest point of the current 30-minute period) and determines whether the price breaks through this resistance level, serving as a potential signal for continued upward movement or profit-taking.
-
Avoiding Overextension: The strategy calculates intraday gains to avoid instruments that have already risen more than 5% or fallen more than 10%, mitigating potential pullback risks.
-
Next-Day Watchlist: Combining the above conditions, instruments that meet the initial screening, bullish pattern confirmation, and are not overextended are added to the next-day watchlist.
-
Exit Strategy: Simulating pre-market and opening observations, if an instrument gaps up by more than 2% and the price remains above the previous day's low, positions are maintained for at least 15 minutes, awaiting potential further upside.
-
Buy and Sell Triggers: Buy signals are based on a combination of bullish patterns, initial screening conditions, and non-overextension assessment; sell signals rely on resistance level breakout conditions and non-overextension status.
Strategy Advantages
-
Temporal Precision: The strategy screens at the specific time point of 3 PM, effectively capturing a critical stage of intraday momentum development, providing early warning for potential continuation moves the next day.
-
Multiple Confirmation Mechanism: By combining percentage price changes, technical patterns, and resistance breakouts as triple confirmation, the strategy significantly enhances signal reliability and reduces false signal risks.
-
Integrated Risk Management: The strategy incorporates filtering conditions to avoid overextended stocks, effectively mitigating chase-the-high risks and improving the safety margin of trades.
-
Flexible Exit Mechanism: The strategy sets flexible exit conditions based on resistance breakouts and price performance, facilitating timely position closure when profits are realized or risks materialize.
-
Visual Assistance: The strategy marks various conditions and signals on charts, allowing traders to intuitively understand market status and strategy logic, facilitating real-time decision adjustments.
-
Alert System Integration: Built-in alert condition settings enable traders to receive timely buy and sell signal notifications without constant screen monitoring, improving trading efficiency.
Strategy Risks
-
False Breakout Risk: The 30-minute resistance breakout may exhibit false breakout phenomena, especially during high market volatility, potentially leading to unnecessary trading signals. The solution is to add volume confirmation or set higher breakout thresholds.
-
Pattern Recognition Limitations: Candlestick pattern recognition based on fixed rules may not capture all effective formations in complex market environments. Consider cross-validation with other technical indicators such as RSI or MACD.
-
Time Dependency: The strategy heavily relies on the 3 PM screening condition; missing this time point or experiencing data delays may lead to missed trading opportunities. Consider expanding the screening time window or setting alternative time points.
-
Over-Filtering Risk: The layering of multiple conditions may result in too few qualifying trading opportunities, affecting the strategy's practicality. Consider appropriately relaxing certain screening conditions or dynamically adjusting parameters based on market conditions.
-
Market State Adaptability: This strategy performs better in specific market conditions (such as moderate uptrends) but may underperform in range-bound or highly volatile markets. Recommend selectively employing the strategy based on the overall market environment.
Strategy Optimization Directions
-
Dynamic Parameter Adjustment: The current strategy uses fixed percentage thresholds (2-3% gain screening, 5-10% overextension judgment). Consider dynamically adjusting these parameters based on market volatility to improve the strategy's adaptability across different market environments.
-
Volume Confirmation Addition: The strategy currently relies primarily on price action. Consider adding volume analysis dimensions, such as requiring breakouts to occur on increased volume, or setting conditions where volume increases by a specific percentage compared to previous average levels, improving signal quality.
-
Timeframe Expansion: Consider performing pattern and breakout confirmations across different timeframes (such as 15-minute, 60-minute), constructing a multi-timeframe confirmation system to reduce false signals and enhance signal reliability.
-
Trend Filter Integration: Introduce medium-term trend assessment indicators, such as moving average systems or the ADX indicator, to ensure short-term trading direction aligns with medium-term trends, avoiding counter-trend operations and improving success rates.
-
Machine Learning Optimization: Utilize machine learning algorithms to recognize patterns and optimize parameters from successful historical cases, extracting more refined trading rules and dynamic threshold adjustment mechanisms.
-
Drawdown Control Mechanism: Add stop-loss settings based on fixed percentages or ATR multiples, and consider implementing partial profit-taking mechanisms, such as scaled exits or trailing stops, to better control risk and lock in profits.
Conclusion
The BTST High-Probability Breakout Strategy with Selective Stock Screening System constructs a systematic short-term trading decision framework by combining time-specific screening, technical pattern analysis, and dynamic resistance breakout assessment. This strategy is particularly suitable for finding instruments that have accumulated certain momentum during the day and have technical confirmations, capturing potential continuation moves the next day. Although the strategy considers multiple confirmations and risk controls in its design, it still requires flexible adjustments and continuous optimization based on actual market conditions. By implementing the suggested optimization directions, especially dynamic parameter adjustments, volume confirmation, and multi-timeframe analysis, the strategy's robustness and adaptability can be further enhanced, providing traders with a more reliable decision support tool.[/trans]
Source (PineScript)
/*backtest
start: 2024-04-01 00:00:00
end: 2024-05-28 00:00:00
period: 1h
basePeriod: 1h
exchanges: [{"eid":"Futures_Binance","currency":"ETH_USDT"}]
*/

//@version=5
strategy("BTST Strategy", overlay=true)

// --- 1. Initial Screening at 3 PM (Identify 2-3% gain) ---
is3pm = (hour == 15 and minute == 0)  // Check if it's 3 PM
priceChangePercentage = (close - close[1]) / close[1] * 100  // Calculate percentage change from previous close

// Stocks with a gain of 2-3% by 3 PM
isSelectedStock = is3pm and priceChangePercentage >= 2 and priceChangePercentage <= 3
plotshape(series=isSelectedStock, title="Selected Stock", location=location.belowbar, color=color.green, style=shape.labelup, text="Selected")

// --- 2. Daily Candle Analysis (Bullish Patterns) ---
// Bullish Engulfing pattern
bullishEngulfing = close > open and open[1] > close[1] and close > open[1] and open < close[1]

// Morning Star pattern
morningStar = close[2] < open[2] and close[1] < open[1] and close > open and close[1] > open[1]

// Three White Soldiers pattern
threeWhiteSoldiers = close > open and close[1] > open[1] and close[2] > open[2] and close > close[1] and close[1] > close[2]

// Combine the patterns for bullish confirmation
bullishPattern = bullishEngulfing or morningStar or threeWhiteSoldiers
plotshape(series=bullishPattern, title="Bullish Pattern", location=location.belowbar, color=color.green, style=shape.labelup, text="Bullish")

// --- 3. 30-Minute Candle Breakout ---
var float resistanceLevel = na

// Capture the highest point every 30 minutes
if (minute == 30 or minute == 0)
    resistanceLevel := high

// Check for breakout above resistance level
breakoutAboveResistance = close > resistanceLevel
plotshape(series=breakoutAboveResistance, title="Breakout Above Resistance", location=location.abovebar, color=color.blue, style=shape.labelup, text="Breakout")

// --- 4. Avoid Over-Extended Stocks (5-10% intraday gains) ---
// Calculate the percentage gain from the open price
percentageGain = (close - open) / open * 100

// Avoid stocks that are up more than 5-10% intraday
avoidOverExtendedStocks = percentageGain > 5 or percentageGain < -10
plotshape(series=avoidOverExtendedStocks, title="Avoid Over-Extended Stocks", location=location.abovebar, color=color.red, style=shape.labeldown, text="Over-Extended")

// --- 5. Second-Day Watchlist (Add shortlisted stocks to watchlist) ---
// We will skip implementing a watchlist in Pine Script because it isn't supported for direct interaction with external systems, but we will mark it in the script visually.
watchlistCondition = isSelectedStock and bullishPattern and not avoidOverExtendedStocks
plotshape(series=watchlistCondition, title="Second Day Watchlist", location=location.belowbar, color=color.purple, style=shape.triangledown, text="Watchlist")

// --- 6. Exit Strategy - Pre-Market & Opening Observation ---
// This part requires real-time data and pre-market data, which isn't supported directly in Pine Script
// But, we can simulate exit strategy by showing potential exit points based on the gap-up opening:
gapUpOpening = open > close[1] * 1.02  // If the stock opens 2% above the previous close
hold15Min = gapUpOpening and close > low[1]  // Hold if price doesn't break the previous low

plotshape(series=hold15Min, title="Gap-Up Hold for 15 Minutes", location=location.abovebar, color=color.blue, style=shape.triangledown, text="Hold")

// --- 7. Buy and Sell Triggers (Strategy) ---

// Define conditions for the buy trigger
buySignal = bullishPattern and isSelectedStock and not avoidOverExtendedStocks

// Buy when the conditions are met
if buySignal
    strategy.entry("Buy", strategy.long)

// Define conditions for the sell trigger
sellSignal = breakoutAboveResistance and not avoidOverExtendedStocks

// Sell when the breakout above resistance condition is met
if sellSignal
    strategy.close("Buy")

// --- Alerts ---
// Alerts for Buy Signal based on 0.5% price movement
alertcondition(buySignal, title="Buy Signal", message="Buy Signal: Confirmed Bullish Pattern and 2-3% price increase by 3 PM!")

// Alerts for Sell Signal based on Breakout and other conditions
alertcondition(sellSignal, title="Sell Signal", message="Sell Signal: Breakout above resistance!")
Detail
https://www.fmz.com/strategy/489133
Last Modified
2025-04-02 09:33:50