
187 lines
7.2 KiB
Markdown
187 lines
7.2 KiB
Markdown
|
|
> Name
|
|
|
|
相对强度指数平盘反转策略Relative-Strength-Index-Flat-Reversal-Strategy
|
|
|
|
> Author
|
|
|
|
ChaoZhang
|
|
|
|
> Strategy Description
|
|
|
|
|
|
|
|
[trans]
|
|
|
|
## 概述
|
|
|
|
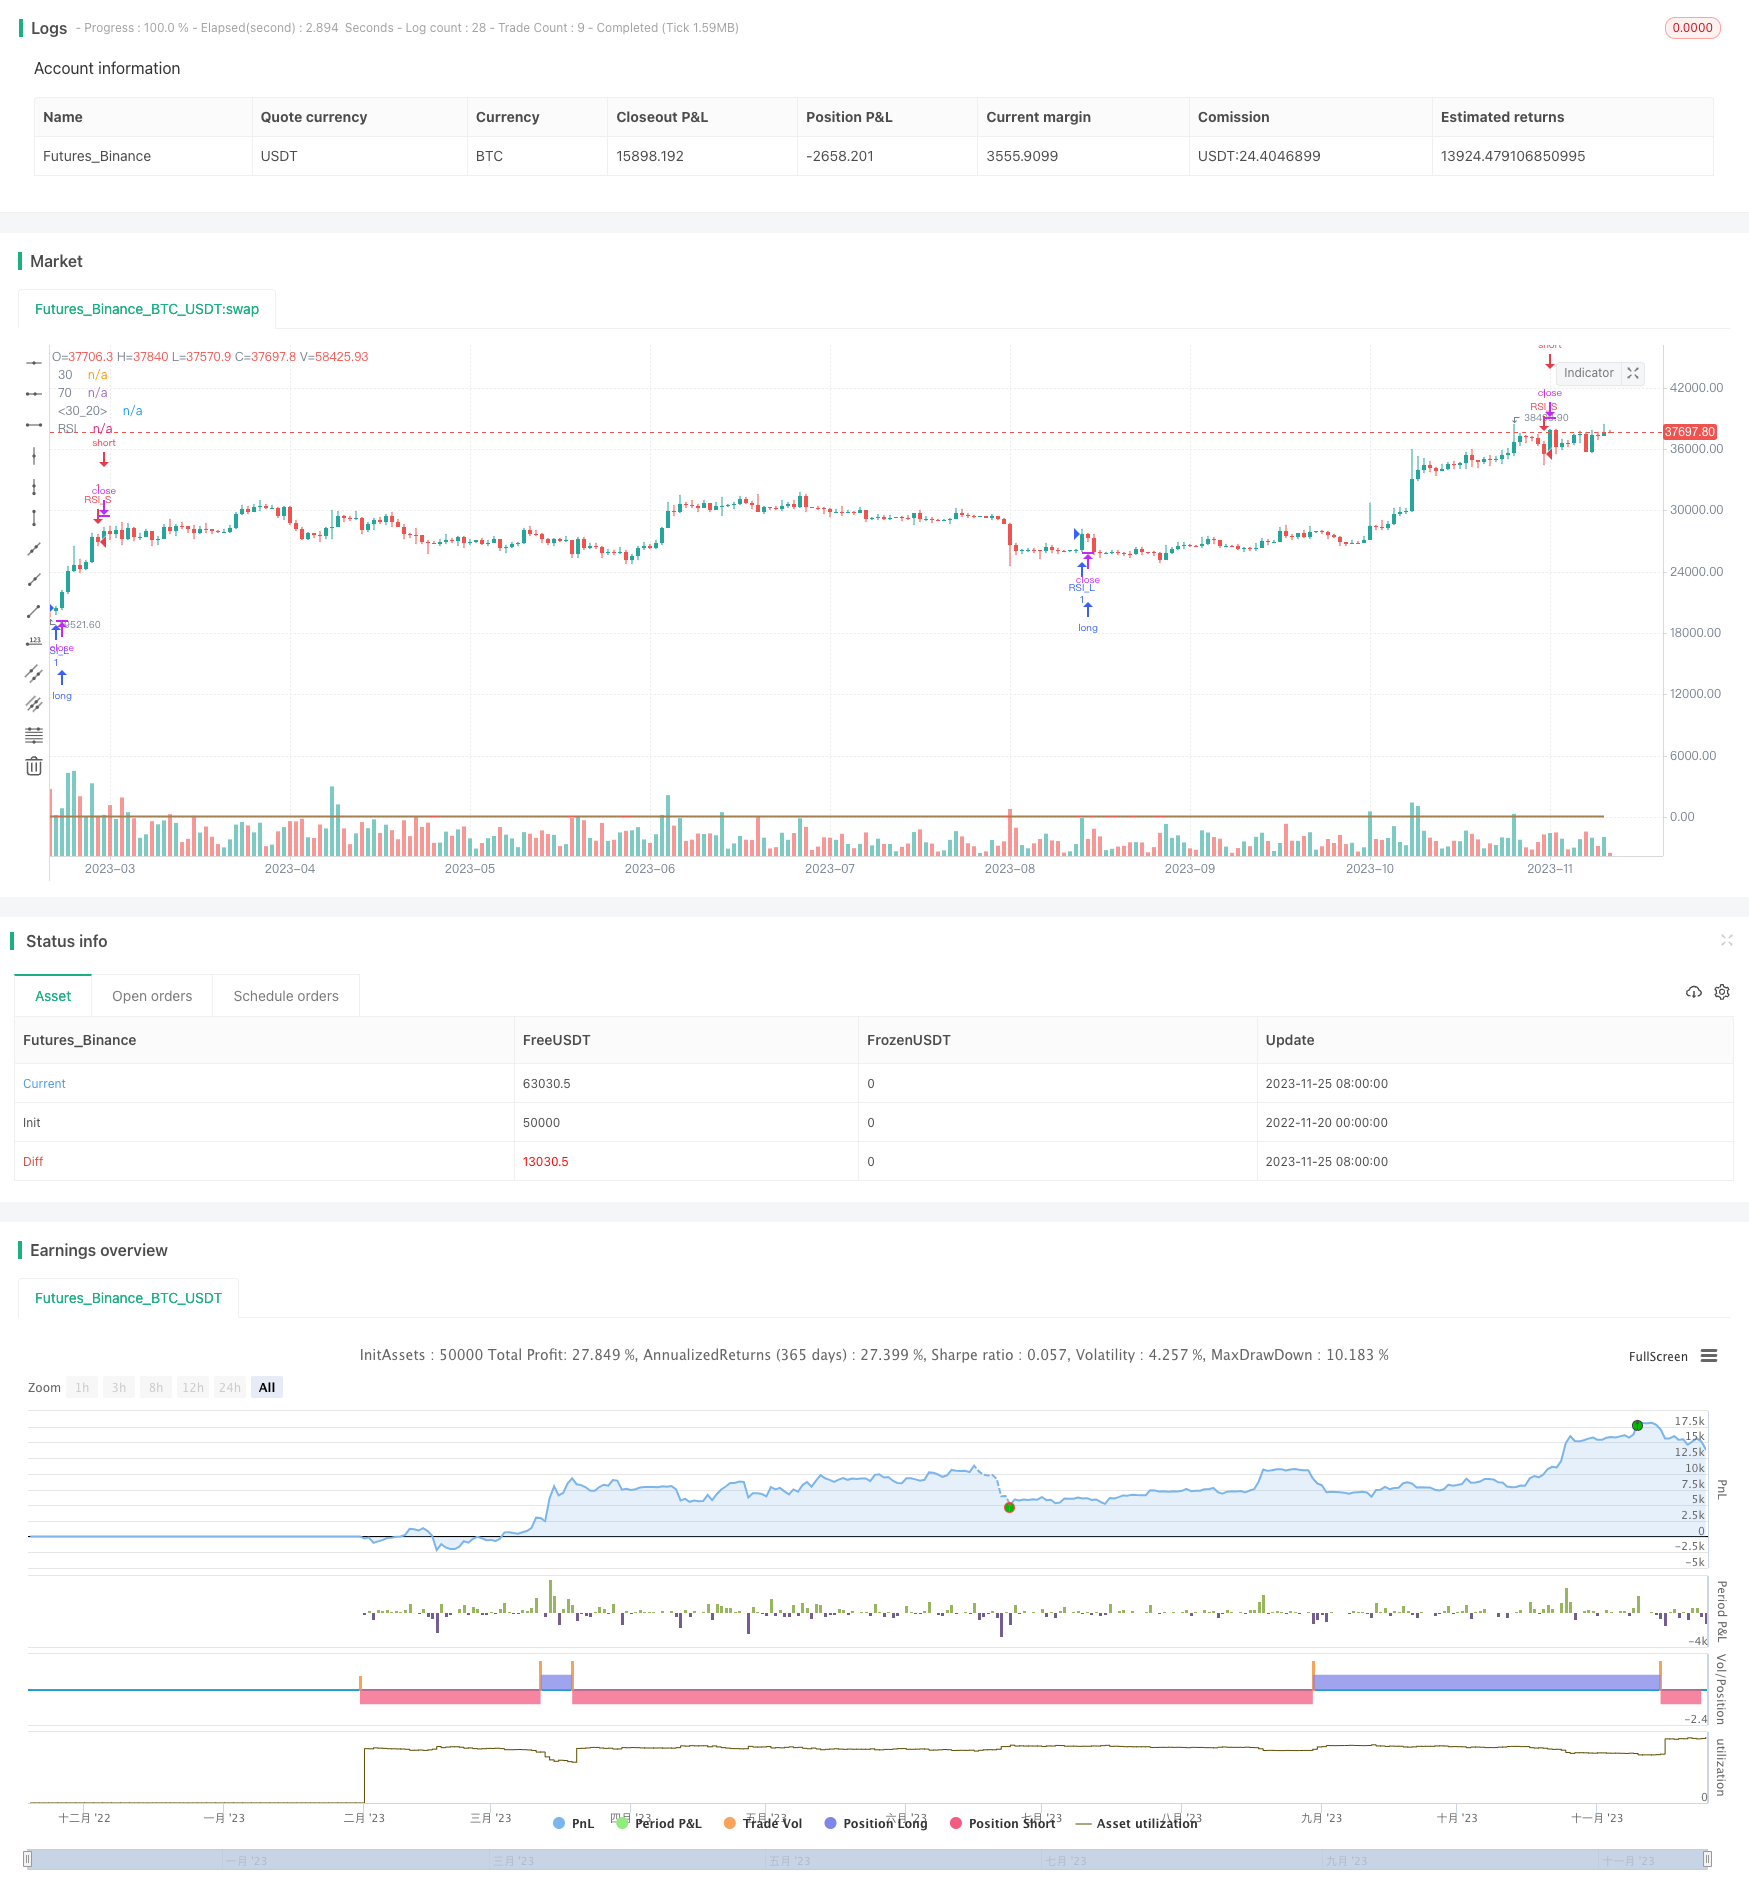
相对强度指数平盘反转策略(Relative Strength Index Flat Reversal Strategy)是一个利用RSI指标识别超买超卖信号的量化投资策略。该策略基于RSI指标的过卖区和过买区进行长短反转操作,在RSI进入超卖区时开仓做多做空,在RSI退出超卖区时平仓。
|
|
|
|
## 策略原理
|
|
|
|
该策略使用长度为14的RSI指标。RSI过卖区定义为高于70,过卖区定义为低于30。当RSI从30以下上穿30时多头开仓,当RSI从70以上下穿70时空头开仓。开仓后一直持仓至RSI退出超卖区。
|
|
|
|
具体来说,策略逻辑如下:
|
|
|
|
1. 定义RSI指标长度为14周期
|
|
2. 定义RSI过卖线为30,过买线为70
|
|
3. 当RSI上穿30时做多入场
|
|
4. 当RSI下穿70时做空入场
|
|
5. 当RSI退出30-70区间时平仓
|
|
|
|
这样,通过RSI指标的反转特性捕捉超卖区反转机会。
|
|
|
|
## 策略优势分析
|
|
|
|
相对强度指数平盘反转策略具有以下优势:
|
|
|
|
1. 操作逻辑简单清晰,容易理解实现
|
|
2. 效率高, 不需要预测, 仅靠指标信号操作
|
|
3. 避免追高杀跌, 有效控制亏损风险
|
|
4. 回撤较小,符合多数人的风险承受能力
|
|
|
|
## 策略风险分析
|
|
|
|
相对强度指数平盘反转策略也存在以下风险:
|
|
|
|
1. 虽然有止损机制,但无法避免巨大单边行情造成的亏损
|
|
2. RSI指标存在失效的可能,无法很好反映超买超卖
|
|
3. 无法有效过滤曲折震荡趋势,难以获利
|
|
4. 超短线操作频繁,交易成本较高
|
|
|
|
要防范这些风险,可以优化策略,设置Adaptive RSI参数动态优化RSI指标参数,或增加趋势过滤器等。
|
|
|
|
## 策略优化方向
|
|
|
|
相对强度指数平盘反转策略可从以下方向进行优化:
|
|
|
|
1. 增加自适应RSI功能,让RSI参数动态调整,减少失效风险
|
|
2. 增加趋势判断指标,避免反转失败风险
|
|
3. 结合波动率指标,确定合理止损位置
|
|
4. 优化开仓条件,避免无效信号
|
|
|
|
## 总结
|
|
|
|
相对强度指数平盘反转策略整体而言是一种简单实用的短线策略。它利用RSI指标的反转交易特性,在RSI进入超卖区时做反向操作。该策略具有操作清晰、风险可控的优点,非常适合初学者学习。但也存在一定盈利局限性和参数失效风险。通过引入自适应机制、趋势过滤等优化手段,可以进一步增强策略优势,减少风险,从而获得更加可靠稳定的投资回报。
|
|
|
|
||
|
|
|
|
## Overview
|
|
|
|
The Relative Strength Index Flat Reversal Strategy is a quantitative investment strategy that uses the RSI indicator to identify overbought and oversold signals. This strategy makes long and short reversals based on the oversold and overbought zones of the RSI indicator by opening positions when the RSI enters the extreme zone and closing positions when the RSI exits the extreme zone.
|
|
|
|
## Strategy Principle
|
|
|
|
This strategy uses a 14-period RSI indicator. The overbought zone is defined as above 70 and the oversold zone is defined as below 30. It goes long when the RSI crosses above 30 from below and goes short when the RSI crosses below 70 from above. After opening the position, it keeps holding until the RSI exits the extreme zone.
|
|
|
|
Specifically, the strategy logic is as follows:
|
|
|
|
1. Define RSI indicator length as 14 periods
|
|
2. Define RSI oversold line at 30, overbought line at 70
|
|
3. When RSI crosses above 30, go long
|
|
4. When RSI crosses below 70, go short
|
|
5. When RSI exits 30-70 range, close position
|
|
|
|
In this way, it captures reversal opportunities from RSI extreme zones using the reversal characteristics of RSI indicator.
|
|
|
|
## Strategy Advantage Analysis
|
|
|
|
The Relative Strength Index Flat Reversal Strategy has the following advantages:
|
|
|
|
1. The operation logic is simple and clear, easy to understand and implement
|
|
2. High efficiency, no prediction needed, just follow indicator signals to operate
|
|
3. Avoid chasing highs and killing lows, effectively control downside risk
|
|
4. Relatively small drawdowns, meets risk tolerance level of most people
|
|
|
|
## Strategy Risk Analysis
|
|
|
|
The Relative Strength Index Flat Reversal Strategy also has the following risks:
|
|
|
|
1. Although there is a stop loss mechanism, it cannot avoid huge losses in a strong one-way trend
|
|
2. There is a chance of RSI failure, cannot effectively reflect overbought and oversold conditions
|
|
3. Cannot effectively filter out choppy sideways trends, hard to profit
|
|
4. High trading frequency for ultra short-term operations, so trading costs are high
|
|
|
|
To hedge these risks, the strategy can be optimized by setting adaptive RSI to dynamically optimize RSI parameters, or adding trend filter etc.
|
|
|
|
## Strategy Optimization
|
|
|
|
The Relative Strength Index Flat Reversal Strategy can be optimized in the following aspects:
|
|
|
|
1. Add adaptive RSI feature to dynamically adjust RSI parameters, reducing failure risk
|
|
2. Add trend indicator to avoid failed reversal risk
|
|
3. Combine with volatility indicator to determine reasonable stop loss level
|
|
4. Optimize entry conditions to avoid ineffective signals
|
|
|
|
## Conclusion
|
|
|
|
In general, the Relative Strength Index Flat Reversal Strategy is a simple and practical short-term strategy. It utilizes the reversal trading characteristics of RSI indicator by taking opposite positions when RSI enters extreme zones. This strategy has the advantages of clear operation logic and controllable risk, making it very suitable for beginners to learn. But it also has some profit limitation and RSI failure risks. By introducing mechanisms like adaptive optimization, trend filter etc, the strategy can be further enhanced on its advantages and risk hedging capability, thereby leading to more reliable and stable investment returns.
|
|
|
|
[/trans]
|
|
|
|
> Strategy Arguments
|
|
|
|
|
|
|
|
|Argument|Default|Description|
|
|
|----|----|----|
|
|
|v_input_1|14|RSI Period Length|
|
|
|
|
|
|
> Source (PineScript)
|
|
|
|
``` pinescript
|
|
/*backtest
|
|
start: 2022-11-20 00:00:00
|
|
end: 2023-11-26 00:00:00
|
|
period: 1d
|
|
basePeriod: 1h
|
|
exchanges: [{"eid":"Futures_Binance","currency":"BTC_USDT"}]
|
|
*/
|
|
|
|
//@version=2
|
|
strategy("RSI OverTrend Strategy (by Marcoweb) v1.0", shorttitle="RSI_L_30_Strat_v1.0", overlay=true)
|
|
|
|
///////////// RSI
|
|
RSIlength = input(14, minval=1, title="RSI Period Length")
|
|
RSIoverSold = 30
|
|
RSIoverBought = 70
|
|
RSITriggerLine = 30
|
|
|
|
RSI = rsi(close, RSIlength)
|
|
price = close
|
|
vrsi = rsi(price, RSIlength)
|
|
|
|
source = close
|
|
buyEntry = crossover(source, RSITriggerLine)
|
|
sellEntry = crossunder(source, RSITriggerLine)
|
|
plot(RSI, color=red,title="RSI")
|
|
p1 = plot(RSIoverSold, color=green,title="30")
|
|
p2 = plot(RSIoverBought, color=green,title="70")
|
|
p3 = plot(RSITriggerLine, color=green,title="30")
|
|
|
|
|
|
///////////// RSI Level 30 v1.0 Strategy
|
|
if (not na(vrsi))
|
|
|
|
if (crossover(RSI, RSITriggerLine))
|
|
strategy.entry("RSI_L", strategy.long, comment="RSI_L")
|
|
else
|
|
strategy.cancel(id="RSI_L")
|
|
|
|
if (crossunder(RSI, RSIoverBought))
|
|
strategy.entry("RSI_S", strategy.short, comment="RSI_S")
|
|
else
|
|
strategy.cancel(id="RSI_S")
|
|
|
|
//plot(strategy.equity, title="equity", color=red, linewidth=2, style=areabr)
|
|
```
|
|
|
|
> Detail
|
|
|
|
https://www.fmz.com/strategy/433398
|
|
|
|
> Last Modified
|
|
|
|
2023-11-27 11:25:17
|