
7.4 KiB
Name
标准分数价格突破策略Z-Score-Price-Breakout-Strategy
Author
ChaoZhang
Strategy Description
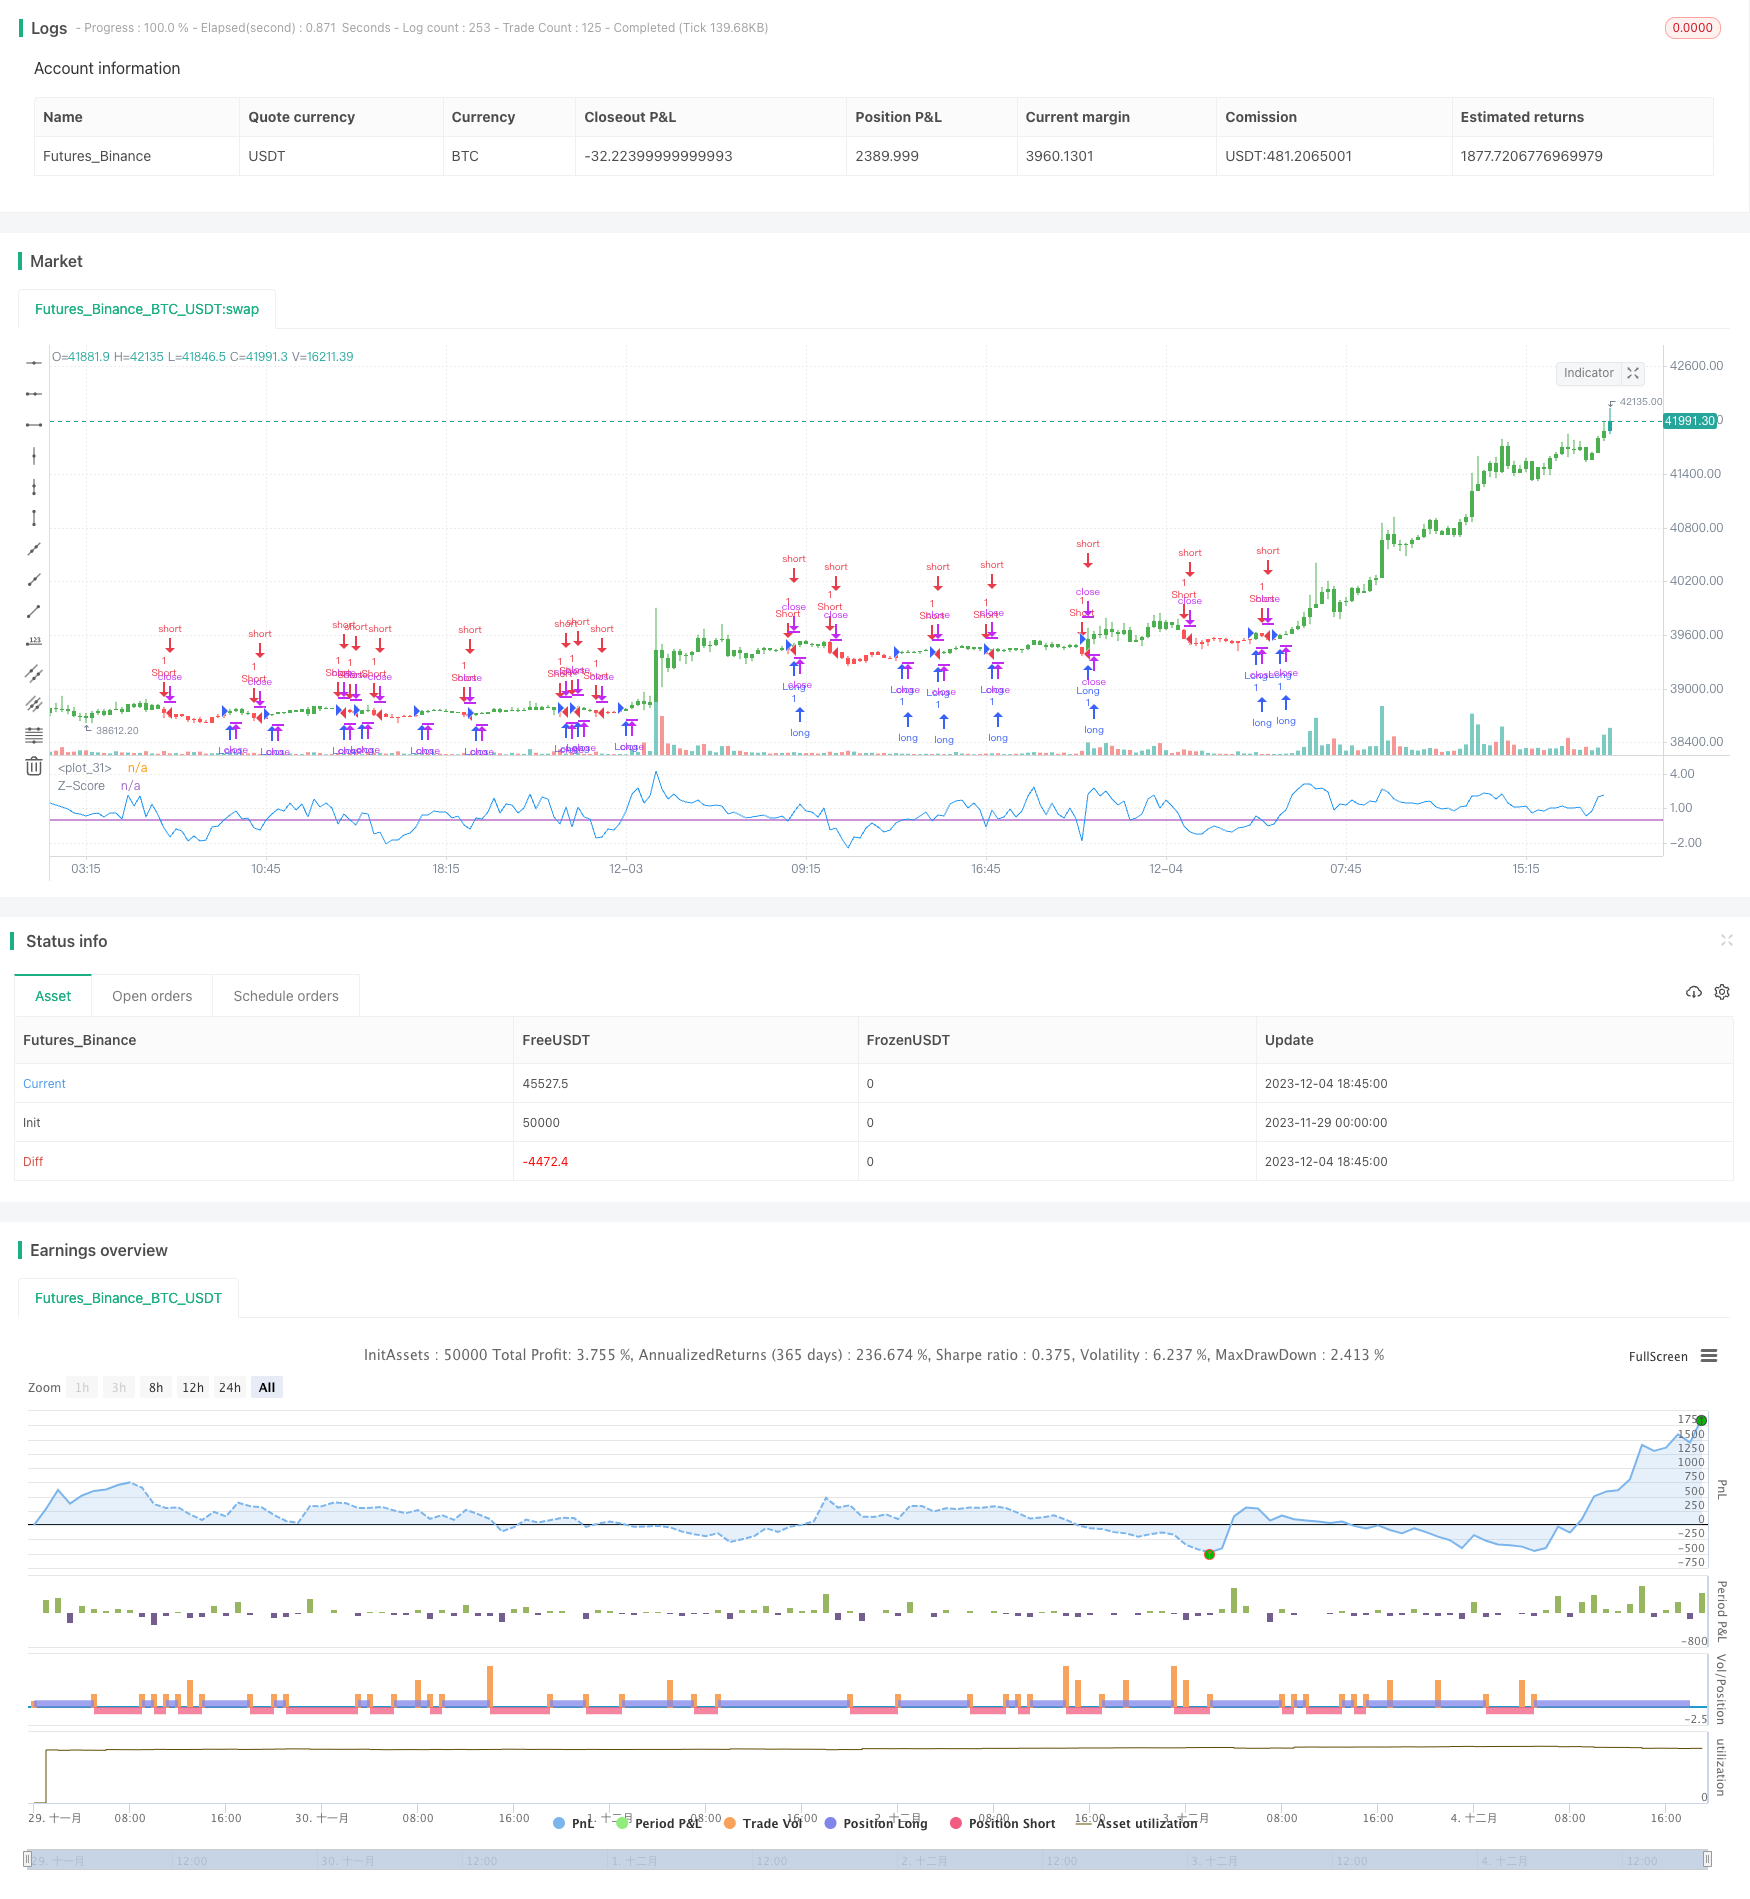
[trans]
概述
标准分数价格突破策略(Z-Score Price Breakout Strategy)利用价格的标准分数指标判断当前价格是否处于异常状态,从而产生交易信号。当价格的标准分数高于或低于某一阈值时,表明价格已经进入异常状态,这时可以进行做多或做空操作。
策略原理
该策略的核心指标是价格的标准分数(Z-Score),计算公式如下:
Z_score = (C - SMA(n)) / StdDev(C,n)
其中C为收盘价,SMA(n)为n周期的简单移动均线,StdDev(C,n)为n周期收盘价的标准差。
标准分数反映了当前价格与平均价格的偏离程度。当价格标准分数大于某一正阈值(如+2)时,表示当前价格已经高于平均价2个标准差,属于比较高的水平;当小于某一负阈值(如-2)时,表示当前价格已经低于平均价2个标准差,属于比较低的水平。
该策略首先计算价格的标准分数,然后设定一个正负阈值(如0和0),当标准分数高于正阈值时产生买入信号,低于负阈值时产生卖出信号。
优势分析
- 利用价格标准分数判断价格异常,是一种常见而有效的量化方法
- 可以轻松实现做多和做空双向交易
- 参数设置灵活,可调整周期、阈值等
- 可与其他指标组合,形成交易系统
风险分析
- 标准分数策略较为粗放,容易产生假信号
- 需要设定合适的参数,如周期和阈值
- 需考虑止损策略控制风险
优化方向
- 优化周期参数,寻找最佳周期
- 优化正负阈值,降低假信号
- 增加过滤条件,与其他指标组合
- 增加止损策略
总结
标准分数价格突破策略判断当前价格是否处于异常状态,根据价格标准分数的正负进行交易。该策略简单易行,可双向交易,但也存在一定风险。通过参数优化和止损等手段,可以强化该策略,与其他指标组合形成完整的量化交易体系。
||
Overview
The Z-Score price breakout strategy uses the z-score indicator of price to determine whether the current price is in an abnormal state, so as to generate trading signals. When the z-score of price is higher or lower than a threshold, it means the price has entered an abnormal state, at which point long or short positions can be taken.
Strategy Principle
The core indicator of this strategy is the z-score of price, calculated as follows:
Z_score = (C - SMA(n)) / StdDev(C,n)
Where C is the closing price, SMA(n) is the simple moving average of n periods, and StdDev(C,n) is the standard deviation of closing price for n periods.
The z-score reflects the degree of deviation of the current price from the average price. When the price z-score is greater than a certain positive threshold (e.g. +2), it means the current price is above the average price by 2 standard deviations, which is a relatively high level. When it is less than a certain negative threshold (e.g. -2), it means the current price is below the average price by 2 standard deviations, which is a relatively low level.
This strategy first calculates the z-score of price, then sets a positive and negative threshold (e.g. 0 and 0). When the z-score is higher than the positive threshold, it generates a buy signal. When lower than the negative threshold, it generates a sell signal.
Advantage Analysis
- Using price z-score to judge price anomalies is a common and effective quantitative method
- Easily achieve both long and short trading
- Flexible parameter settings, adjustable cycle, threshold, etc.
- Can be combined with other indicators to form a trading system
Risk Analysis
- The z-score strategy is crude and prone to false signals
- Need to set appropriate parameters like cycle and threshold
- Need to consider stop loss strategies to control risk
Optimization Directions
- Optimize cycle parameters to find the best cycle
- Optimize positive and negative thresholds to reduce false signals
- Add filter conditions, combine with other indicators
- Add stop loss strategies
Summary
The z-score price breakout strategy judges whether the current price is in an abnormal state, and trades according to the positive and negative of the price z-score. This strategy is simple and easy to implement, allows two-way trading, but also has some risks. By optimizing parameters, adding stop loss and combining with other indicators, this strategy can be enhanced to form a complete quantitative trading system.
[/trans]
Strategy Arguments
| Argument | Default | Description |
|---|---|---|
| v_input_1 | 20 | Period |
| v_input_2 | false | Trigger |
| v_input_3 | false | Trade reverse |
Source (PineScript)
/*backtest
start: 2023-11-29 00:00:00
end: 2023-12-04 19:00:00
period: 15m
basePeriod: 5m
exchanges: [{"eid":"Futures_Binance","currency":"BTC_USDT"}]
*/

//@version=2
////////////////////////////////////////////////////////////
//  Copyright by HPotter v1.0 18/01/2017
// The author of this indicator is Veronique Valcu. The z-score (z) for a data
// item x measures the distance (in standard deviations StdDev) and direction
// of the item from its mean (U):
//     z = (x-StdDev) / U
// A value of zero indicates that the data item x is equal to the mean U, while
// positive or negative values show that the data item is above (x>U) or below
// (x Values of +2 and -2 show that the data item is two standard deviations
// above or below the chosen mean, respectively, and over 95.5% of all data
// items are contained within these two horizontal references (see Figure 1).
// We substitute x with the closing price C, the mean U with simple moving
// average (SMA) of n periods (n), and StdDev with the standard deviation of
// closing prices for n periods, the above formula becomes:
//     Z_score = (C - SMA(n)) / StdDev(C,n)
// The z-score indicator is not new, but its use can be seen as a supplement to
// Bollinger bands. It offers a simple way to assess the position of the price
// vis-a-vis its resistance and support levels expressed by the Bollinger Bands.
// In addition, crossings of z-score averages may signal the start or the end of
// a tradable trend. Traders may take a step further and look for stronger signals
// by identifying common crossing points of z-score, its average, and average of average.
//
// You can change long to short in the Input Settings
// Please, use it only for learning or paper trading. Do not for real trading.
////////////////////////////////////////////////////////////
strategy(title="Z-Score Strategy", shorttitle="Z-Score Strategy")
Period = input(20, minval=1)
Trigger = input(0)
reverse = input(false, title="Trade reverse")
hline(Trigger, color=purple, linestyle=line)
xStdDev = stdev(close, Period)
xMA = sma(close, Period)
nRes = (close - xMA) / xStdDev
pos = iff(nRes > Trigger, 1,
	   iff(nRes < Trigger, -1, nz(pos[1], 0)))
possig = iff(reverse and pos == 1, -1,
          iff(reverse and pos == -1, 1, pos))
if (possig == 1)
    strategy.entry("Long", strategy.long)
if (possig == -1)
    strategy.entry("Short", strategy.short)
barcolor(possig == -1 ? red: possig == 1 ? green : blue )
plot(nRes, color=blue, title="Z-Score")
Detail
https://www.fmz.com/strategy/434552
Last Modified
2023-12-07 15:17:43