
11 KiB
Name
机器学习启发的双均线RSI交易策略-Machine-Learning-Inspired-Dual-Moving-Average-RSI-Trading-Strategy
Author
ChaoZhang
Strategy Description
[trans]
概述
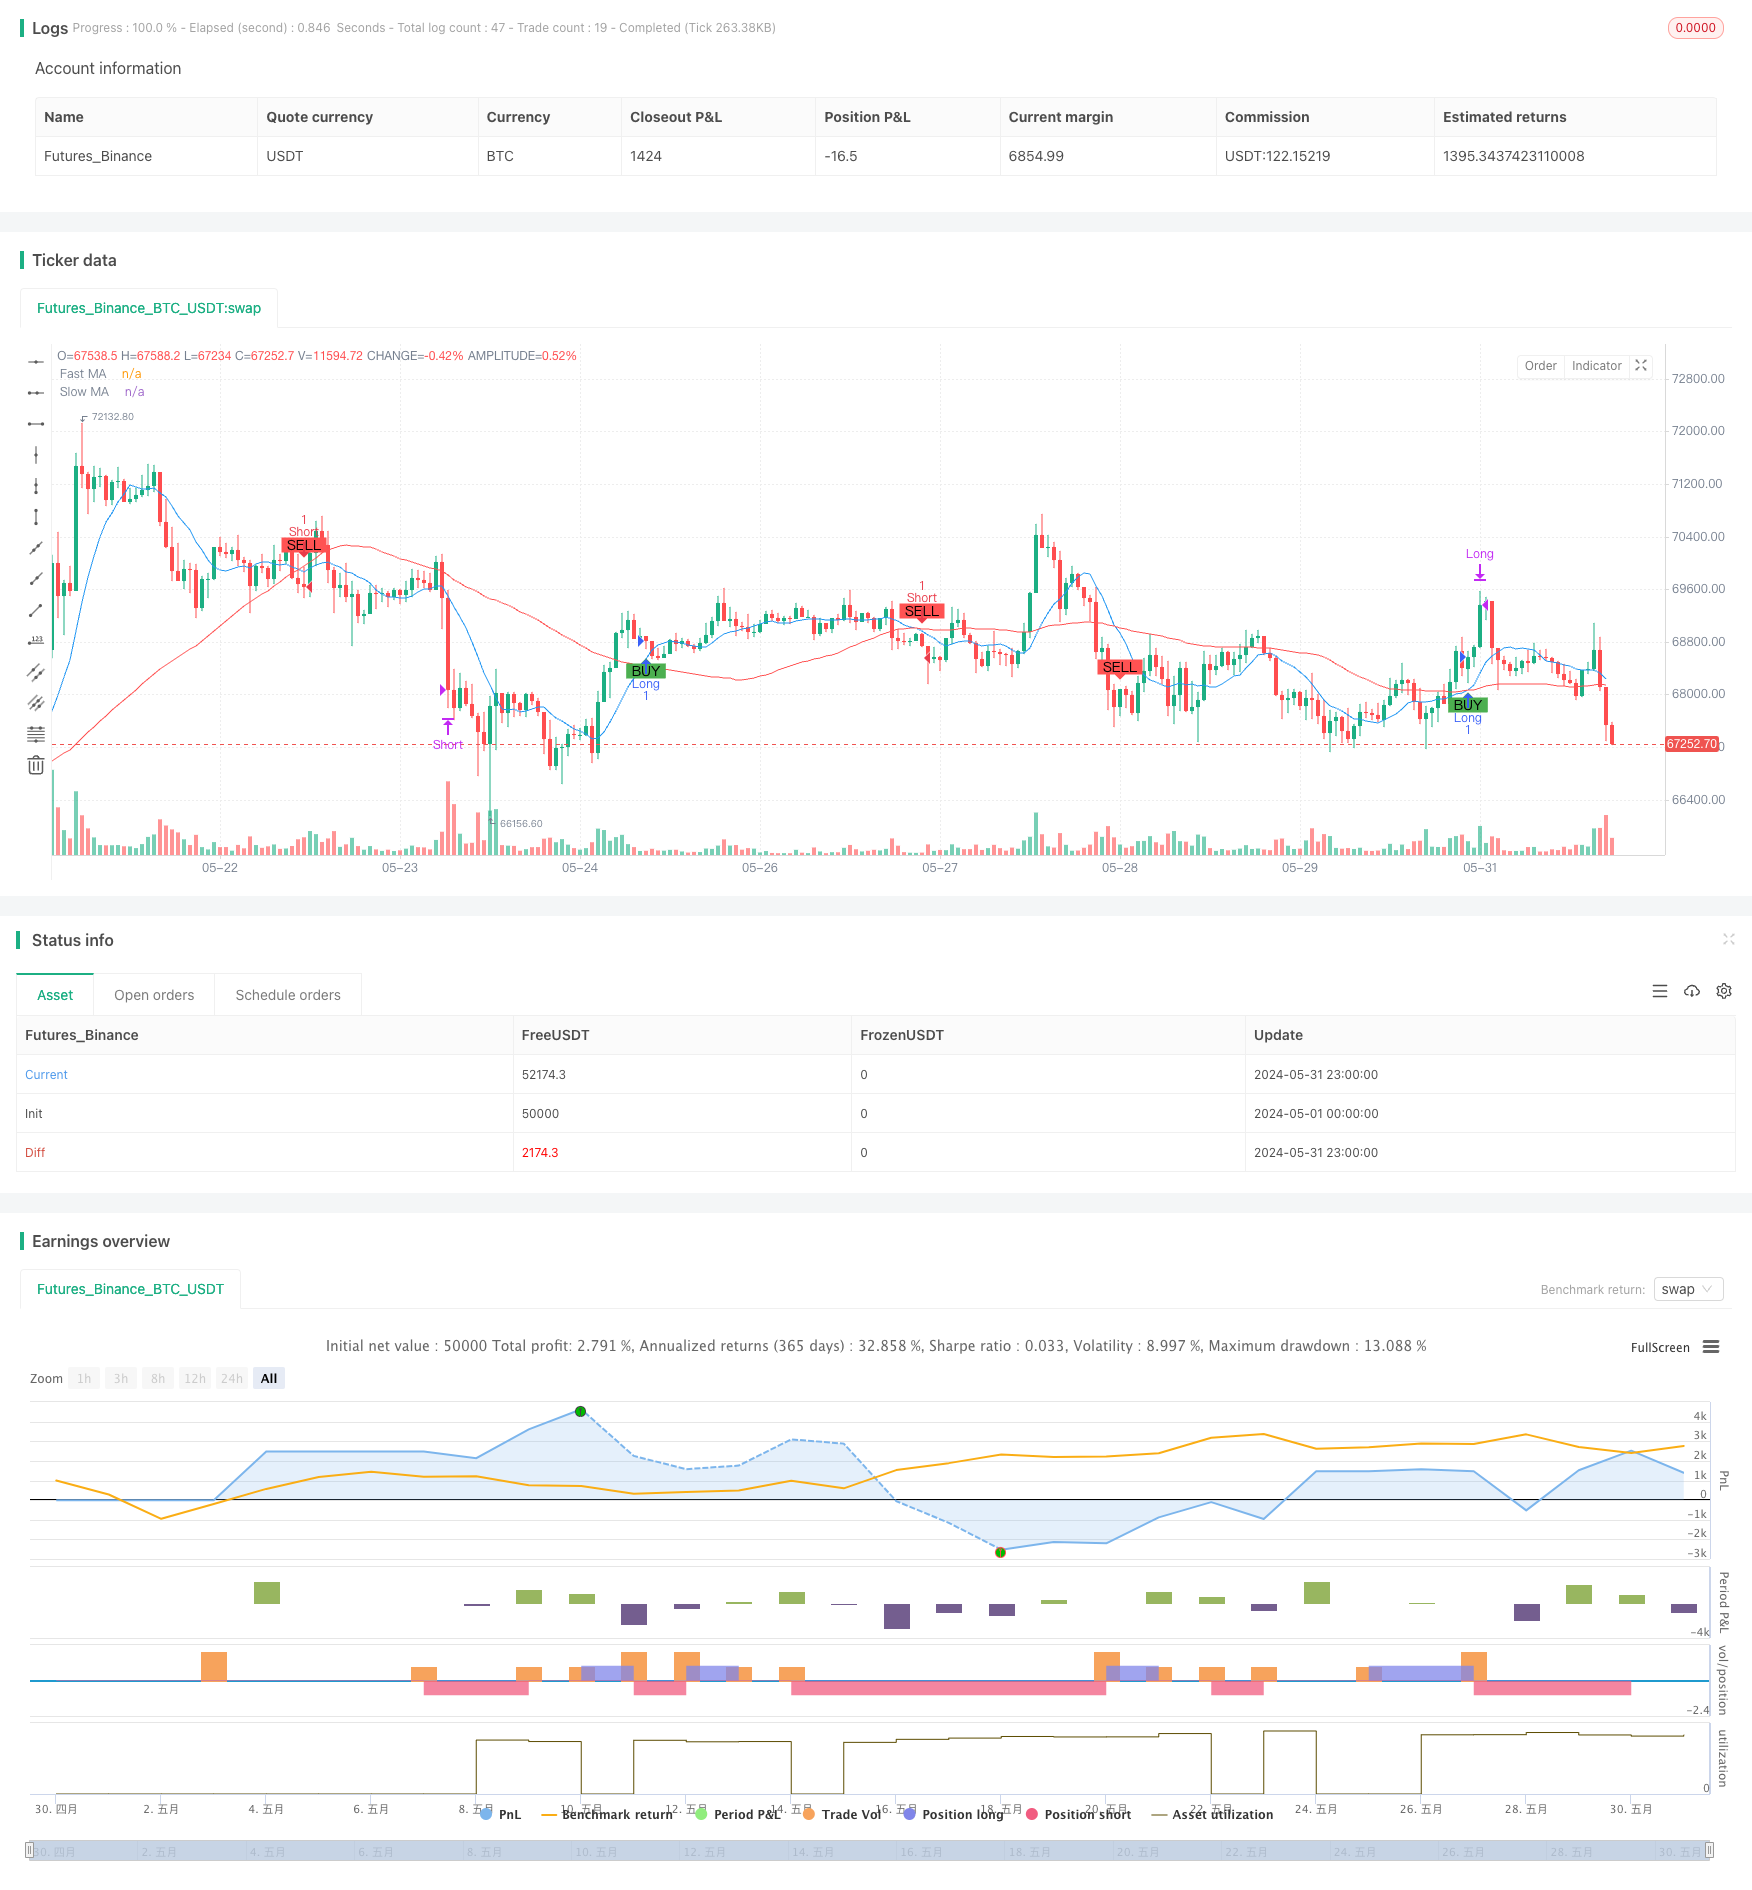
这个交易策略是一个结合了移动平均线和相对强弱指标(RSI)的量化交易系统。该策略利用快速和慢速移动平均线的交叉来识别潜在的趋势变化,同时使用RSI来确认市场的超买和超卖状态。这种方法旨在捕捉市场动量,同时通过RSI过滤来减少假信号。策略的设计灵感来自机器学习中的特征组合和信号过滤概念,尽管它本身并不使用复杂的机器学习算法。
策略原理
该策略的核心原理基于以下几个关键组件:
-
双均线系统:使用快速(10周期)和慢速(50周期)简单移动平均线(SMA)来识别趋势。当快线上穿慢线时,视为潜在的做多信号;当快线下穿慢线时,视为潜在的做空信号。
-
RSI过滤:14周期的RSI用于确认市场状态。RSI低于70时允许做多,高于30时允许做空,这有助于避免在过度延伸的市场中入场。
-
入场逻辑:只有当均线交叉和RSI条件同时满足时,策略才会发出交易信号。这种双重确认机制旨在提高信号的可靠性。
-
出场逻辑:当RSI达到极值(超过70或低于30)时,策略会平掉相应的多头或空头仓位,这有助于在市场可能反转时及时获利了结。
策略优势
-
趋势跟踪与动量结合:通过结合移动平均线和RSI,策略既能捕捉长期趋势,又能识别短期的超买超卖机会。
-
信号过滤:使用RSI作为二次确认,有助于减少假突破带来的误判,提高交易质量。
-
灵活性:策略参数(如均线周期、RSI阈值)可以根据不同市场和时间框架进行优化。
-
风险管理:通过在RSI达到极值时自动平仓,策略内置了一定的风险控制机制。
-
可视化:策略在图表上标记了买卖信号,便于交易者直观理解和回测分析。
策略风险
-
滞后性:移动平均线本质上是滞后指标,可能导致在趋势转折点附近的入场和出场不够及时。
-
震荡市场表现:在横盘或者震荡市场中,频繁的均线交叉可能导致过多的假信号和交易成本。
-
参数敏感性:策略性能可能对所选择的均线周期和RSI阈值敏感,不同参数可能在不同市场环境下表现差异较大。
-
缺乏止损机制:当前策略没有明确的止损规则,在极端市场行情下可能承受较大损失。
-
过度依赖技术指标:策略完全基于技术指标,忽视了基本面和市场情绪等其他重要因素。
策略优化方向
-
自适应参数:引入自适应机制,根据市场波动性动态调整均线周期和RSI阈值,以适应不同的市场环境。
-
加入趋势强度过滤:可以考虑加入ADX(平均方向指数)来衡量趋势强度,只在强趋势市场中交易,以减少震荡市场的假信号。
-
引入止损机制:设置基于ATR(平均真实波幅)的动态止损,或使用固定百分比止损,以更好地控制风险。
-
优化出场策略:除了RSI极值出场外,可以考虑加入移动止盈或者基于趋势反转的出场信号,以更好地锁定利润。
-
增加交易量过滤:在入场信号的基础上,加入交易量确认,只有在放量的情况下才执行交易,以提高信号可靠性。
-
多时间框架分析:结合更长期的趋势分析,只在主趋势方向上交易,以提高胜率。
-
机器学习优化:使用机器学习算法如遗传算法或贝叶斯优化来寻找最优参数组合,提高策略的稳定性和适应性。
总结
这个机器学习启发的双均线RSI交易策略提供了一个结合趋势跟踪和动量交易的框架。通过移动平均线识别趋势,并用RSI进行信号过滤和优化,策略旨在捕捉市场的主要移动。虽然策略设计相对简单,但它为进一步优化和扩展提供了良好的基础。交易者可以根据自己的风险偏好和市场观点,对参数进行调整,或者加入额外的过滤条件来改进策略性能。然而,在实际应用中,仍需要进行充分的回测和前向测试,并结合适当的资金管理策略,以确保在真实市场环境中的稳健表现。
||
Overview
This trading strategy is a quantitative trading system that combines moving averages and the Relative Strength Index (RSI). The strategy uses the crossover of fast and slow moving averages to identify potential trend changes, while utilizing RSI to confirm overbought and oversold market conditions. This approach aims to capture market momentum while reducing false signals through RSI filtering. The strategy design is inspired by concepts of feature combination and signal filtering in machine learning, although it does not use complex machine learning algorithms itself.
Strategy Principles
The core principles of this strategy are based on the following key components:
-
Dual Moving Average System: Uses fast (10-period) and slow (50-period) Simple Moving Averages (SMA) to identify trends. A potential long signal is generated when the fast MA crosses above the slow MA, and a potential short signal when the fast MA crosses below the slow MA.
-
RSI Filtering: A 14-period RSI is used to confirm market conditions. Long entries are allowed when RSI is below 70, and short entries when RSI is above 30, helping to avoid entering overstretched markets.
-
Entry Logic: The strategy only generates trading signals when both the MA crossover and RSI conditions are met simultaneously. This double confirmation mechanism aims to improve signal reliability.
-
Exit Logic: The strategy closes respective long or short positions when RSI reaches extreme values (above 70 or below 30), helping to secure profits when the market might be reversing.
Strategy Advantages
-
Trend Following and Momentum Combination: By combining moving averages and RSI, the strategy can capture long-term trends while identifying short-term overbought and oversold opportunities.
-
Signal Filtering: Using RSI as a secondary confirmation helps reduce false breakouts and improves trade quality.
-
Flexibility: Strategy parameters (such as MA periods and RSI thresholds) can be optimized for different markets and timeframes.
-
Risk Management: The strategy incorporates a built-in risk control mechanism by automatically closing positions when RSI reaches extreme values.
-
Visualization: The strategy marks buy and sell signals on the chart, facilitating intuitive understanding and backtesting analysis for traders.
Strategy Risks
-
Lag: Moving averages are inherently lagging indicators, which may lead to less timely entries and exits near trend reversal points.
-
Performance in Ranging Markets: In sideways or choppy markets, frequent MA crossovers may result in excessive false signals and trading costs.
-
Parameter Sensitivity: Strategy performance may be sensitive to the chosen MA periods and RSI thresholds, with different parameters potentially performing differently across various market environments.
-
Lack of Stop-Loss Mechanism: The current strategy does not have explicit stop-loss rules, which may lead to significant losses in extreme market conditions.
-
Over-reliance on Technical Indicators: The strategy is entirely based on technical indicators, ignoring other important factors such as fundamentals and market sentiment.
Strategy Optimization Directions
-
Adaptive Parameters: Introduce adaptive mechanisms to dynamically adjust MA periods and RSI thresholds based on market volatility, adapting to different market environments.
-
Add Trend Strength Filter: Consider adding ADX (Average Directional Index) to measure trend strength, trading only in strong trend markets to reduce false signals in ranging markets.
-
Introduce Stop-Loss Mechanism: Implement dynamic stop-losses based on ATR (Average True Range) or use fixed percentage stop-losses for better risk control.
-
Optimize Exit Strategy: In addition to RSI extreme value exits, consider adding trailing stops or trend reversal-based exit signals to better secure profits.
-
Add Volume Filter: On top of entry signals, add volume confirmation, executing trades only when accompanied by increased volume to improve signal reliability.
-
Multi-Timeframe Analysis: Incorporate longer-term trend analysis, trading only in the direction of the main trend to improve win rates.
-
Machine Learning Optimization: Use machine learning algorithms such as genetic algorithms or Bayesian optimization to find optimal parameter combinations, enhancing strategy stability and adaptability.
Conclusion
This Machine Learning Inspired Dual Moving Average RSI Trading Strategy provides a framework that combines trend following and momentum trading. By identifying trends through moving averages and optimizing signals with RSI, the strategy aims to capture major market movements. While the strategy design is relatively simple, it provides a good foundation for further optimization and expansion. Traders can adjust parameters according to their risk preferences and market views, or add additional filtering conditions to improve strategy performance. However, in practical application, thorough backtesting and forward testing are still necessary, combined with appropriate money management strategies, to ensure robust performance in real market environments.
[/trans]
Source (PineScript)
/*backtest
start: 2024-05-01 00:00:00
end: 2024-05-31 23:59:59
period: 1h
basePeriod: 15m
exchanges: [{"eid":"Futures_Binance","currency":"BTC_USDT"}]
*/

//@version=5
strategy("ML Inspired Strategy for Nifty50", overlay=true)

// Define the input parameters for the strategy
length_fast = input.int(10, minval=1, title="Fast MA Length")
length_slow = input.int(50, minval=1, title="Slow MA Length")
rsi_length = input.int(14, minval=1, title="RSI Length")
rsi_overbought = input.int(70, minval=1, title="RSI Overbought Level")
rsi_oversold = input.int(30, minval=1, title="RSI Oversold Level")

// Calculate the moving averages
ma_fast = ta.sma(close, length_fast)
ma_slow = ta.sma(close, length_slow)

// Calculate the RSI
rsi = ta.rsi(close, rsi_length)

// Define the conditions for long and short entries
long_condition = ta.crossover(ma_fast, ma_slow) and rsi < rsi_overbought
short_condition = ta.crossunder(ma_fast, ma_slow) and rsi > rsi_oversold

// Plot the moving averages
plot(ma_fast, title="Fast MA", color=color.blue)
plot(ma_slow, title="Slow MA", color=color.red)

// Add strategy logic for entering and exiting trades
if (long_condition)
    strategy.entry("Long", strategy.long)
if (short_condition)
    strategy.entry("Short", strategy.short)

// Plot buy/sell signals on the chart
plotshape(series=long_condition, title="Buy Signal", location=location.belowbar, color=color.green, style=shape.labelup, text="BUY")
plotshape(series=short_condition, title="Sell Signal", location=location.abovebar, color=color.red, style=shape.labeldown, text="SELL")

// Add exit conditions
if (rsi > rsi_overbought)
    strategy.close("Long")
if (rsi < rsi_oversold)
    strategy.close("Short")
Detail
https://www.fmz.com/strategy/454741
Last Modified
2024-06-21 15:27:18