
190 lines
9.4 KiB
Markdown
190 lines
9.4 KiB
Markdown
|
|
> Name
|
|
|
|
智能机构交易结构动量策略-Intelligent-Institutional-Trading-Structure-Momentum-Strategy
|
|
|
|
> Author
|
|
|
|
ChaoZhang
|
|
|
|
> Strategy Description
|
|
|
|
|
|
|
|
[trans]
|
|
#### 概述
|
|
|
|
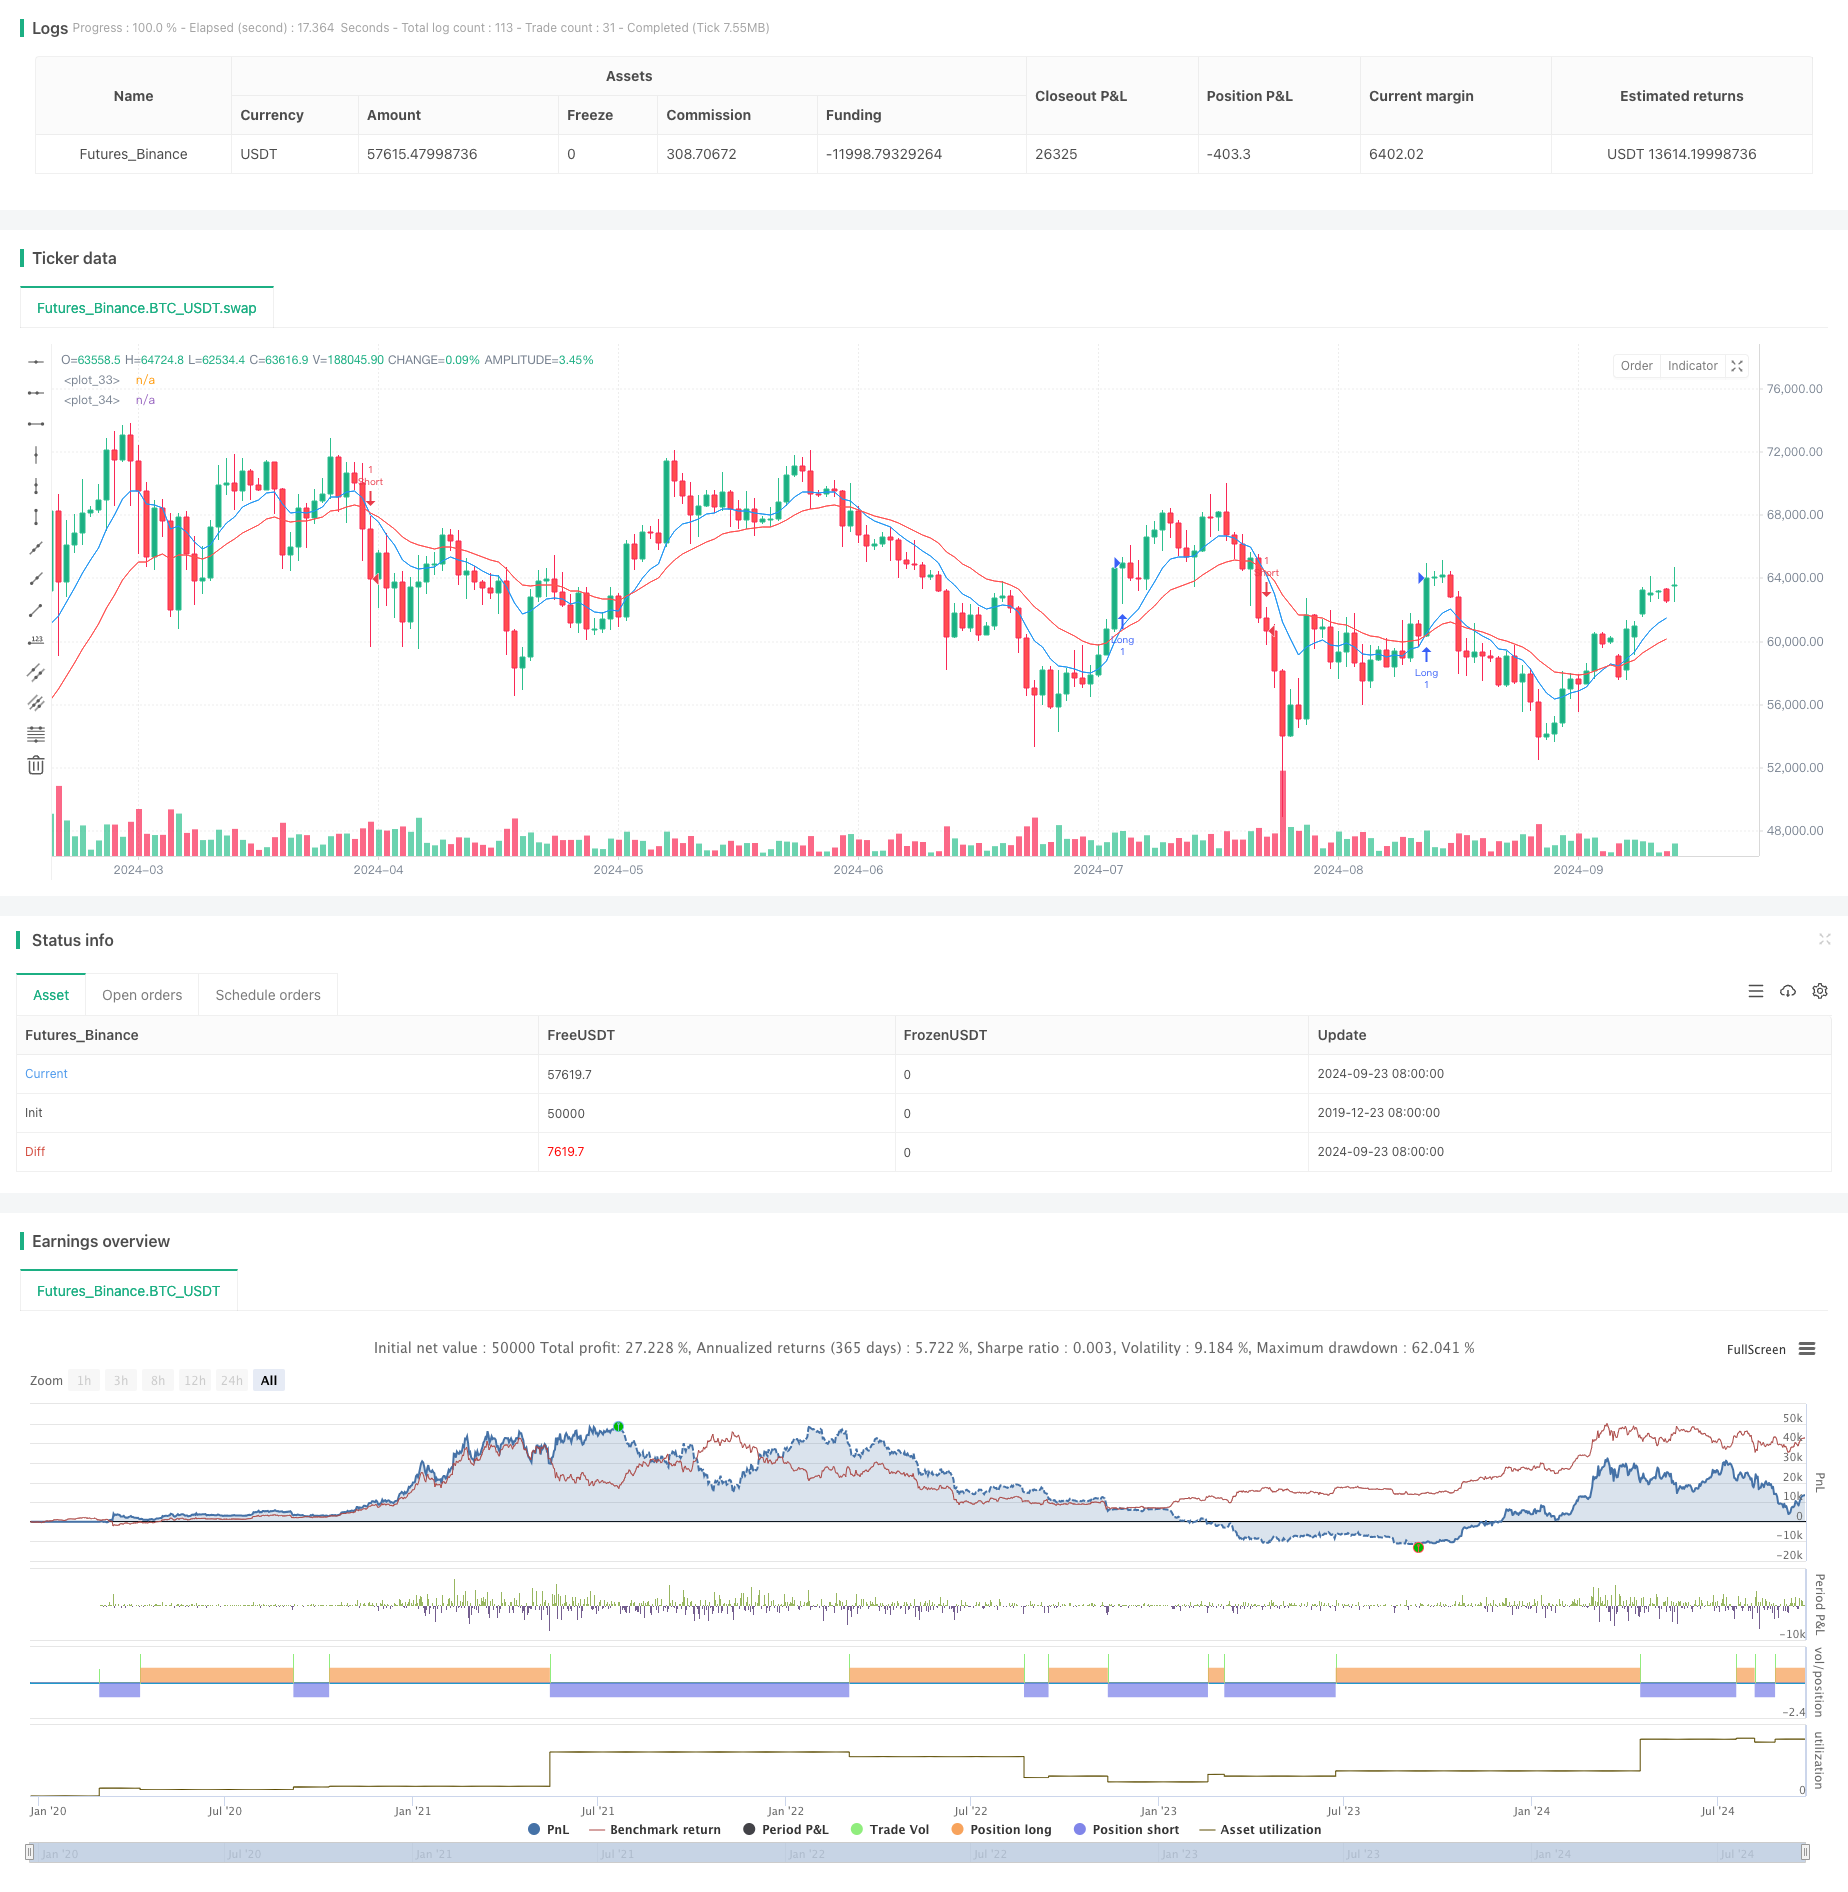
智能机构交易结构动量策略是一种结合了市场结构、机构交易理论和动量分析的高级交易方法。该策略利用指数移动平均线(EMA)来确定市场结构和趋势方向,同时通过识别高流动性区域和机构交易蜡烛图来寻找潜在的入场和出场机会。这种方法旨在捕捉市场中的大规模资金流动,从而提高交易的成功率和盈利能力。
|
|
|
|
#### 策略原理
|
|
|
|
1. 市场结构分析:使用9周期和21周期的EMA交叉来确定市场趋势。EMA快线上穿慢线视为看涨信号,反之则为看跌信号。
|
|
|
|
2. 流动性区域识别:通过计算50个周期内的最高价和最低价来确定高流动性区域,这些区域通常是机构交易者的目标。
|
|
|
|
3. 机构交易蜡烛图:定义为成交量高于50周期平均值且收盘价高于(看涨)或低于(看跌)开盘价的蜡烛图。
|
|
|
|
4. 入场信号:当市场结构看涨且出现机构买入蜡烛图时,产生做多信号;当市场结构看跌且出现机构卖出蜡烛图时,产生做空信号。
|
|
|
|
5. 风险管理:使用相应的流动性区域作为止损点,以限制潜在损失。
|
|
|
|
#### 策略优势
|
|
|
|
1. 多维度分析:结合技术指标、价格行为和成交量分析,提供全面的市场洞察。
|
|
|
|
2. 跟随大资金:通过识别机构交易活动,提高了跟随市场主导力量的能力。
|
|
|
|
3. 风险控制:使用关键流动性水平作为止损点,有助于有效管理风险。
|
|
|
|
4. 适应性强:可以应用于不同的市场和时间框架,具有良好的灵活性。
|
|
|
|
5. 趋势捕捉:利用EMA交叉识别趋势,有助于捕捉大趋势中的交易机会。
|
|
|
|
#### 策略风险
|
|
|
|
1. 假突破:在横盘市场中,可能会出现频繁的假突破信号,导致连续亏损。
|
|
|
|
2. 滞后性:EMA作为滞后指标,可能在趋势反转初期错过机会或产生错误信号。
|
|
|
|
3. 过度依赖成交量:在某些市场条件下,成交量可能不能准确反映真实的市场情绪。
|
|
|
|
4. 参数敏感性:策略性能可能对EMA周期和成交量阈值等参数设置敏感。
|
|
|
|
5. 市场噪音:在高波动性环境下,可能难以准确识别真正的机构交易活动。
|
|
|
|
#### 策略优化方向
|
|
|
|
1. 引入额外过滤器:考虑添加如相对强弱指标(RSI)或随机震荡指标(Stochastic)等辅助指标,以减少假信号。
|
|
|
|
2. 动态参数调整:实现基于市场波动性自动调整EMA周期和成交量阈值的机制,以适应不同市场条件。
|
|
|
|
3. 多时间框架分析:整合更高时间框架的市场结构分析,以提高交易决策的准确性。
|
|
|
|
4. 价格行为确认:在入场前增加额外的价格行为确认,如关键水平突破或特定蜡烛图形态。
|
|
|
|
5. 机器学习整合:利用机器学习算法优化参数选择和信号生成过程,提高策略的适应性和性能。
|
|
|
|
#### 总结
|
|
|
|
智能机构交易结构动量策略是一种综合了多个先进交易概念的复杂方法。通过结合EMA、成交量分析和机构交易理论,该策略旨在识别并跟随大资金流向,同时管理风险。虽然这种方法具有捕捉重要市场移动的潜力,但仍需要仔细的参数优化和持续的市场适应。通过进一步的改进和优化,特别是在信号过滤和动态参数调整方面,该策略有潜力成为一个强大的交易工具。然而,交易者应该始终牢记市场的不可预测性,并结合全面的风险管理策略来部署这种交易方法。
|
|
|
|
||
|
|
|
|
#### Overview
|
|
|
|
The Intelligent Institutional Trading Structure Momentum Strategy is an advanced trading approach that combines market structure analysis, institutional trading theory, and momentum analysis. This strategy utilizes Exponential Moving Averages (EMAs) to determine market structure and trend direction, while identifying high liquidity zones and institutional trading candles to find potential entry and exit opportunities. The approach aims to capture large-scale capital flows in the market, thereby increasing the success rate and profitability of trades.
|
|
|
|
#### Strategy Principles
|
|
|
|
1. Market Structure Analysis: Uses crossovers of 9-period and 21-period EMAs to determine market trends. A bullish signal is generated when the fast EMA crosses above the slow EMA, and vice versa for bearish signals.
|
|
|
|
2. Liquidity Zone Identification: Calculates the highest high and lowest low over 50 periods to identify high liquidity zones, which are often targets for institutional traders.
|
|
|
|
3. Institutional Trading Candles: Defined as candles with volume higher than the 50-period average and closing price above (bullish) or below (bearish) the opening price.
|
|
|
|
4. Entry Signals: A long signal is generated when the market structure is bullish and an institutional buying candle appears; a short signal is generated when the market structure is bearish and an institutional selling candle appears.
|
|
|
|
5. Risk Management: Uses corresponding liquidity zones as stop-loss points to limit potential losses.
|
|
|
|
#### Strategy Advantages
|
|
|
|
1. Multi-dimensional Analysis: Combines technical indicators, price action, and volume analysis to provide comprehensive market insights.
|
|
|
|
2. Following Big Money: Improves the ability to follow market-driving forces by identifying institutional trading activity.
|
|
|
|
3. Risk Control: Uses key liquidity levels as stop-loss points, helping to effectively manage risk.
|
|
|
|
4. High Adaptability: Can be applied to different markets and timeframes, offering good flexibility.
|
|
|
|
5. Trend Capture: Utilizes EMA crossovers to identify trends, helping to capture trading opportunities within major trends.
|
|
|
|
#### Strategy Risks
|
|
|
|
1. False Breakouts: In ranging markets, frequent false breakout signals may lead to consecutive losses.
|
|
|
|
2. Lagging Nature: EMAs, being lagging indicators, may miss opportunities or generate false signals at the beginning of trend reversals.
|
|
|
|
3. Over-reliance on Volume: In certain market conditions, volume may not accurately reflect true market sentiment.
|
|
|
|
4. Parameter Sensitivity: Strategy performance may be sensitive to parameter settings such as EMA periods and volume thresholds.
|
|
|
|
5. Market Noise: In high-volatility environments, it may be difficult to accurately identify genuine institutional trading activity.
|
|
|
|
#### Strategy Optimization Directions
|
|
|
|
1. Introduce Additional Filters: Consider adding auxiliary indicators such as Relative Strength Index (RSI) or Stochastic Oscillator to reduce false signals.
|
|
|
|
2. Dynamic Parameter Adjustment: Implement mechanisms to automatically adjust EMA periods and volume thresholds based on market volatility to adapt to different market conditions.
|
|
|
|
3. Multi-timeframe Analysis: Integrate market structure analysis from higher timeframes to improve trading decision accuracy.
|
|
|
|
4. Price Action Confirmation: Add additional price action confirmation before entry, such as key level breakouts or specific candlestick patterns.
|
|
|
|
5. Machine Learning Integration: Utilize machine learning algorithms to optimize parameter selection and signal generation processes, improving strategy adaptability and performance.
|
|
|
|
#### Summary
|
|
|
|
The Intelligent Institutional Trading Structure Momentum Strategy is a sophisticated method that combines multiple advanced trading concepts. By integrating EMAs, volume analysis, and institutional trading theory, the strategy aims to identify and follow large capital flows while managing risk. While this approach has the potential to capture significant market moves, it still requires careful parameter optimization and ongoing market adaptation. Through further improvements and optimizations, particularly in signal filtering and dynamic parameter adjustment, the strategy has the potential to become a powerful trading tool. However, traders should always keep in mind the unpredictability of markets and deploy this trading approach in conjunction with a comprehensive risk management strategy.
|
|
|
|
[/trans]
|
|
|
|
|
|
|
|
> Source (PineScript)
|
|
|
|
``` pinescript
|
|
/*backtest
|
|
start: 2019-12-23 08:00:00
|
|
end: 2024-09-24 08:00:00
|
|
period: 1d
|
|
basePeriod: 1d
|
|
exchanges: [{"eid":"Futures_Binance","currency":"BTC_USDT"}]
|
|
*/
|
|
|
|
//@version=5
|
|
strategy("SMC + ICT Scalping Strategy", overlay=true)
|
|
|
|
// إعداد المتوسطات المتحركة
|
|
ema_fast = ta.ema(close, 9)
|
|
ema_slow = ta.ema(close, 21)
|
|
|
|
// تحديد الهيكل السوقي (الاتجاه)
|
|
bullish_structure = ta.crossover(ema_fast, ema_slow)
|
|
bearish_structure = ta.crossunder(ema_fast, ema_slow)
|
|
|
|
// تحديد مناطق السيولة (Liquidity Zones)
|
|
liquidity_high = ta.highest(high, 50)
|
|
liquidity_low = ta.lowest(low, 50)
|
|
|
|
// تحديد الشموع المؤسسية (Institutional Candles)
|
|
is_institutional_bullish = close > open and volume > ta.sma(volume, 50)
|
|
is_institutional_bearish = close < open and volume > ta.sma(volume, 50)
|
|
|
|
// إشارة الدخول
|
|
long_entry = bullish_structure and is_institutional_bullish
|
|
short_entry = bearish_structure and is_institutional_bearish
|
|
|
|
// تنفيذ صفقات الشراء
|
|
if (long_entry)
|
|
strategy.entry("Long", strategy.long, stop=liquidity_low, comment="BUY")
|
|
|
|
// تنفيذ صفقات البيع
|
|
if (short_entry)
|
|
strategy.entry("Short", strategy.short, stop=liquidity_high, comment="SELL")
|
|
|
|
// رسم المتوسطات المتحركة
|
|
plot(ema_fast, color=color.blue, linewidth=1)
|
|
plot(ema_slow, color=color.red, linewidth=1)
|
|
|
|
|
|
|
|
```
|
|
|
|
> Detail
|
|
|
|
https://www.fmz.com/strategy/468321
|
|
|
|
> Last Modified
|
|
|
|
2024-09-26 15:35:59
|