
9.7 KiB
Name
日线区间突破单向交易策略-Daily-Range-Breakout-Single-Direction-Trading-Strategy
Author
ChaoZhang
Strategy Description
[trans]
概述
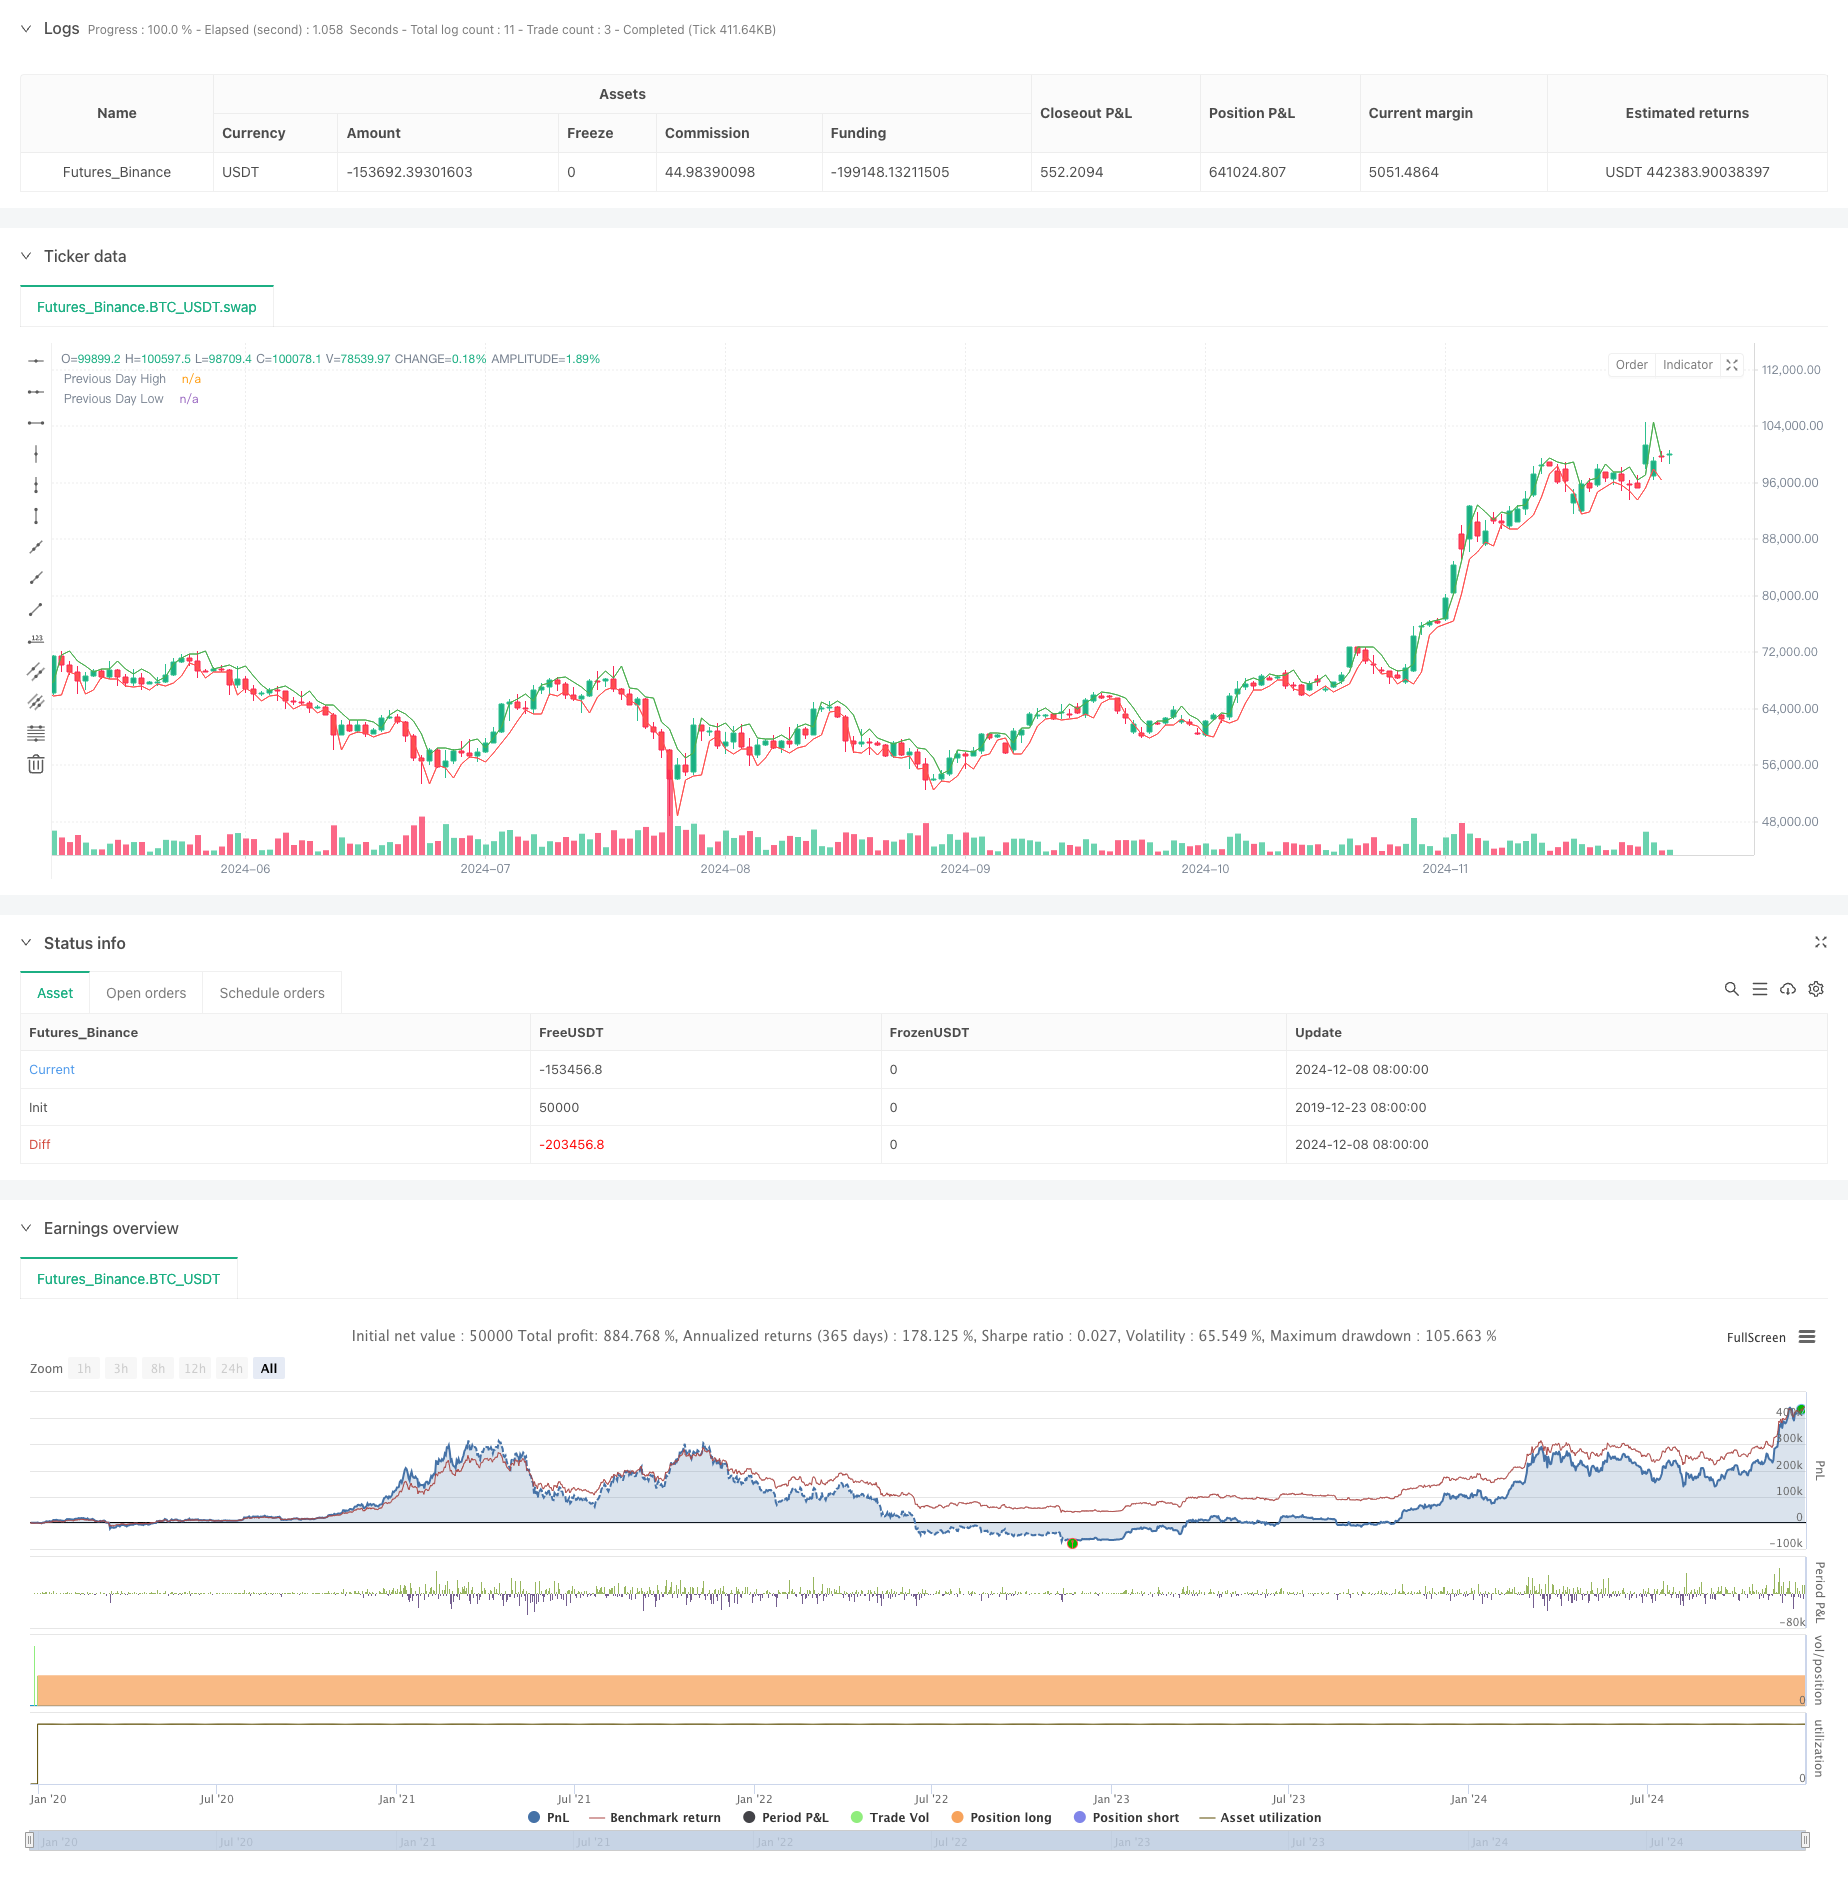
这是一个基于前一交易日高低点的区间突破交易策略。策略通过识别价格突破或跌破前一日的高点或低点来寻找交易机会,每个突破或跌破方向仅执行一次交易。策略采用固定的50点止盈止损设置,并在每个交易日开始时重置交易标记,以确保交易的有序进行。该策略的核心是捕捉日内价格的单向突破行情,通过严格的交易管理来控制风险。
策略原理
策略的核心逻辑包括以下几个方面:
- 交易信号生成: 系统通过判断当前收盘价是否突破前一交易日的高点或低点来确定交易方向。当价格收盘突破前一日高点时,系统会发出做多信号;当价格收盘跌破前一日低点时,系统会发出做空信号。
- 交易频率控制: 策略采用标记位(flags)来确保每个方向每天只执行一次交易。这种设计可以避免在同一价格区域反复交易,降低交易成本。
- 风险管理: 每笔交易都设置了固定的50点止盈止损,这种对称的风险管理方式可以有效控制单笔交易的风险。
- 日内重置机制: 在每个交易日开始时,系统会重置交易标记,为新的交易日做好准备。这个机制确保了策略可以捕捉到新的交易机会。
策略优势
- 交易逻辑清晰: 策略基于简单的价格突破理论,交易规则明确,易于理解和执行。
- 风险控制严格: 通过固定的止盈止损点数和单向交易限制,有效控制了每笔交易的风险。
- 避免过度交易: 每个方向每天只允许一次交易,可以避免在震荡市场中频繁交易导致的损失。
- 自动化程度高: 策略可以完全自动化执行,不需要人工干预。
- 适应性强: 策略可以应用于不同的市场环境,特别是在趋势明显的市场中表现更好。
风险分析
- 假突破风险: 市场可能出现虚假突破,导致交易亏损。建议结合其他技术指标进行确认。
- 震荡市风险: 在横盘震荡市场中,频繁的突破和跌破可能导致连续止损。可以通过增加过滤条件来改善。
- 固定止损风险: 固定的止损点数可能不适合所有市场环境,在波动性较大的市场中可能止损过早。
- 滑点风险: 在市场波动剧烈时,可能因滑点导致实际止损点位偏离预期。
优化方向
- 动态止损设置: 可以根据市场波动率(如ATR指标)动态调整止盈止损点数。
- 增加趋势过滤: 结合趋势指标(如移动平均线或ADX)来过滤交易信号。
- 优化突破确认: 可以增加成交量确认或其他技术指标来提高突破的可靠性。
- 时间过滤: 可以添加时间过滤条件,避免在波动较大的时段交易。
- 仓位管理优化: 可以根据市场波动性和账户风险承受能力动态调整仓位大小。
总结
该策略是一个基于日线区间突破的经典交易系统,通过严格的交易管理和风险控制,适合追踪市场的单向趋势行情。虽然存在一些固有的风险,但通过合理的优化和改进,可以提高策略的稳定性和盈利能力。策略的成功关键在于正确处理假突破风险,合理设置止盈止损,并在不同市场环境下保持策略的适应性。||
Overview
This is a range breakout trading strategy based on the previous day's high and low points. The strategy seeks trading opportunities by identifying price breakouts or breakdowns beyond the previous day's high or low points, executing only one trade per breakout or breakdown direction. The strategy employs fixed 50-point take-profit and stop-loss settings and resets trade flags at the beginning of each trading day to ensure orderly trading. The core of this strategy is to capture single-direction price breakout movements within the day while controlling risk through strict trade management.
Strategy Principles
The core logic of the strategy includes the following aspects:
- Trade Signal Generation: The system determines the trading direction by checking whether the current closing price breaks through the previous day's high or low. When the price closes above the previous day's high, the system generates a long signal; when the price closes below the previous day's low, the system generates a short signal.
- Trade Frequency Control: The strategy uses flags to ensure only one trade per direction per day. This design prevents repeated trading in the same price area and reduces trading costs.
- Risk Management: Each trade has a fixed 50-point take-profit and stop-loss, providing symmetrical risk management that effectively controls single-trade risk.
- Daily Reset Mechanism: The system resets trade flags at the beginning of each trading day, preparing for new trading opportunities. This mechanism ensures the strategy can capture new trading opportunities.
Strategy Advantages
- Clear Trading Logic: The strategy is based on simple price breakout theory with clear trading rules that are easy to understand and execute.
- Strict Risk Control: Effectively controls risk for each trade through fixed take-profit and stop-loss points and single-direction trading limits.
- Prevents Overtrading: Allowing only one trade per direction per day helps avoid losses from frequent trading in choppy markets.
- High Automation: The strategy can be fully automated without human intervention.
- High Adaptability: The strategy can be applied to different market environments, performing particularly well in trending markets.
Risk Analysis
- False Breakout Risk: Markets may exhibit false breakouts leading to trading losses. Consider confirming with other technical indicators.
- Choppy Market Risk: Frequent breakouts and breakdowns in ranging markets may lead to consecutive stops. Can be improved by adding filtering conditions.
- Fixed Stop-Loss Risk: Fixed stop-loss points may not suit all market conditions and might trigger too early in highly volatile markets.
- Slippage Risk: During intense market volatility, actual stop-loss points may deviate from expected levels due to slippage.
Optimization Directions
- Dynamic Stop-Loss Setting: Adjust take-profit and stop-loss points dynamically based on market volatility (e.g., ATR indicator).
- Add Trend Filters: Incorporate trend indicators (such as moving averages or ADX) to filter trade signals.
- Optimize Breakout Confirmation: Add volume confirmation or other technical indicators to improve breakout reliability.
- Time Filtering: Add time filtering conditions to avoid trading during highly volatile periods.
- Position Management Optimization: Dynamically adjust position sizes based on market volatility and account risk tolerance.
Conclusion
This strategy is a classic trading system based on daily range breakouts, suitable for tracking single-direction market trends through strict trade management and risk control. While there are some inherent risks, the strategy's stability and profitability can be improved through reasonable optimization and enhancement. The key to success lies in properly handling false breakout risks, setting appropriate take-profit and stop-loss levels, and maintaining strategy adaptability across different market conditions. [/trans]
Source (PineScript)
/*backtest
start: 2019-12-23 08:00:00
end: 2024-12-09 08:00:00
period: 1d
basePeriod: 1d
exchanges: [{"eid":"Futures_Binance","currency":"BTC_USDT"}]
*/

//@version=5
strategy("US 30 Daily Breakout Strategy (Single Trade Per Breakout/Breakdown, New York Time)", overlay=true, default_qty_type=strategy.percent_of_equity, default_qty_value=100, trim_orders = true)

// Set pip size for US 30 (1 pip = 1 point)
var float pip = 1.0

// Set take profit and stop loss in points (1 pip = 1 point)
take_profit_pips = 50
stop_loss_pips = 50

// Calculate the previous day's high and low (assumes chart timezone is set to New York)
prevDayHigh = request.security(syminfo.tickerid, "D", high[1])
prevDayLow = request.security(syminfo.tickerid, "D", low[1])

// Initialize flags to track if a breakout/breakdown trade has been taken
var bool breakout_traded = false
var bool breakdown_traded = false

// Reset flags at the start of a new day in New York timezone (as per chart setting)
if (ta.change(time("D")))
    breakout_traded := false
    breakdown_traded := false

// Condition for a long entry: candle closes above the previous day's high and no breakout trade has been taken
longCondition = close > prevDayHigh and strategy.opentrades == 0 and not breakout_traded

// Condition for a short entry: candle closes below the previous day's low and no breakdown trade has been taken
shortCondition = close < prevDayLow and strategy.opentrades == 0 and not breakdown_traded

// Execute long trade if the condition is met, and set the breakout flag
if (longCondition)
    strategy.entry("Long", strategy.long)
    strategy.exit("Take Profit/Stop Loss", "Long", limit=close + take_profit_pips * pip, stop=close - stop_loss_pips * pip)
    breakout_traded := true  // Set breakout flag

// Execute short trade if the condition is met, and set the breakdown flag
if (shortCondition)
    strategy.entry("Short", strategy.short)
    strategy.exit("Take Profit/Stop Loss", "Short", limit=close - take_profit_pips * pip, stop=close + stop_loss_pips * pip)
    breakdown_traded := true  // Set breakdown flag

// Plotting the previous day's high and low for visualization
plot(prevDayHigh, color=color.green, linewidth=1, title="Previous Day High")
plot(prevDayLow, color=color.red, linewidth=1, title="Previous Day Low")
Detail
https://www.fmz.com/strategy/474679
Last Modified
2024-12-11 15:23:37