
201 lines
9.3 KiB
Markdown
201 lines
9.3 KiB
Markdown
|
|
> Name
|
|
|
|
支撑阻力与MACD长线策略Strategy-of-Support-Resistance-with-MACD-LONG
|
|
|
|
> Author
|
|
|
|
ChaoZhang
|
|
|
|
> Strategy Description
|
|
|
|
|
|
[trans]
|
|
|
|
## 概述
|
|
|
|
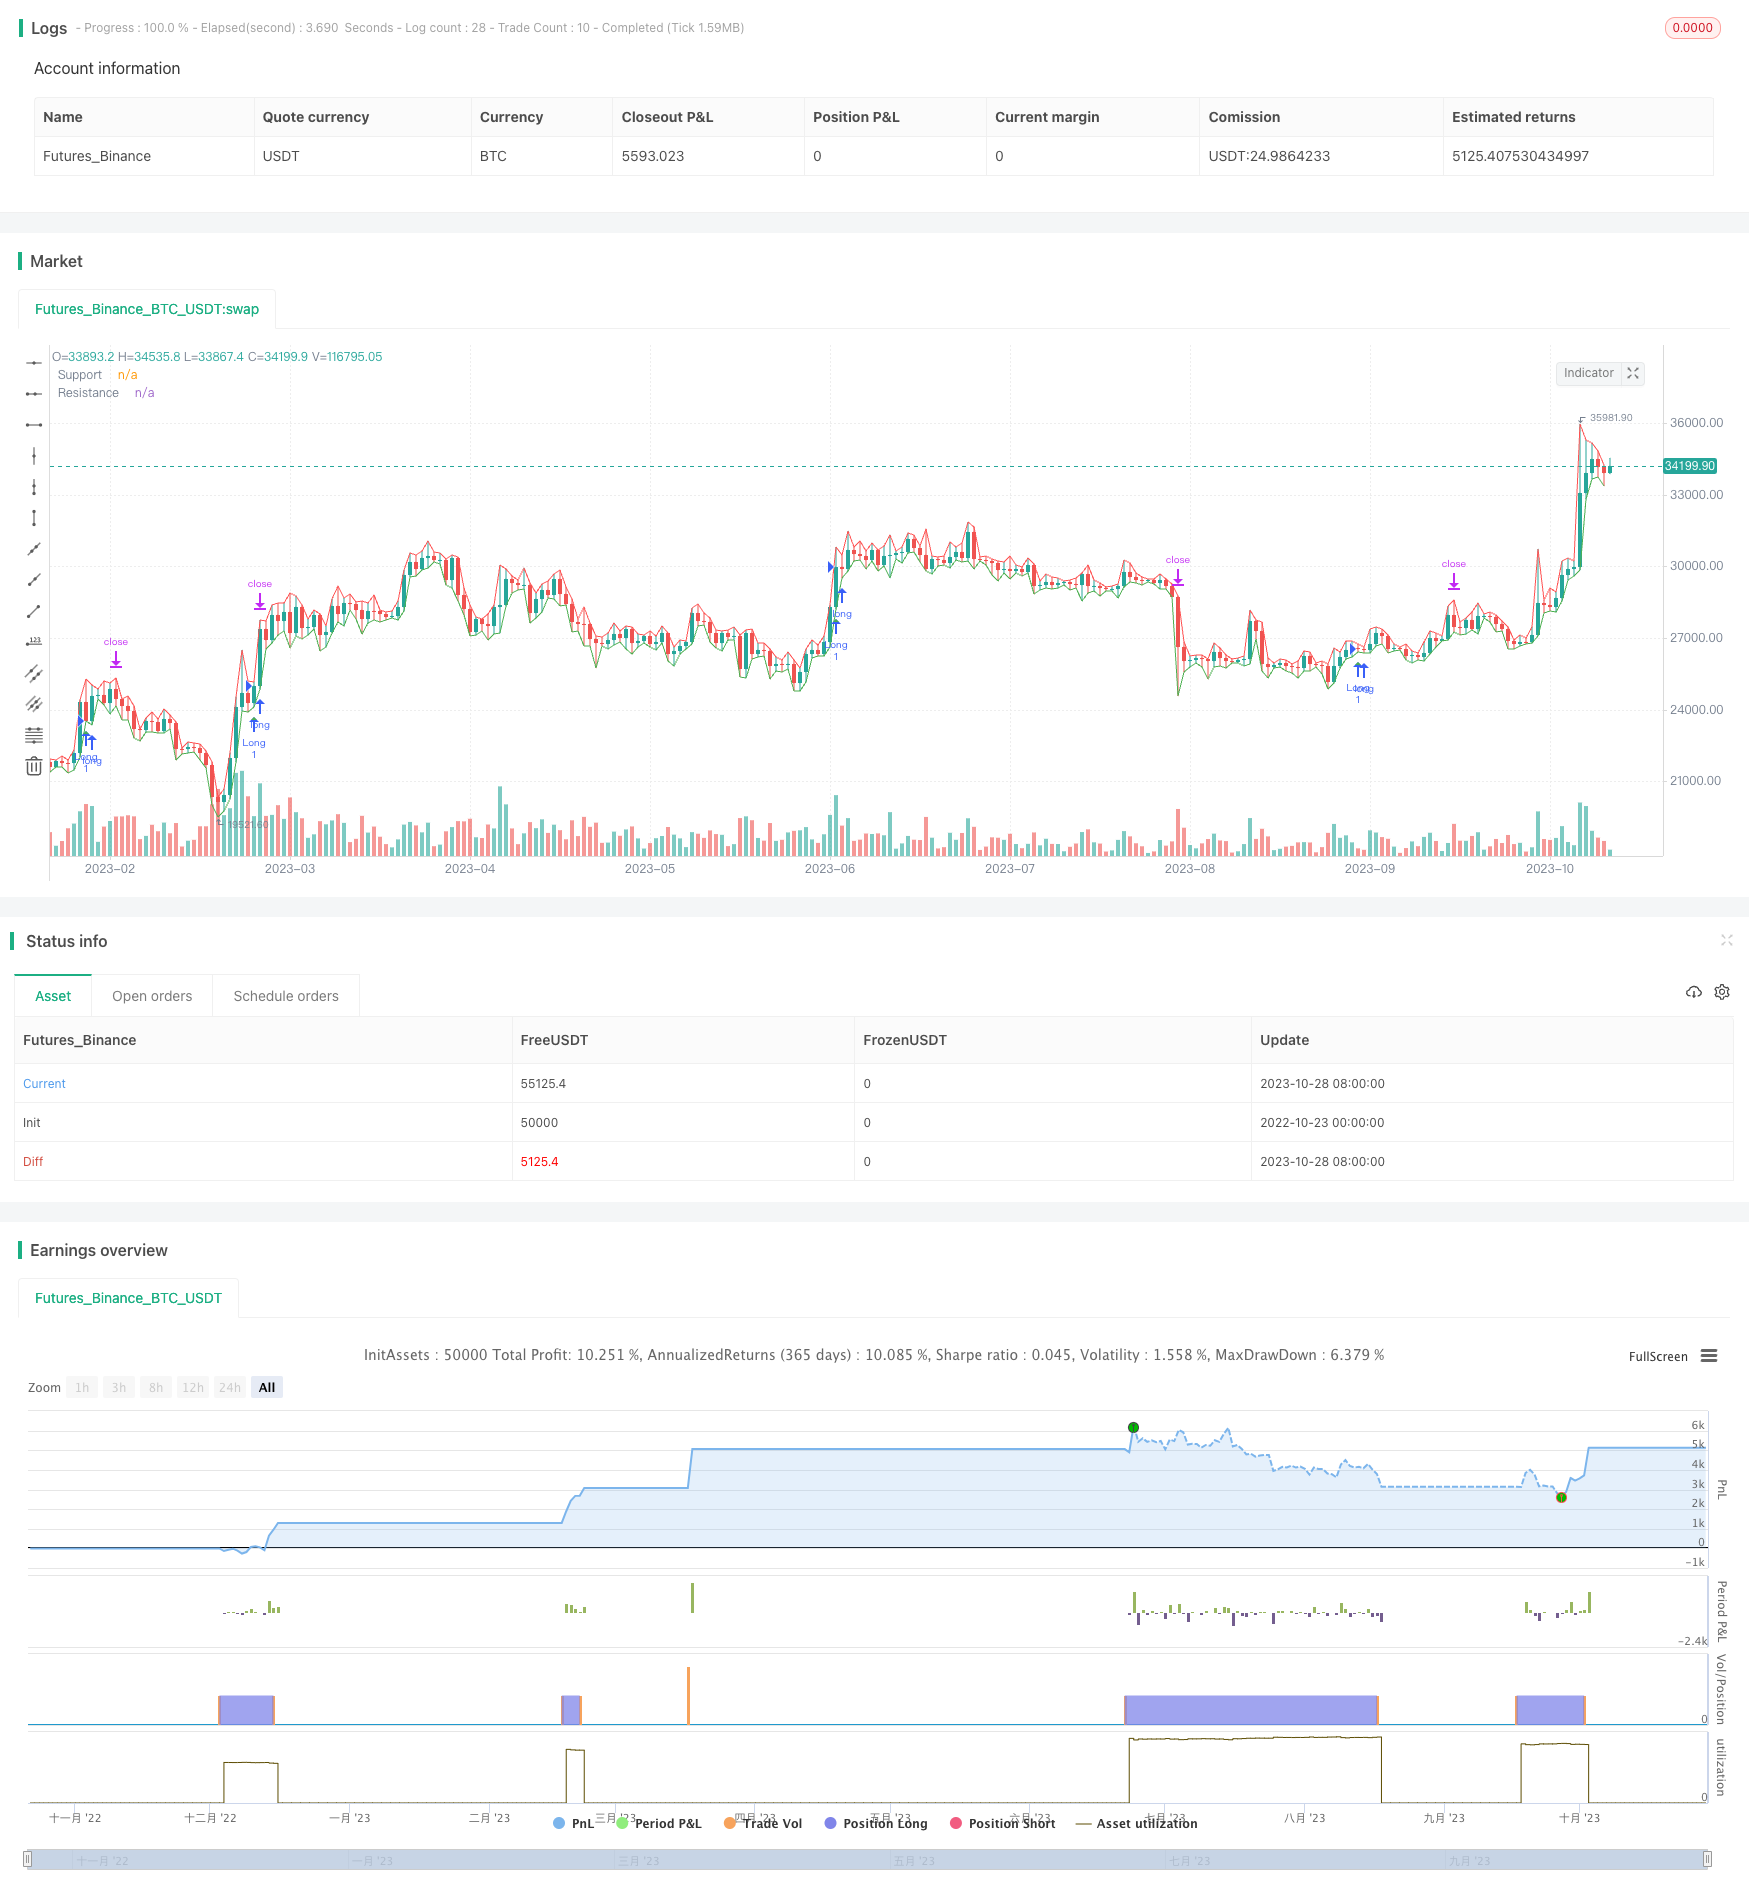
该策略结合了价格行情的支撑阻力分析和MACD指标的趋势分析,实现了在趋势方向获得确定的前提下,在关键支撑阻力区域进行低风险的长线操作,旨在获得超过止损价位的较大获利。
|
|
|
|
## 策略原理
|
|
|
|
1. 通过“Price Action - Support & Resistance by DGT”指标识别关键的支撑和阻力水平。该指标基于价格行情判断支撑和阻力。这些水平通常都是价格反转或盘整的潜在区域。
|
|
|
|
2. 在指标识别出支撑阻力水平后,需要通过分析历史价格在这些水平附近的行为,来确认支撑阻力的强度。多次触碰或反弹的水平,说明该水平的支撑或阻力效果更强。
|
|
|
|
3. 添加MACD指标,由MACD线和Signal线以及两者之间差值的Histogram组成。MACD可识别趋势和潜在趋势反转。当MACD线上穿Signal线且Histogram为正值时,表示有望形成牛市趋势。
|
|
|
|
4. 结合“Price Action - Support & Resistance by DGT”指标识别的支撑位和MACD指标识别的趋势方向,可以找出交易机会:
|
|
|
|
- 多头交易:当价格接近强支撑位时,如果MACD线上穿Signal线且Histogram为正值,说明有望形成多头趋势,在支撑位附近做多,并设置止损线在支撑位之下。
|
|
|
|
5. 进入交易后,可根据入场点与最近重要的支撑或阻力之间的距离来设置盈利目标;同时采用移动止损或其他风险管理技术来锁定盈利和控制风险。
|
|
|
|
## 优势分析
|
|
|
|
- 利用支撑阻力识别关键的反转区域,这样的交易区域风险较低
|
|
- 借助MACD判断趋势方向,只在趋势确定时交易,避免逆势交易
|
|
- 在支撑位附近做多,止损离场,风险可控
|
|
- 目标利润较大,有望取得超过止损的较大盈利
|
|
- 支撑阻力和MACD可相互验证信号,增加成功率
|
|
|
|
## 风险分析
|
|
|
|
- 支撑阻力可能被突破,需要关注突破后的价格动向
|
|
- MACD具有滞后性,可能出现误判
|
|
- 止损被触发的概率存在,需要控制单笔止损风险
|
|
- 需要关注利润目标是否设置合理,过于激进可能无法实现
|
|
- 需要关注和验证各个信号,避免出现错误信号
|
|
|
|
对应风险的解决方案:
|
|
|
|
- 对支撑阻力的突破需要及时止损或反向交易
|
|
- MACD判信号时需审慎,与价格结合使用,验证信号
|
|
- 单笔止损风险控制在1-2%,避免过大亏损
|
|
- 利润目标设置不要过于激进,可适当调小
|
|
- 必须等待各信号确认之后再入场,切忌盲目跟单
|
|
|
|
## 优化方向
|
|
|
|
- 可以测试不同参数下的支撑阻力指标效果
|
|
- 可以优化MACD的参数,获得更精确的MACD信号
|
|
- 可以加入其它指标进行信号验证,例如RSI等
|
|
- 可以研究比如布林带等指标来设置止损和止盈
|
|
- 可以加入自动移动止损来更好地锁定利润
|
|
- 可以针对不同品种进行参数优化
|
|
- 可以通过回测来优化具体的止损止盈参数
|
|
|
|
## 总结
|
|
|
|
该策略整合了趋势判断和关键区域交易方法。在获得确定的趋势方向后,选择风险可控的支撑区域进行低风险操作,以期获得超过止损的较大盈利。这种长线操作模式,只需要较少的交易次数就有望取得稳定收益。当然,任何策略都无法完全避免亏损,需要采取严格的风险管理措施来控制损失。通过不断优化参数和信号验证方法,该策略可以获得更高的胜率。总体来说,该策略提供了一种较为稳健的长线交易思路。
|
|
|
|
||
|
|
|
|
|
|
## Overview
|
|
|
|
This strategy combines the support & resistance analysis of price action and the trend analysis of the MACD indicator. It aims to make low-risk long trades at key support & resistance levels when the trend direction is determined, in order to gain profits exceeding the stop loss.
|
|
|
|
## Strategy Logic
|
|
|
|
1. Identify key support and resistance levels using the "Price Action - Support & Resistance by DGT" indicator. This indicator determines support and resistance based on price action. These levels are often potential areas where price may reverse or consolidate.
|
|
|
|
2. After the indicator identifies support and resistance levels, confirm the strength of these levels by analyzing historical price behavior around them. Multiple touches or bounces from the same level indicates stronger support or resistance.
|
|
|
|
3. Add the MACD indicator, consisting of the MACD line, signal line and histogram representing the difference between the two lines. MACD helps identify momentum and potential trend reversals. When the MACD line crosses above the signal line and the histogram turns positive, it suggests bullish momentum is likely to form.
|
|
|
|
4. Combine the support identified by the "Price Action - Support & Resistance by DGT" indicator and the trend direction by the MACD indicator to spot trading opportunities:
|
|
|
|
- Bullish Trade: When price approaches a strong support level, if the MACD line crosses above the signal line and the histogram turns positive, it indicates potential bullish trend. Go long near the support with a stop loss below the support level.
|
|
|
|
5. After entering a trade, set the profit target based on the distance between entry price and the nearest significant support/resistance. Also use trailing stop loss or other risk management techniques to lock in profit and limit loss.
|
|
|
|
## Advantage Analysis
|
|
|
|
- Trade at key reversal areas identified by support & resistance, which carries lower risk
|
|
- Only trade when the trend is determined by MACD, avoiding trading against the trend
|
|
- Long near support with stop loss, risk is controlled
|
|
- Profit target is large, with potential to gain profit exceeding the stop loss
|
|
- Support & resistance and MACD can validate each other's signals, increasing success rate
|
|
|
|
## Risk Analysis
|
|
|
|
- Support & resistance levels may be broken, need to watch price action after breakout
|
|
- MACD has lagging effect, may generate false signals
|
|
- Stop loss being triggered is probable, need to control loss per trade
|
|
- Need to ensure reasonable profit target, overly aggressive target may not be achieved
|
|
- Need to verify all signals to avoid false signals
|
|
|
|
Solutions to the risks:
|
|
|
|
- Breakout of support & resistance needs timely stop loss or reverse trade
|
|
- Be cautious when MACD signals, use price action to verify
|
|
- Keep single stop loss at 1-2% to avoid large loss
|
|
- Don't set profit target too aggressively, can lower it appropriately
|
|
- Only enter trade after all signals are confirmed, avoid blindly following
|
|
|
|
## Optimization Directions
|
|
|
|
- Test support & resistance indicator with different parameters
|
|
- Optimize MACD parameters for more accurate signals
|
|
- Add other indicators like RSI for signal verification
|
|
- Study bands like Bollinger Bands for stop loss and take profit
|
|
- Add trailing stop loss to better lock in profits
|
|
- Optimize parameters for different products
|
|
- Backtest to find optimal stop loss and take profit levels
|
|
|
|
## Summary
|
|
|
|
This strategy integrates trend determination and key zone trading. It makes low-risk trades at key support levels when the trend is determined, in order to gain profits exceeding the stop loss. With this long-term trading mode, stable profits can be achieved with relatively few trades. Of course, no strategy can completely avoid losses. Strict risk management is needed to control the downside. Through continuous optimization of parameters and signal verification methods, this strategy can achieve higher win rate. In conclusion, it provides a robust framework for long-term trading.
|
|
|
|
[/trans]
|
|
|
|
> Strategy Arguments
|
|
|
|
|
|
|
|
|Argument|Default|Description|
|
|
|----|----|----|
|
|
|v_input_1|100|Support Level Strength|
|
|
|v_input_2|100|Resistance Level Strength|
|
|
|v_input_3|5|Stop Loss Level (%)|
|
|
|v_input_4|7.5|Take Profit Level (%)|
|
|
|
|
|
|
> Source (PineScript)
|
|
|
|
``` pinescript
|
|
/*backtest
|
|
start: 2022-10-23 00:00:00
|
|
end: 2023-10-29 00:00:00
|
|
period: 1d
|
|
basePeriod: 1h
|
|
exchanges: [{"eid":"Futures_Binance","currency":"BTC_USDT"}]
|
|
*/
|
|
|
|
//@version=4
|
|
strategy("Price Action - Support & Resistance + MACD Strategy", overlay=true)
|
|
|
|
// Price Action - Support & Resistance
|
|
supportLevel = input(100, title="Support Level Strength", minval=1)
|
|
resistanceLevel = input(100, title="Resistance Level Strength", minval=1)
|
|
|
|
var supportPrice = 0.0
|
|
var resistancePrice = 0.0
|
|
|
|
if low <= supportPrice or barstate.islast
|
|
supportPrice := low
|
|
if high >= resistancePrice or barstate.islast
|
|
resistancePrice := high
|
|
|
|
plot(supportPrice, color=color.green, linewidth=1, title="Support")
|
|
plot(resistancePrice, color=color.red, linewidth=1, title="Resistance")
|
|
|
|
// MACD Indicator
|
|
[macdLine, signalLine, _] = macd(close, 26, 100, 9)
|
|
macdHistogram = macdLine - signalLine
|
|
|
|
// Bullish Trade Setup
|
|
bullishSetup = crossover(macdLine, signalLine) and macdHistogram > 0 and close > supportPrice
|
|
plotshape(bullishSetup, color=color.green, title="Bullish Setup", style=shape.triangleup, location=location.belowbar)
|
|
|
|
// Stop Loss and Take Profit Levels
|
|
stopLossLevel = input(5, title="Stop Loss Level (%)", minval=0.1, step=0.1)
|
|
takeProfitLevel = input(7.5, title="Take Profit Level (%)", minval=0.1, step=0.1)
|
|
|
|
// Execute Long Trades
|
|
if bullishSetup
|
|
stopLossPrice = close * (1 - stopLossLevel / 100)
|
|
takeProfitPrice = close * (1 + takeProfitLevel / 100)
|
|
strategy.entry("Long", strategy.long)
|
|
strategy.exit("Exit", "Long", stop=stopLossPrice, limit=takeProfitPrice)
|
|
|
|
```
|
|
|
|
> Detail
|
|
|
|
https://www.fmz.com/strategy/430589
|
|
|
|
> Last Modified
|
|
|
|
2023-10-30 16:18:34
|