
197 lines
7.1 KiB
Markdown
197 lines
7.1 KiB
Markdown
|
|
> Name
|
|
|
|
康纳双均线RSI反转交易策略Connors-Dual-Moving-Average-RSI-Reversal-Trading-Strategy
|
|
|
|
> Author
|
|
|
|
ChaoZhang
|
|
|
|
> Strategy Description
|
|
|
|
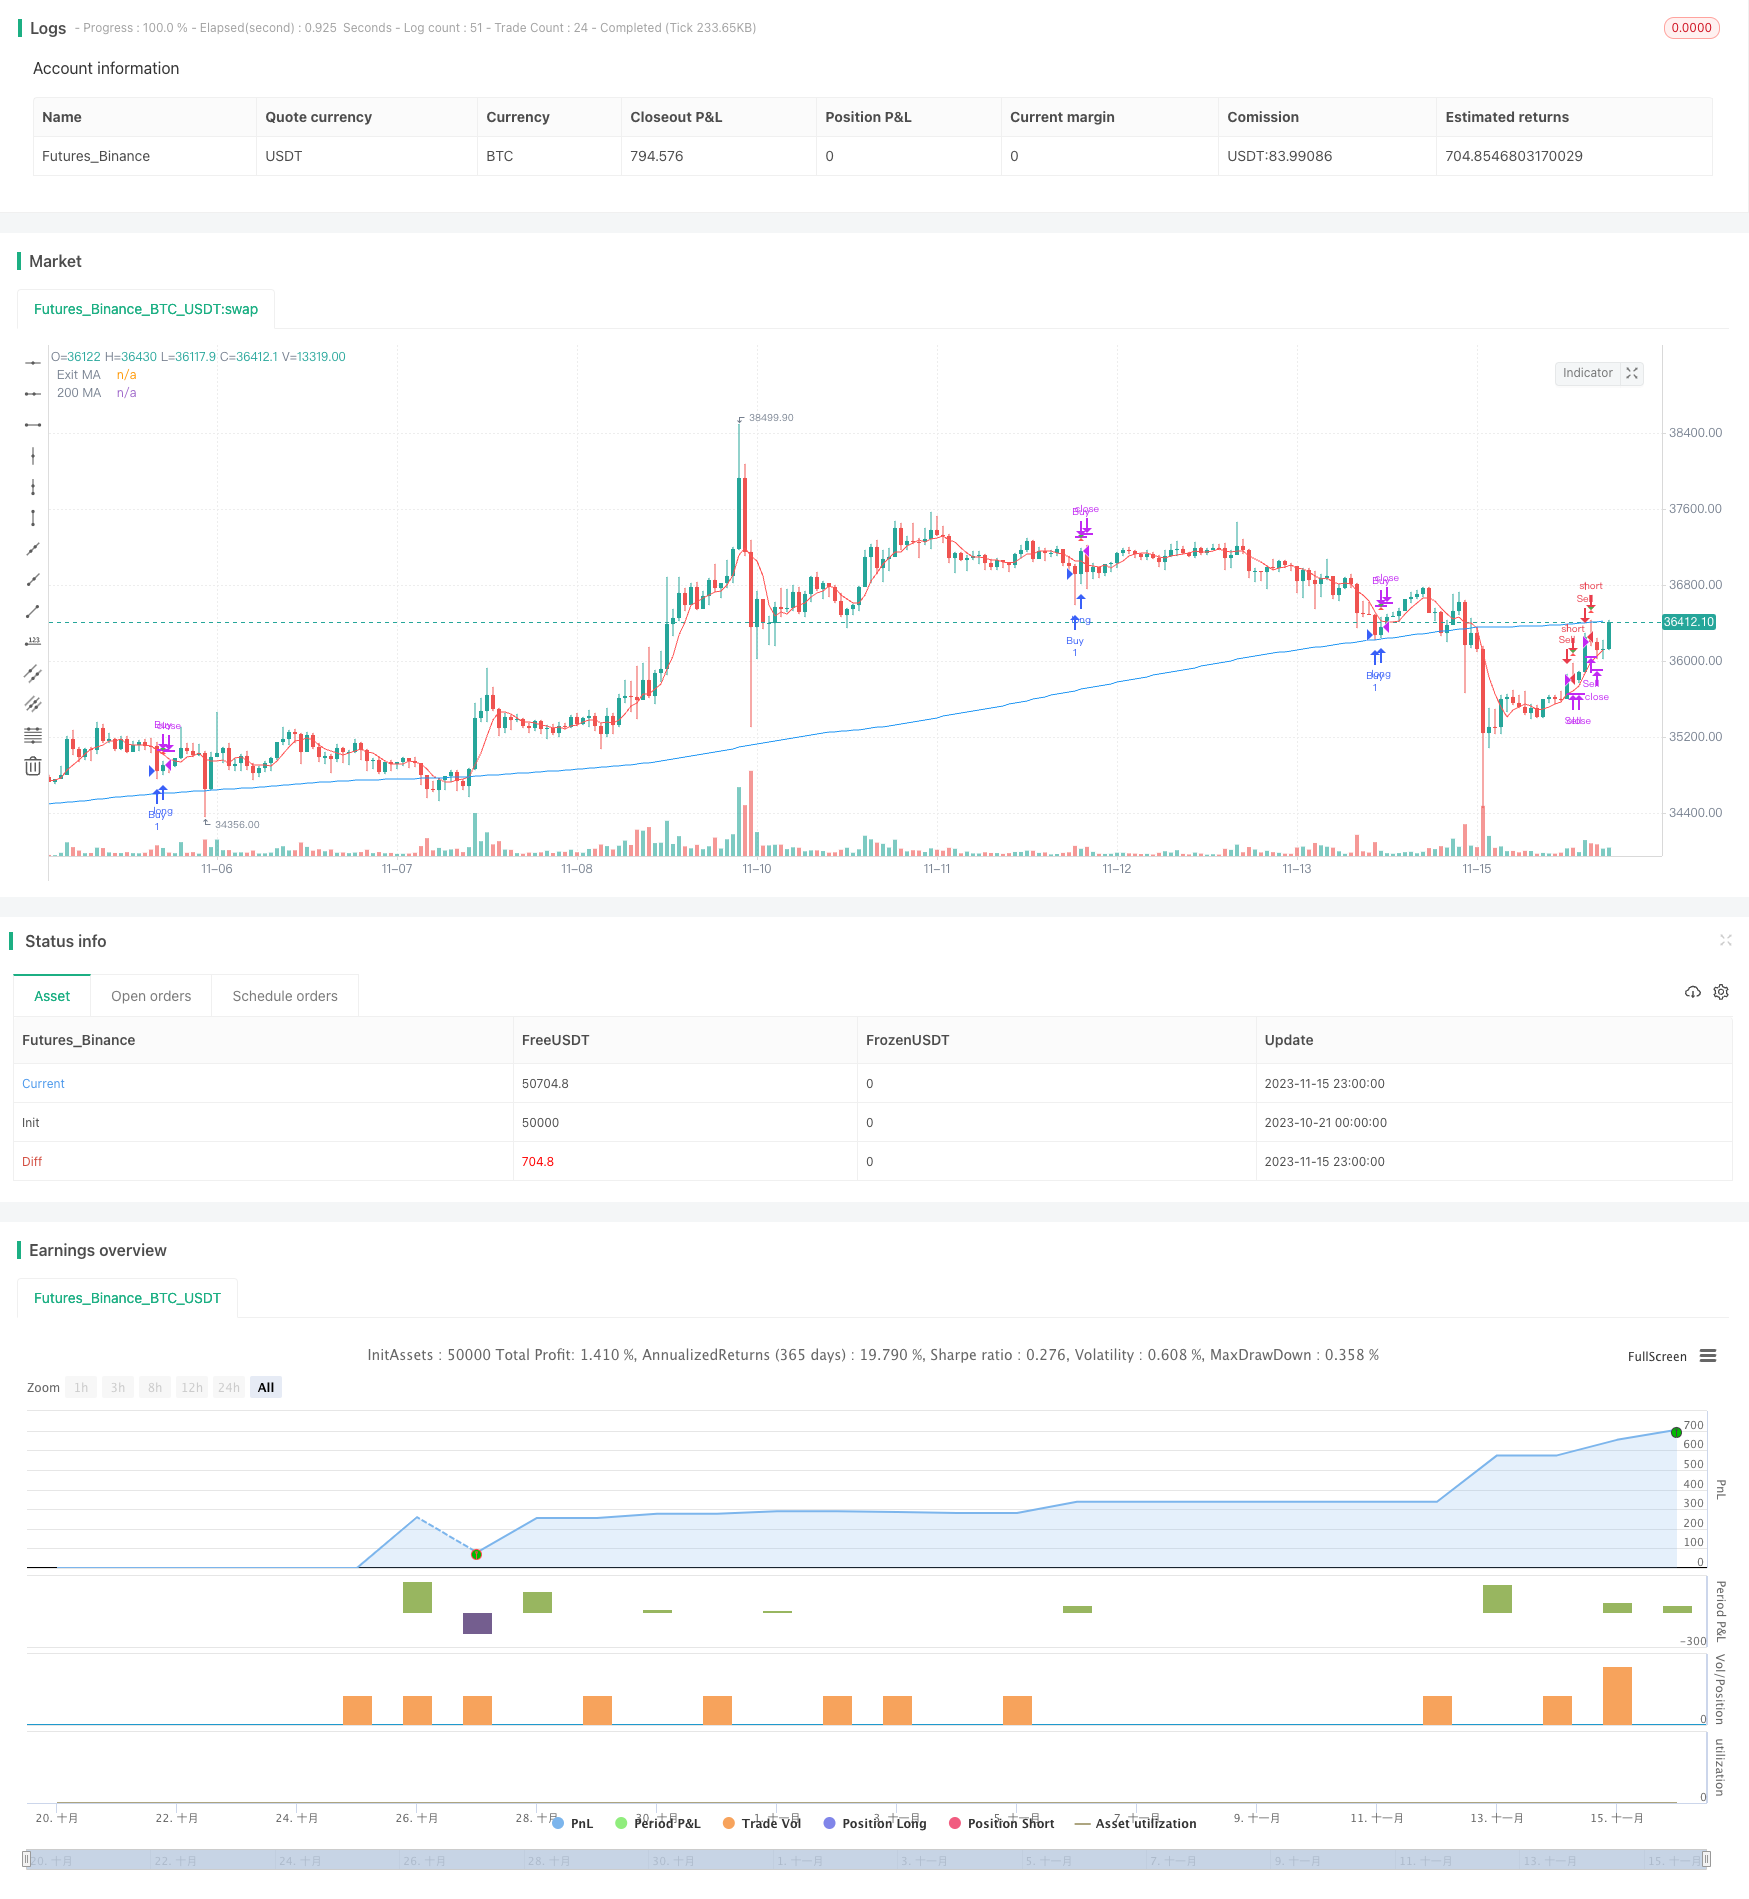
|
|
|
|
[trans]
|
|
|
|
## 概述
|
|
|
|
康纳双均线RSI反转交易策略结合了相对强弱指数(RSI)和双均线,以寻找高概率的反转交易机会。当短期和长期趋势反向时,该策略判断行情即将发生转折并建立头寸。
|
|
|
|
## 策略原理
|
|
|
|
该策略同时利用RSI和双均线判断市场趋势。首先,计算2周期的RSI,判断短期趋势反转。其次,计算200周期移动平均线,判断长期趋势方向。当短期RSI从超买/超卖区域反弹,并且与长期趋势反向时,说明行情即将发生反转,建立交易头寸。
|
|
|
|
入场信号:RSI小于超卖区域(默认5)并且短期价格高于长期价格时做多;RSI大于超买区域(默认95)并且短期价格低于长期价格时做空。
|
|
|
|
出场信号:5周期短期均线发出持仓方向与入场相反的信号时离场;或止损(默认损失3%)。
|
|
|
|
## 策略优势分析
|
|
|
|
该策略结合多种指标判断市场结构,可以提高交易的准确率。具体优势如下:
|
|
|
|
1. 利用RSI判断短期反转点,移动平均线过滤反转信号的可靠性
|
|
2. 双均线形成强势筛选,避免钝化
|
|
3. 短期均线再次验证反转信号,确保高概率出场
|
|
4. 风险控制到位,有止损机制
|
|
|
|
## 策略风险分析
|
|
|
|
该策略也存在一些风险:
|
|
|
|
1. 市场剧烈波动时,RSI指标发出错误信号的概率较大
|
|
2. 多指标组合判断,参数优化比较复杂
|
|
3. 反转不一定成功,需要及时止损
|
|
|
|
## 策略优化方向
|
|
|
|
该策略可以从以下几个方面进行优化:
|
|
|
|
1. 优化RSI参数,寻找最佳反转参数组合
|
|
2. 测试不同类型的移动平均线参数
|
|
3. 优化止损策略,寻找最佳止损点
|
|
4. 增加趋势判断指标,避免反转失败
|
|
|
|
## 总结
|
|
|
|
康纳双均线RSI反转交易策略,通过RSI反转信号与双均线过滤,在高概率位置捕捉行情反转。该策略利用多种指标判断,可以有效提高交易策略的稳定性。下一步,通过参数优化和风险控制的改进,有望进一步扩大策略优势,获取更高的交易效率。
|
|
|
|
||
|
|
|
|
## Overview
|
|
|
|
The Connors Dual Moving Average RSI Reversal Trading Strategy combines the Relative Strength Index (RSI) and dual moving averages to identify high probability reversal trading opportunities. When the short-term and long-term trends reverse direction, this strategy judges that the market is about to turn and establishes a position.
|
|
|
|
## Strategy Principle
|
|
|
|
This strategy utilizes both RSI and dual moving averages to determine market trends. First, it calculates a 2-period RSI to judge short-term trend reversals. Second, it calculates a 200-period moving average to determine the long-term trend direction. When the short-term RSI bounces back from the overbought/oversold area and moves against the long-term trend, it signals that the market is about to reverse and a trading position can be established.
|
|
|
|
Entry signals: Go long when RSI is below the oversold area (default 5) and short-term price is above long-term price; Go short when RSI is above the overbought area (default 95) and short-term price is below long-term price.
|
|
|
|
Exit signals: Exit when the 5-period short-term moving average gives a signal opposite to the entry direction; or stop loss (default 3% loss).
|
|
|
|
## Advantage Analysis
|
|
|
|
This strategy combines multiple indicators to judge market structure and can improve the accuracy of trading. Specific advantages are:
|
|
|
|
1. Use RSI to determine short-term reversal points and moving averages to filter the reliability of reversal signals
|
|
2. Dual moving averages form a strong filtering to avoid delays
|
|
3. The short-term moving average re-verifies the reversal signal to ensure high probability exits
|
|
4. Good risk control with stop loss mechanism
|
|
|
|
## Risk Analysis
|
|
|
|
There are some risks with this strategy:
|
|
|
|
1. RSI indicators are more likely to give incorrect signals during violent market fluctuations
|
|
2. Multi-indicator combo judgments make parameter optimization complex
|
|
3. Reversals are not guaranteed to succeed, timely stop losses are needed
|
|
|
|
## Optimization Directions
|
|
|
|
This strategy can be optimized in several aspects:
|
|
|
|
1. Optimize RSI parameters to find the best reversal parameter combination
|
|
2. Test different types of moving average parameters
|
|
3. Optimize stop loss strategies to find the best stop loss points
|
|
4. Add trend judgment indicators to avoid failed reversals
|
|
|
|
## Conclusion
|
|
|
|
The Connors Dual Moving Average RSI Reversal Trading Strategy captures market reversals at high probability positions by filtering RSI reversal signals with dual moving averages. This strategy utilizes multiple indicators to improve stability. Next, through parameter optimization and risk control improvements, it has the potential to further expand the advantages of the strategy and achieve higher trading efficiency.
|
|
|
|
[/trans]
|
|
|
|
> Strategy Arguments
|
|
|
|
|
|
|
|
|Argument|Default|Description|
|
|
|----|----|----|
|
|
|v_input_1|2|RSI Length|
|
|
|v_input_2|200|MA Length|
|
|
|v_input_3|5|Exit MA Length|
|
|
|v_input_4|95|Overbought Threshold|
|
|
|v_input_5|5|Oversold Threshold|
|
|
|v_input_6|3|Stop Loss Percentage|
|
|
|
|
|
|
> Source (PineScript)
|
|
|
|
``` pinescript
|
|
/*backtest
|
|
start: 2023-10-21 00:00:00
|
|
end: 2023-11-16 00:00:00
|
|
period: 1h
|
|
basePeriod: 15m
|
|
exchanges: [{"eid":"Futures_Binance","currency":"BTC_USDT"}]
|
|
*/
|
|
|
|
//@version=5
|
|
strategy("Connors RSI-MA Strategy", overlay=true)
|
|
|
|
// Strategy parameters
|
|
rsiLength = input(2, title="RSI Length")
|
|
maLength = input(200, title="MA Length")
|
|
exitMaLength = input(5, title="Exit MA Length")
|
|
overboughtThreshold = input(95, title="Overbought Threshold")
|
|
oversoldThreshold = input(5, title="Oversold Threshold")
|
|
stopLossPercentage = input(3, title="Stop Loss Percentage")
|
|
|
|
// 2-period RSI
|
|
rsi2 = ta.rsi(close, rsiLength)
|
|
|
|
// 200-period MA
|
|
ma200 = ta.sma(close, maLength)
|
|
|
|
// 5-period MA for exit signals
|
|
ma5_exit = ta.sma(close, exitMaLength)
|
|
|
|
// Positive trend condition
|
|
positiveTrend = close > ma200
|
|
|
|
// Negative trend condition
|
|
negativeTrend = close < ma200
|
|
|
|
// Buy and sell conditions
|
|
buyCondition = rsi2 < oversoldThreshold and positiveTrend
|
|
sellCondition = rsi2 > overboughtThreshold and negativeTrend
|
|
|
|
// Exit conditions
|
|
exitLongCondition = close > ma5_exit
|
|
exitShortCondition = close < ma5_exit
|
|
|
|
// Stop Loss
|
|
stopLossLevelLong = strategy.position_avg_price * (1 - stopLossPercentage / 100)
|
|
stopLossLevelShort = strategy.position_avg_price * (1 + stopLossPercentage / 100)
|
|
|
|
// Strategy logic
|
|
if (buyCondition)
|
|
strategy.entry("Buy", strategy.long)
|
|
|
|
if (sellCondition)
|
|
strategy.entry("Sell", strategy.short)
|
|
|
|
if (exitLongCondition or close >= stopLossLevelLong)
|
|
strategy.close("Buy")
|
|
|
|
if (exitShortCondition or close <= stopLossLevelShort)
|
|
strategy.close("Sell")
|
|
|
|
// Plotting
|
|
plot(ma200, title="200 MA", color=color.blue)
|
|
plot(ma5_exit, title="Exit MA", color=color.red)
|
|
|
|
// Plot stop loss levels
|
|
plotshape(series=stopLossLevelLong, title="Long Stop Loss", color=color.green, style=shape.triangledown, size=size.small)
|
|
plotshape(series=stopLossLevelShort, title="Short Stop Loss", color=color.red, style=shape.triangleup, size=size.small)
|
|
|
|
```
|
|
|
|
> Detail
|
|
|
|
https://www.fmz.com/strategy/432780
|
|
|
|
> Last Modified
|
|
|
|
2023-11-21 14:20:43
|