
18 KiB
Name
幽灵移动平均与动量结合的斐波那契目标价与止损策略-Ghost-Moving-Average-with-Momentum-Integration-and-Fibonacci-Target-Stop-Loss-Strategy
Author
ianzeng123
Strategy Description
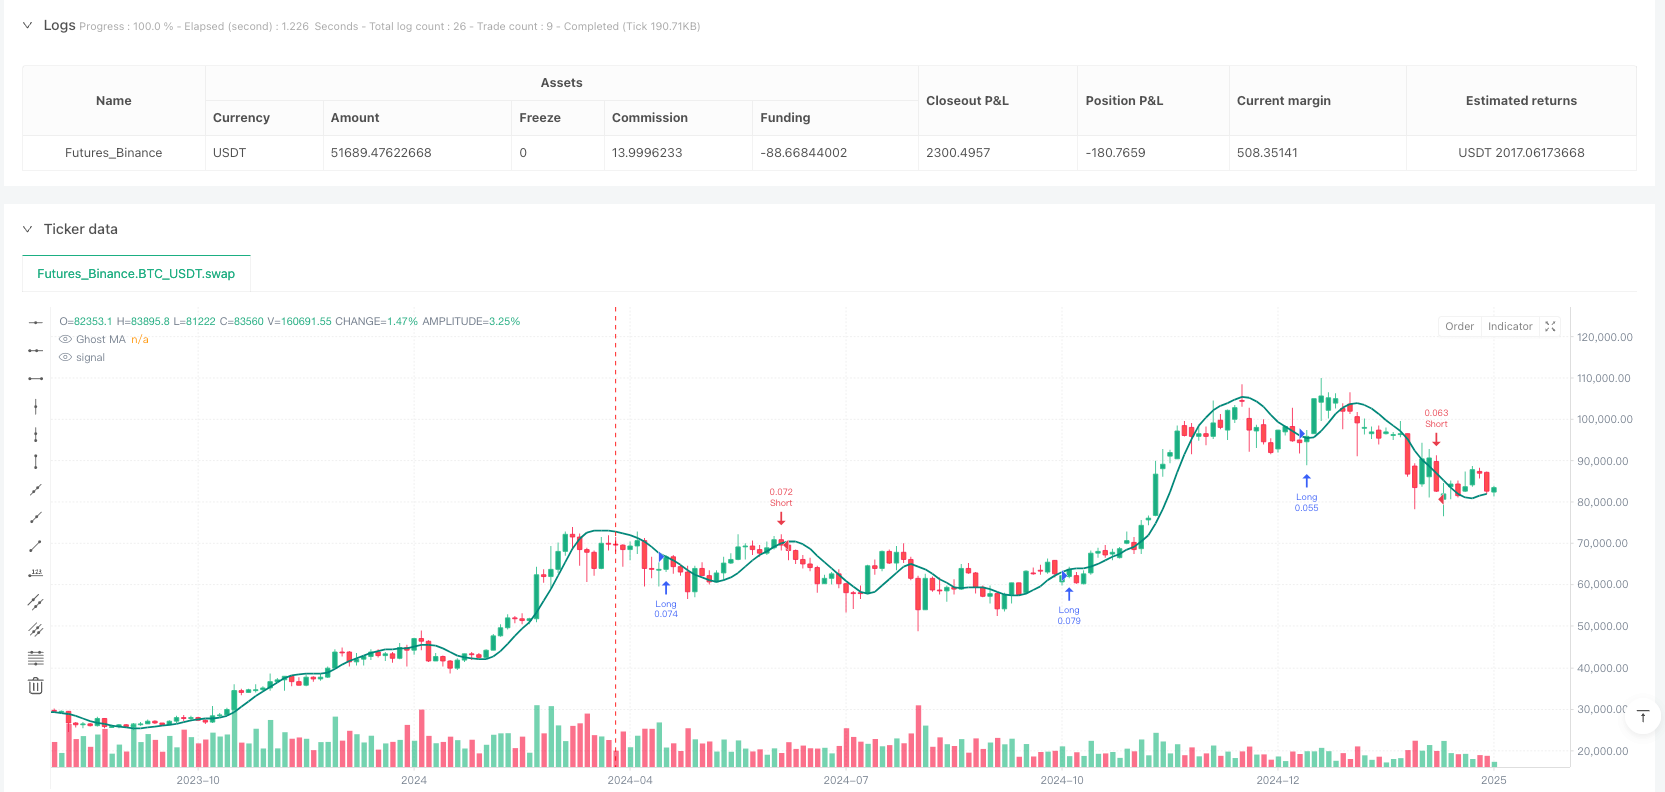
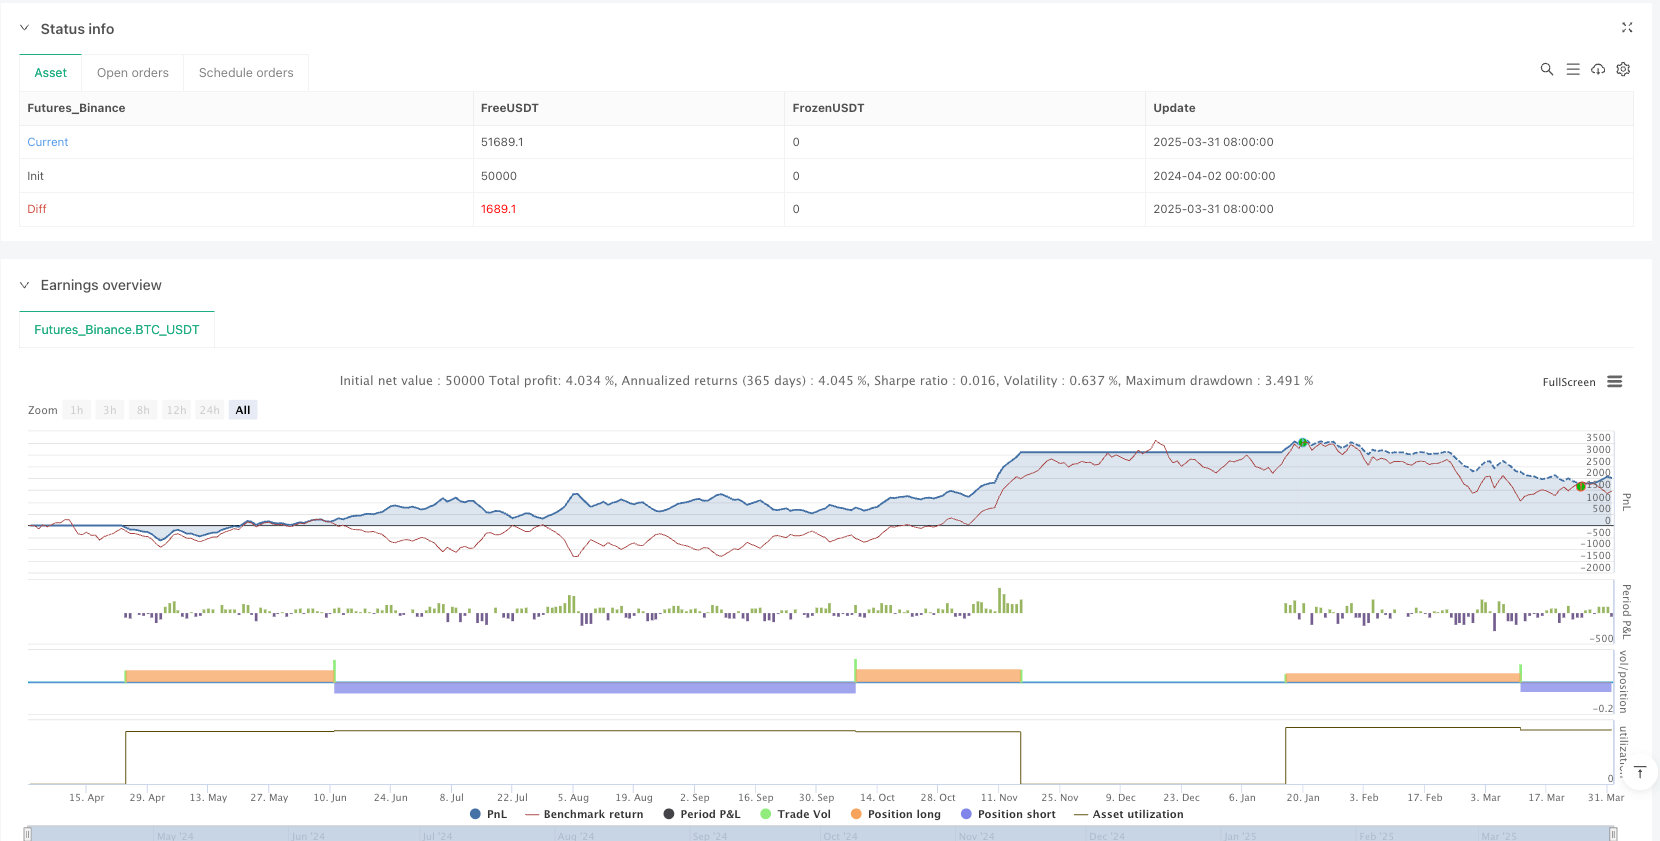
[trans]
概述
本策略是一个结合了多种技术指标的综合性交易系统,主要融合了幽灵移动平均线(Ghost Moving Average)、动量指标(Momentum Oscillator)以及斐波那契回调水平来构建一个完整的交易框架。该策略通过幽灵移动平均线来确定市场趋势方向,结合动量指标来验证信号强度,并利用斐波那契水平自动设置目标价和止损点,以实现风险管理的自动化。此外,策略还包含一个实时交易仪表盘,为交易者提供关键信息和决策支持。
策略原理
-
幽灵移动平均线(GMA): 这是策略的核心组件,它通过特殊的计算方式提供比传统移动平均线更灵敏的价格趋势信号。具体计算公式为:先计算两倍的半周期加权移动平均(WMA)减去全周期加权移动平均,然后对结果再次应用一个周期为原始周期平方根的加权移动平均。
-
动量指标: 策略使用当前价格与特定周期前价格的差值来衡量市场动量,并通过指数移动平均(EMA)进行平滑处理,再通过标准差进行归一化,使得动量信号更加稳定可靠。
-
趋势判断: 通过计算幽灵移动平均线的斜率来确定市场趋势,斜率为正表示上升趋势,斜率为负表示下降趋势。
-
斐波那契目标价和止损: 策略基于回溯期内的最高价和最低价计算斐波那契水平,分别使用0.618、1.0和1.618作为目标价,0.382作为止损水平。
-
入场条件:
- 多头入场:价格向上穿越幽灵移动平均线且归一化动量为正
- 空头入场:价格向下穿越幽灵移动平均线且归一化动量为负
策略优势
-
趋势和动量的双重确认: 通过结合幽灵移动平均线和动量指标,策略能够有效减少假信号,只有当两个指标同时满足条件时才会触发交易信号。
-
自适应的风险管理: 使用斐波那契水平自动设置目标价和止损点,这种方法根据市场波动性自动调整,在不同市场条件下提供适当的风险回报比。
-
视觉化交易仪表盘: 策略内置的交易仪表盘直观显示趋势状态、交易信号、入场理由以及目标价和止损等关键信息,帮助交易者快速做出决策。
-
适应市场波动: 幽灵移动平均线相比传统移动平均线对价格变化更为敏感,能更快地识别趋势转变,减少滞后性。
-
明确的交易规则: 策略提供了清晰的入场和出场条件,减少了主观判断,有助于交易者保持纪律性。
策略风险
-
过度交易风险: 在震荡市场中,价格可能频繁穿越幽灵移动平均线,导致过多的交易信号。解决方法是增加额外的过滤条件,如只在明确的趋势中交易或增加信号确认周期。
-
止损设置风险: 固定比例的斐波那契止损可能在波动性极高的市场中不够灵活,可能导致止损过于宽松或过于紧密。建议根据不同市场条件动态调整斐波那契比例。
-
参数敏感性: 策略性能高度依赖于多个参数的设置,如GMA长度、动量周期等,不同市场和时间框架可能需要不同的参数组合。建议进行回测以找到最优参数。
-
趋势判断延迟: 尽管幽灵移动平均线比传统移动平均线更灵敏,但仍然存在一定的延迟,可能在趋势初期错过部分机会。可以考虑结合更短周期的指标来提前发现趋势变化。
-
回测偏差: 策略的斐波那契水平基于历史数据计算,可能存在向前偏差(forward bias)。在实际交易中应注意这一点,并考虑使用更动态的方法计算关键水平。
策略优化方向
-
自适应参数优化: 目前策略使用固定的参数设置,可以引入自适应机制,根据市场波动性自动调整GMA长度和动量周期,使策略在不同市场条件下保持最佳性能。
-
多时间框架分析: 增加对多个时间框架的分析,只有当多个时间框架的信号一致时才执行交易,这可以显著提高信号质量和成功率。
-
动态止盈目标: 当前策略使用固定的斐波那契水平作为目标价,可以考虑根据市场波动性动态调整目标价,或实施追踪止盈策略,以最大化盈利潜力。
-
交易量分析: 结合交易量指标来验证价格趋势的有效性,只在价格和交易量同时确认的情况下进行交易,可以减少假突破信号。
-
机器学习增强: 引入机器学习算法来优化入场条件和参数选择,通过历史数据训练模型,预测最佳的交易机会和风险管理策略。
-
情绪指标整合: 加入市场情绪指标,如波动率指数或其他衍生指标,以在极端市场条件下调整策略行为,提高风险管理能力。
总结
幽灵移动平均与动量结合的斐波那契目标价与止损策略是一个全面的技术分析交易系统,通过结合多种指标和技术,提供了一个系统化的交易框架。该策略的核心优势在于趋势和动量的双重确认机制,以及基于市场波动性的自适应风险管理系统。虽然存在一些固有风险,如参数敏感性和潜在的过度交易,但通过提出的优化方向可以显著提高策略的稳健性和有效性。对于寻求系统化交易方法的投资者来说,这是一个值得考虑的策略框架,特别是在明确趋势市场中。通过持续优化和适应不同市场条件,该策略可以成为交易者工具箱中的有力工具。 ||
Overview
This strategy is a comprehensive trading system that combines multiple technical indicators, primarily integrating the Ghost Moving Average (GMA), Momentum Oscillator, and Fibonacci retracement levels to construct a complete trading framework. The strategy uses the Ghost Moving Average to determine market trend direction, combines the momentum indicator to verify signal strength, and employs Fibonacci levels to automatically set target prices and stop-loss points, achieving automated risk management. Additionally, the strategy includes a real-time trading dashboard that provides traders with key information and decision support.
Strategy Principles
-
Ghost Moving Average (GMA): This is the core component of the strategy, providing more sensitive price trend signals than traditional moving averages through a special calculation method. The specific formula is: first calculate twice the half-period weighted moving average (WMA) minus the full-period weighted moving average, then apply another weighted moving average with a period equal to the square root of the original period to the result.
-
Momentum Indicator: The strategy uses the difference between the current price and the price from a specific period ago to measure market momentum, smooths it using an exponential moving average (EMA), and then normalizes it through standard deviation, making the momentum signal more stable and reliable.
-
Trend Determination: Market trend is determined by calculating the slope of the Ghost Moving Average, with a positive slope indicating an uptrend and a negative slope indicating a downtrend.
-
Fibonacci Target Prices and Stop-Loss: The strategy calculates Fibonacci levels based on the highest and lowest prices within the lookback period, using 0.618, 1.0, and 1.618 as target prices, and 0.382 as the stop-loss level.
-
Entry Conditions:
- Long Entry: Price crosses above the Ghost Moving Average and normalized momentum is positive
- Short Entry: Price crosses below the Ghost Moving Average and normalized momentum is negative
Strategy Advantages
-
Dual Confirmation of Trend and Momentum: By combining the Ghost Moving Average and momentum indicator, the strategy can effectively reduce false signals, triggering trading signals only when both indicators meet their conditions simultaneously.
-
Adaptive Risk Management: Using Fibonacci levels to automatically set target prices and stop-loss points, this method adjusts automatically based on market volatility, providing appropriate risk-reward ratios under different market conditions.
-
Visual Trading Dashboard: The built-in trading dashboard intuitively displays key information such as trend status, trading signals, entry reasons, target prices, and stop-loss levels, helping traders make quick decisions.
-
Adaptation to Market Volatility: The Ghost Moving Average is more sensitive to price changes compared to traditional moving averages, enabling faster identification of trend changes and reducing lag.
-
Clear Trading Rules: The strategy provides clear entry and exit conditions, reducing subjective judgment and helping traders maintain discipline.
Strategy Risks
-
Overtrading Risk: In oscillating markets, prices may frequently cross the Ghost Moving Average, leading to excessive trading signals. The solution is to add additional filtering conditions, such as only trading in clear trends or increasing signal confirmation periods.
-
Stop-Loss Setting Risk: Fixed-ratio Fibonacci stop-losses may not be flexible enough in highly volatile markets, potentially leading to stop-losses that are either too loose or too tight. It is recommended to dynamically adjust Fibonacci ratios based on different market conditions.
-
Parameter Sensitivity: Strategy performance is highly dependent on the setting of multiple parameters, such as GMA length and momentum period. Different markets and timeframes may require different parameter combinations. Backtesting is recommended to find optimal parameters.
-
Trend Determination Delay: Although the Ghost Moving Average is more sensitive than traditional moving averages, there is still some delay, potentially missing some opportunities in the early stages of a trend. Consider combining shorter-period indicators to detect trend changes earlier.
-
Backtesting Bias: The strategy's Fibonacci levels are calculated based on historical data, potentially introducing forward bias. This should be noted in actual trading, and more dynamic methods for calculating key levels should be considered.
Strategy Optimization Directions
-
Adaptive Parameter Optimization: Currently, the strategy uses fixed parameter settings. An adaptive mechanism could be introduced to automatically adjust GMA length and momentum period based on market volatility, maintaining optimal performance under different market conditions.
-
Multi-Timeframe Analysis: Add analysis of multiple timeframes, executing trades only when signals across multiple timeframes are consistent, which can significantly improve signal quality and success rate.
-
Dynamic Take-Profit Targets: The current strategy uses fixed Fibonacci levels as target prices. Consider dynamically adjusting target prices based on market volatility or implementing a trailing stop-profit strategy to maximize profit potential.
-
Volume Analysis: Incorporate volume indicators to verify the validity of price trends, trading only when both price and volume confirm, which can reduce false breakout signals.
-
Machine Learning Enhancement: Introduce machine learning algorithms to optimize entry conditions and parameter selection, training models through historical data to predict the best trading opportunities and risk management strategies.
-
Sentiment Indicator Integration: Add market sentiment indicators, such as volatility indices or other derivative indicators, to adjust strategy behavior under extreme market conditions and enhance risk management capabilities.
Summary
The Ghost Moving Average with Momentum Integration and Fibonacci Target/Stop-Loss Strategy is a comprehensive technical analysis trading system that provides a systematic trading framework by combining multiple indicators and techniques. The core advantages of this strategy lie in the dual confirmation mechanism of trend and momentum, as well as the adaptive risk management system based on market volatility. Although there are some inherent risks, such as parameter sensitivity and potential overtrading, the proposed optimization directions can significantly improve the strategy's robustness and effectiveness. For investors seeking systematic trading methods, this is a worthwhile strategy framework, especially in clearly trending markets. Through continuous optimization and adaptation to different market conditions, this strategy can become a powerful tool in a trader's toolkit.[/trans]
Source (PineScript)
/*backtest
start: 2024-04-02 00:00:00
end: 2025-04-01 00:00:00
period: 3d
basePeriod: 3d
exchanges: [{"eid":"Futures_Binance","currency":"BTC_USDT"}]
*/

//@version=5
strategy("Ghost MA + Momentum + Fib TP/SL + Dashboard", overlay=true, default_qty_type=strategy.percent_of_equity, default_qty_value=10)

// === INPUTS ===
src = input(close, "Source")
gmaLength = input.int(20, "GMA Length")
momentumLength = input.int(20, "Momentum Length")
momentumSmoothing = input.int(10, "Momentum Smoothing")
swingLookback = input.int(50, "Fibonacci Swing Lookback")

// === GHOST MOVING AVERAGE ===
gma = ta.wma(2 * ta.wma(src, gmaLength / 2) - ta.wma(src, gmaLength), math.round(math.sqrt(gmaLength)))
plot(gma, title="Ghost MA", color=color.teal, linewidth=2)

// === MOMENTUM GHOST OSCILLATOR ===
momentum = src - src[momentumLength]
smoothMomentum = ta.ema(momentum, momentumSmoothing)
normalizedMomentum = smoothMomentum / ta.stdev(momentum, momentumLength)

// === MARKET TREND ===
gmaSlope = gma - gma[1]
marketTrend = gmaSlope > 0 ? "UPTREND" : "DOWNTREND"

// === SWING POINTS FOR FIBONACCI ===
highestHigh = ta.highest(high, swingLookback)
lowestLow = ta.lowest(low, swingLookback)
fibRange = highestHigh - lowestLow
entryPrice = close

// === FIBONACCI TP/SL LEVELS ===
tp1_long = entryPrice + (fibRange * 0.618)
tp2_long = entryPrice + (fibRange * 1.0)
tp3_long = entryPrice + (fibRange * 1.618)
sl_long  = entryPrice - (fibRange * 0.382)

tp1_short = entryPrice - (fibRange * 0.618)
tp2_short = entryPrice - (fibRange * 1.0)
tp3_short = entryPrice - (fibRange * 1.618)
sl_short  = entryPrice + (fibRange * 0.382)

// === STRATEGY CONDITIONS ===
longCond = ta.crossover(src, gma) and normalizedMomentum > 0
shortCond = ta.crossunder(src, gma) and normalizedMomentum < 0

if (longCond)
    strategy.entry("Long", strategy.long)
    strategy.exit("TP/SL Long", from_entry="Long", limit=tp1_long, stop=sl_long)

if (shortCond)
    strategy.entry("Short", strategy.short)
    strategy.exit("TP/SL Short", from_entry="Short", limit=tp1_short, stop=sl_short)

// === SIGNAL LABELS ON CHART ===
if (longCond)
    label.new(bar_index, low, "BUY\n" + str.tostring(close, "#.##"), style=label.style_label_up, color=color.green, textcolor=color.white, size=size.small)

if (shortCond)
    label.new(bar_index, high, "SELL\n" + str.tostring(close, "#.##"), style=label.style_label_down, color=color.red, textcolor=color.white, size=size.small)

// === ALERT CONDITIONS ===
alertcondition(longCond, title="Buy Signal", message="Buy Signal Triggered: GMA Cross Up + Momentum Positive")
alertcondition(shortCond, title="Sell Signal", message="Sell Signal Triggered: GMA Cross Down + Momentum Negative")

// === DASHBOARD ===
var table dash = table.new(position.top_right, 1, 8, border_width=1)

if bar_index % 5 == 0
    signal = longCond ? "BUY" : shortCond ? "SELL" : "WAIT"
    reason = longCond ? "GMA↑ & Momentum+" : shortCond ? "GMA↓ & Momentum−" : "No Clear Signal"
    timeframe = timeframe.period

    sigColor = signal == "BUY" ? color.new(color.green, 20) : signal == "SELL" ? color.new(color.red, 20) : color.new(color.gray, 60)
    trendColor = marketTrend == "UPTREND" ? color.new(color.green, 80) : color.new(color.red, 80)

    table.cell(dash, 0, 0, "? GHOST TRADING DASHBOARD", text_color=color.black, bgcolor=color.lime, text_size=size.large)
    table.cell(dash, 0, 1, "Trend: " + marketTrend, text_color=color.black, bgcolor=trendColor, text_size=size.normal)
    table.cell(dash, 0, 2, "Timeframe: " + timeframe, text_color=color.black, bgcolor=color.purple, text_size=size.normal)
    table.cell(dash, 0, 3, "Signal: " + signal + " @ " + str.tostring(close, "#.##"), text_color=color.black, bgcolor=sigColor, text_size=size.normal)
    table.cell(dash, 0, 4, "Reason: " + reason, text_color=color.black, bgcolor=color.new(color.yellow, 60), text_size=size.normal)
    table.cell(dash, 0, 5, signal == "BUY" ? "TP1: " + str.tostring(tp1_long, "#.##") +
                 " | TP2: " + str.tostring(tp2_long, "#.##") +
                 " | TP3: " + str.tostring(tp3_long, "#.##")
                 : signal == "SELL" ? "TP1: " + str.tostring(tp1_short, "#.##") +
                 " | TP2: " + str.tostring(tp2_short, "#.##") +
                 " | TP3: " + str.tostring(tp3_short, "#.##") : "-",
                 text_color=color.black, bgcolor=color.new(color.green, 80), text_size=size.normal)
    table.cell(dash, 0, 6, "Reentry: " + str.tostring(gma, "#.##"), text_color=color.black, bgcolor=color.new(color.orange, 80), text_size=size.normal)
    table.cell(dash, 0, 7, signal == "BUY" ? "SL: " + str.tostring(sl_long, "#.##") : signal == "SELL" ? "SL: " + str.tostring(sl_short, "#.##") : "-", text_color=color.black, bgcolor=color.new(color.red, 70), text_size=size.normal)
Detail
https://www.fmz.com/strategy/489187
Last Modified
2025-04-02 15:33:54