
143 lines
7.5 KiB
Markdown
143 lines
7.5 KiB
Markdown
|
|
> Name
|
|
|
|
年末趋势跟踪动量交易策略60日均线突破-Year-end-Trend-Following-Momentum-Trading-Strategy60-day-MA-Breakout
|
|
|
|
> Author
|
|
|
|
ChaoZhang
|
|
|
|
> Strategy Description
|
|
|
|
|
|
|
|
[trans]
|
|
#### 概述
|
|
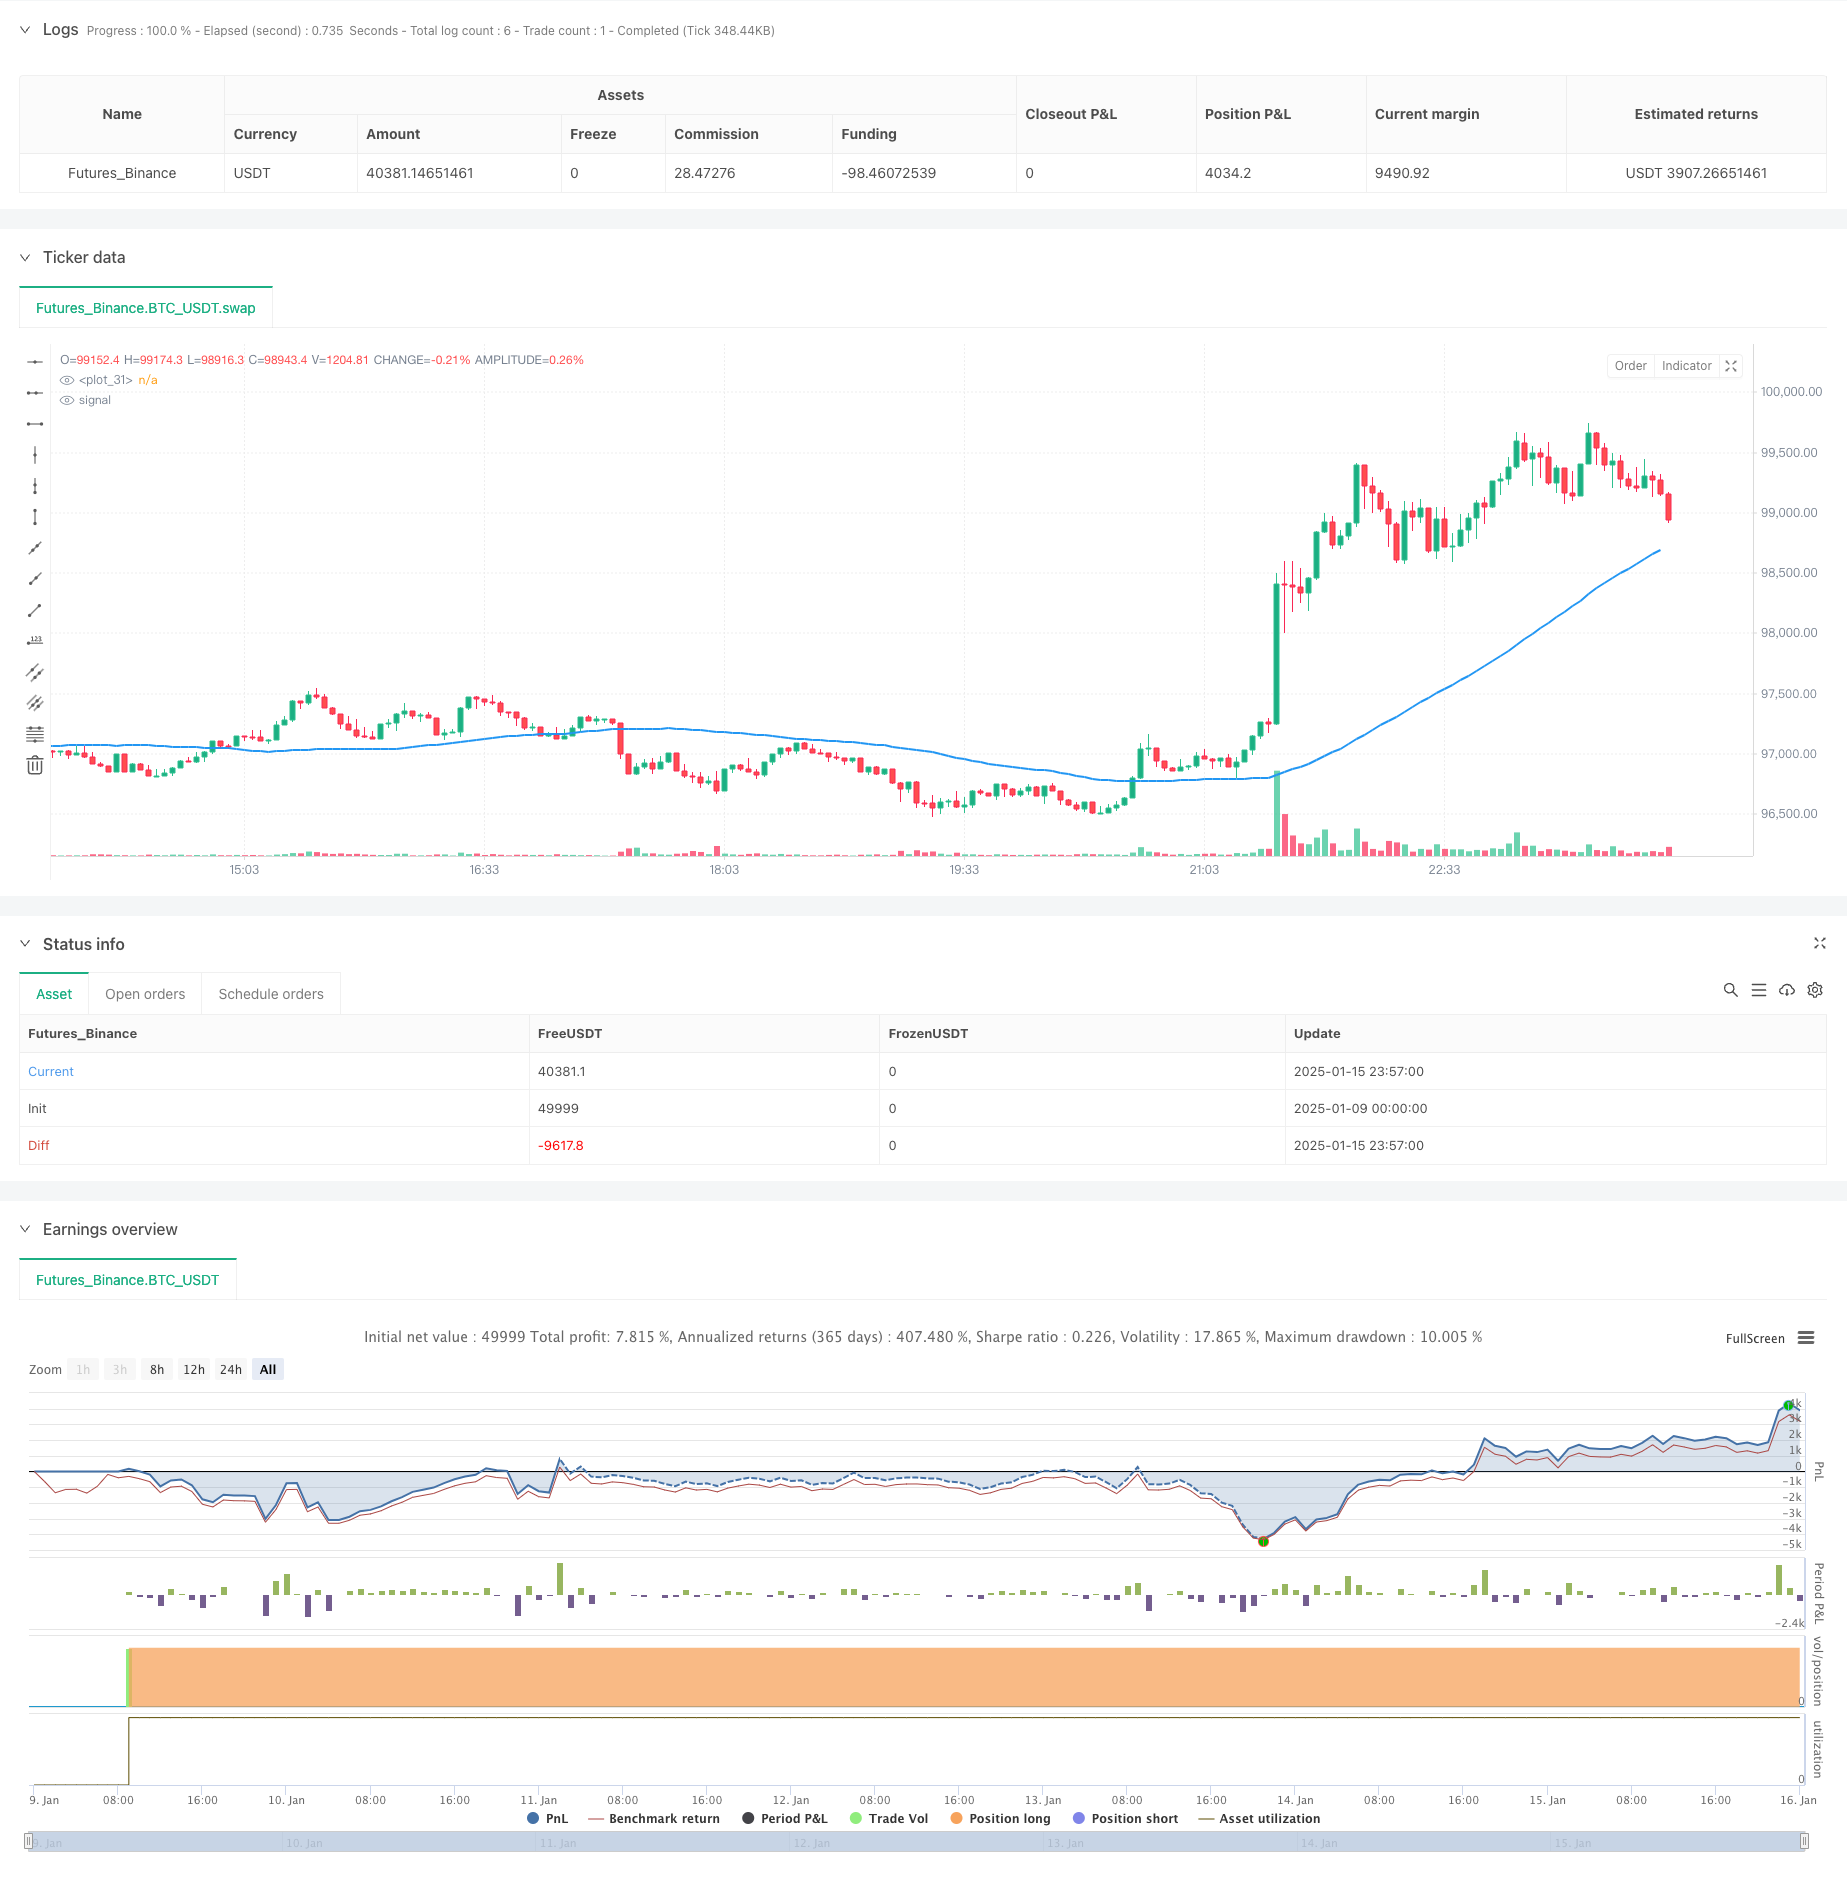
该策略是一个结合了趋势跟踪和时间退出机制的量化交易策略。策略的核心是通过观察价格与60日移动平均线的关系来捕捉市场趋势,同时引入了年末强制平仓机制来控制风险。当收盘价突破60日均线且均线斜率为正时入场做多,并在每年最后一个交易日统一平仓出场。
|
|
|
|
#### 策略原理
|
|
策略主要基于以下几个核心要素:
|
|
1. 趋势判断:使用60日简单移动平均线(SMA)作为中期趋势的判断指标,通过计算14天均线斜率来确认趋势方向。
|
|
2. 入场信号:当价格向上突破60日均线且均线斜率为正时,表明市场可能进入上升趋势,此时产生买入信号。
|
|
3. 出场机制:策略采用固定的时间出场机制,在每年最后一个交易日平掉所有持仓。这种机制可以有效规避跨年度持仓风险。
|
|
4. 交易时间管理:策略内置了交易日期范围控制和交易日判断功能,确保只在有效的交易日进行操作。
|
|
|
|
#### 策略优势
|
|
1. 趋势跟踪性强:通过均线系统可以有效捕捉中长期趋势,充分利用市场趋势性机会。
|
|
2. 风险控制完善:年末强制平仓机制可以有效控制持仓风险,避免跨年度持仓带来的不确定性。
|
|
3. 操作规则明确:入场和出场条件清晰,易于执行和回测验证。
|
|
4. 适应性好:策略参数可调整性强,可以根据不同市场特征进行优化。
|
|
|
|
#### 策略风险
|
|
1. 均线滞后性:移动平均线具有一定滞后性,可能导致入场时机略有延迟。
|
|
2. 震荡市不适用:在横盘震荡市场中,可能产生频繁的假突破信号。
|
|
3. 固定平仓风险:年末强制平仓可能会在好的趋势中提前退出。
|
|
4. 参数敏感性:策略效果对均线周期等参数设置较为敏感。
|
|
|
|
#### 策略优化方向
|
|
1. 增加趋势确认指标:可引入RSI、MACD等指标辅助判断趋势,提高入场准确性。
|
|
2. 优化出场机制:可增加止损止盈条件,不完全依赖时间出场。
|
|
3. 动态调整参数:可根据市场波动率动态调整均线周期。
|
|
4. 增加仓位管理:引入ATR等指标进行仓位控制,提高资金使用效率。
|
|
|
|
#### 总结
|
|
该策略通过结合趋势跟踪和时间管理,构建了一个相对稳健的交易系统。策略逻辑简单明确,易于理解和执行,具有较好的实用性。通过合理的参数优化和风险控制措施的补充,该策略有望在实际交易中取得稳定收益。 ||
|
|
|
|
#### Overview
|
|
This strategy combines trend following with a time-based exit mechanism. The core concept is to capture market trends by monitoring price relationships with the 60-day moving average while incorporating a year-end forced liquidation mechanism for risk control. Long positions are entered when the closing price breaks above the 60-day MA with a positive slope, and all positions are closed on the last trading day of each year.
|
|
|
|
#### Strategy Principles
|
|
The strategy is based on several core elements:
|
|
1. Trend Determination: Uses a 60-day Simple Moving Average (SMA) as a medium-term trend indicator, with a 14-day slope calculation to confirm trend direction.
|
|
2. Entry Signal: Buy signals are generated when price breaks above the 60-day MA with a positive slope, indicating a potential uptrend.
|
|
3. Exit Mechanism: Implements a fixed time-based exit, closing all positions on the last trading day of each year to avoid cross-year position risks.
|
|
4. Trading Time Management: Incorporates date range control and trading day validation to ensure operations only occur on valid trading days.
|
|
|
|
#### Strategy Advantages
|
|
1. Strong Trend Following: Effectively captures medium to long-term trends through the moving average system.
|
|
2. Robust Risk Control: Year-end forced liquidation effectively manages position risk and eliminates cross-year uncertainties.
|
|
3. Clear Operating Rules: Entry and exit conditions are well-defined, facilitating execution and backtesting.
|
|
4. High Adaptability: Strategy parameters can be adjusted to accommodate different market characteristics.
|
|
|
|
#### Strategy Risks
|
|
1. MA Lag: Moving averages have inherent lag, potentially causing delayed entry timing.
|
|
2. Poor Performance in Ranging Markets: May generate frequent false breakout signals in sideways markets.
|
|
3. Fixed Exit Risk: Year-end forced liquidation might lead to premature exit from good trends.
|
|
4. Parameter Sensitivity: Strategy performance is sensitive to MA period and other parameter settings.
|
|
|
|
#### Optimization Directions
|
|
1. Additional Trend Confirmation: Consider incorporating RSI, MACD for improved trend validation.
|
|
2. Enhanced Exit Mechanism: Add stop-loss and take-profit conditions rather than relying solely on time-based exits.
|
|
3. Dynamic Parameter Adjustment: Implement dynamic MA period adjustment based on market volatility.
|
|
4. Position Management: Introduce ATR-based position sizing for improved capital efficiency.
|
|
|
|
#### Summary
|
|
This strategy creates a relatively robust trading system by combining trend following with time management. Its simple and clear logic makes it easy to understand and implement, offering good practical utility. With appropriate parameter optimization and supplementary risk control measures, the strategy shows potential for generating stable returns in real trading conditions.[/trans]
|
|
|
|
|
|
|
|
> Source (PineScript)
|
|
|
|
``` pinescript
|
|
/*backtest
|
|
start: 2025-01-09 00:00:00
|
|
end: 2025-01-16 00:00:00
|
|
period: 3m
|
|
basePeriod: 3m
|
|
exchanges: [{"eid":"Futures_Binance","currency":"BTC_USDT","balance":49999}]
|
|
*/
|
|
|
|
//@version=5
|
|
strategy("Buy above 60-day MA, Sell at year-end", overlay=true, pyramiding=1)
|
|
|
|
// Define inputs for start and end dates
|
|
startDate = input(defval=timestamp("2010-01-01"), title="Start Date")
|
|
endDate = input(defval=timestamp("2024-12-31"), title="End Date")
|
|
|
|
// Define 60-day moving average
|
|
length = input.int(defval=60, title="MA Length", minval=1)
|
|
ma = ta.sma(close, length)
|
|
slope = ta.sma(ma, 14) - ta.sma(ma, 14)[1]
|
|
|
|
// Check if current bar is within the specified date range
|
|
withinDateRange = true
|
|
|
|
// Function to check if a day is a trading day (Monday to Friday)
|
|
isTradingDay(day) => true
|
|
|
|
// Check if current bar is the last trading day of the year
|
|
// Check if current bar is the last trading day of the year
|
|
isLastTradingDayOfYear = false
|
|
yearNow = year(time)
|
|
if (month == 12 and dayofmonth == 31)
|
|
isLastTradingDayOfYear := isTradingDay(time)
|
|
else if (month == 12 and dayofmonth == 30)
|
|
isLastTradingDayOfYear := isTradingDay(time) and not isTradingDay(time + 86400000)
|
|
else if (month == 12 and dayofmonth == 29)
|
|
isLastTradingDayOfYear := isTradingDay(time) and not isTradingDay(time + 86400000) and not isTradingDay(time + 86400000 * 2)
|
|
|
|
// Plot moving average
|
|
plot(ma, color=color.blue, linewidth=2)
|
|
|
|
// Buy when closing price crosses above 60-day MA and up trend
|
|
if (withinDateRange and ta.crossover(close, ma) and slope > 0)
|
|
strategy.entry("Buy", strategy.long)
|
|
|
|
// Sell all positions at the last trading day of the year
|
|
if (isLastTradingDayOfYear)
|
|
strategy.close_all(comment="Sell at year-end")
|
|
|
|
// Plot buy and sell signals
|
|
//plotshape(series=ta.crossover(close, ma), location=location.belowbar, color=color.green, style=shape.labelup, text="Buy")
|
|
//plotshape(series=isLastTradingDayOfYear, location=location.abovebar, color=color.red, style=shape.labeldown, text="Sell")
|
|
|
|
```
|
|
|
|
> Detail
|
|
|
|
https://www.fmz.com/strategy/478705
|
|
|
|
> Last Modified
|
|
|
|
2025-01-17 14:55:20
|