
9.2 KiB
Name
常用移动平均线交叉策略Moving-Average-Crossover-Strategy
Author
ChaoZhang
Strategy Description
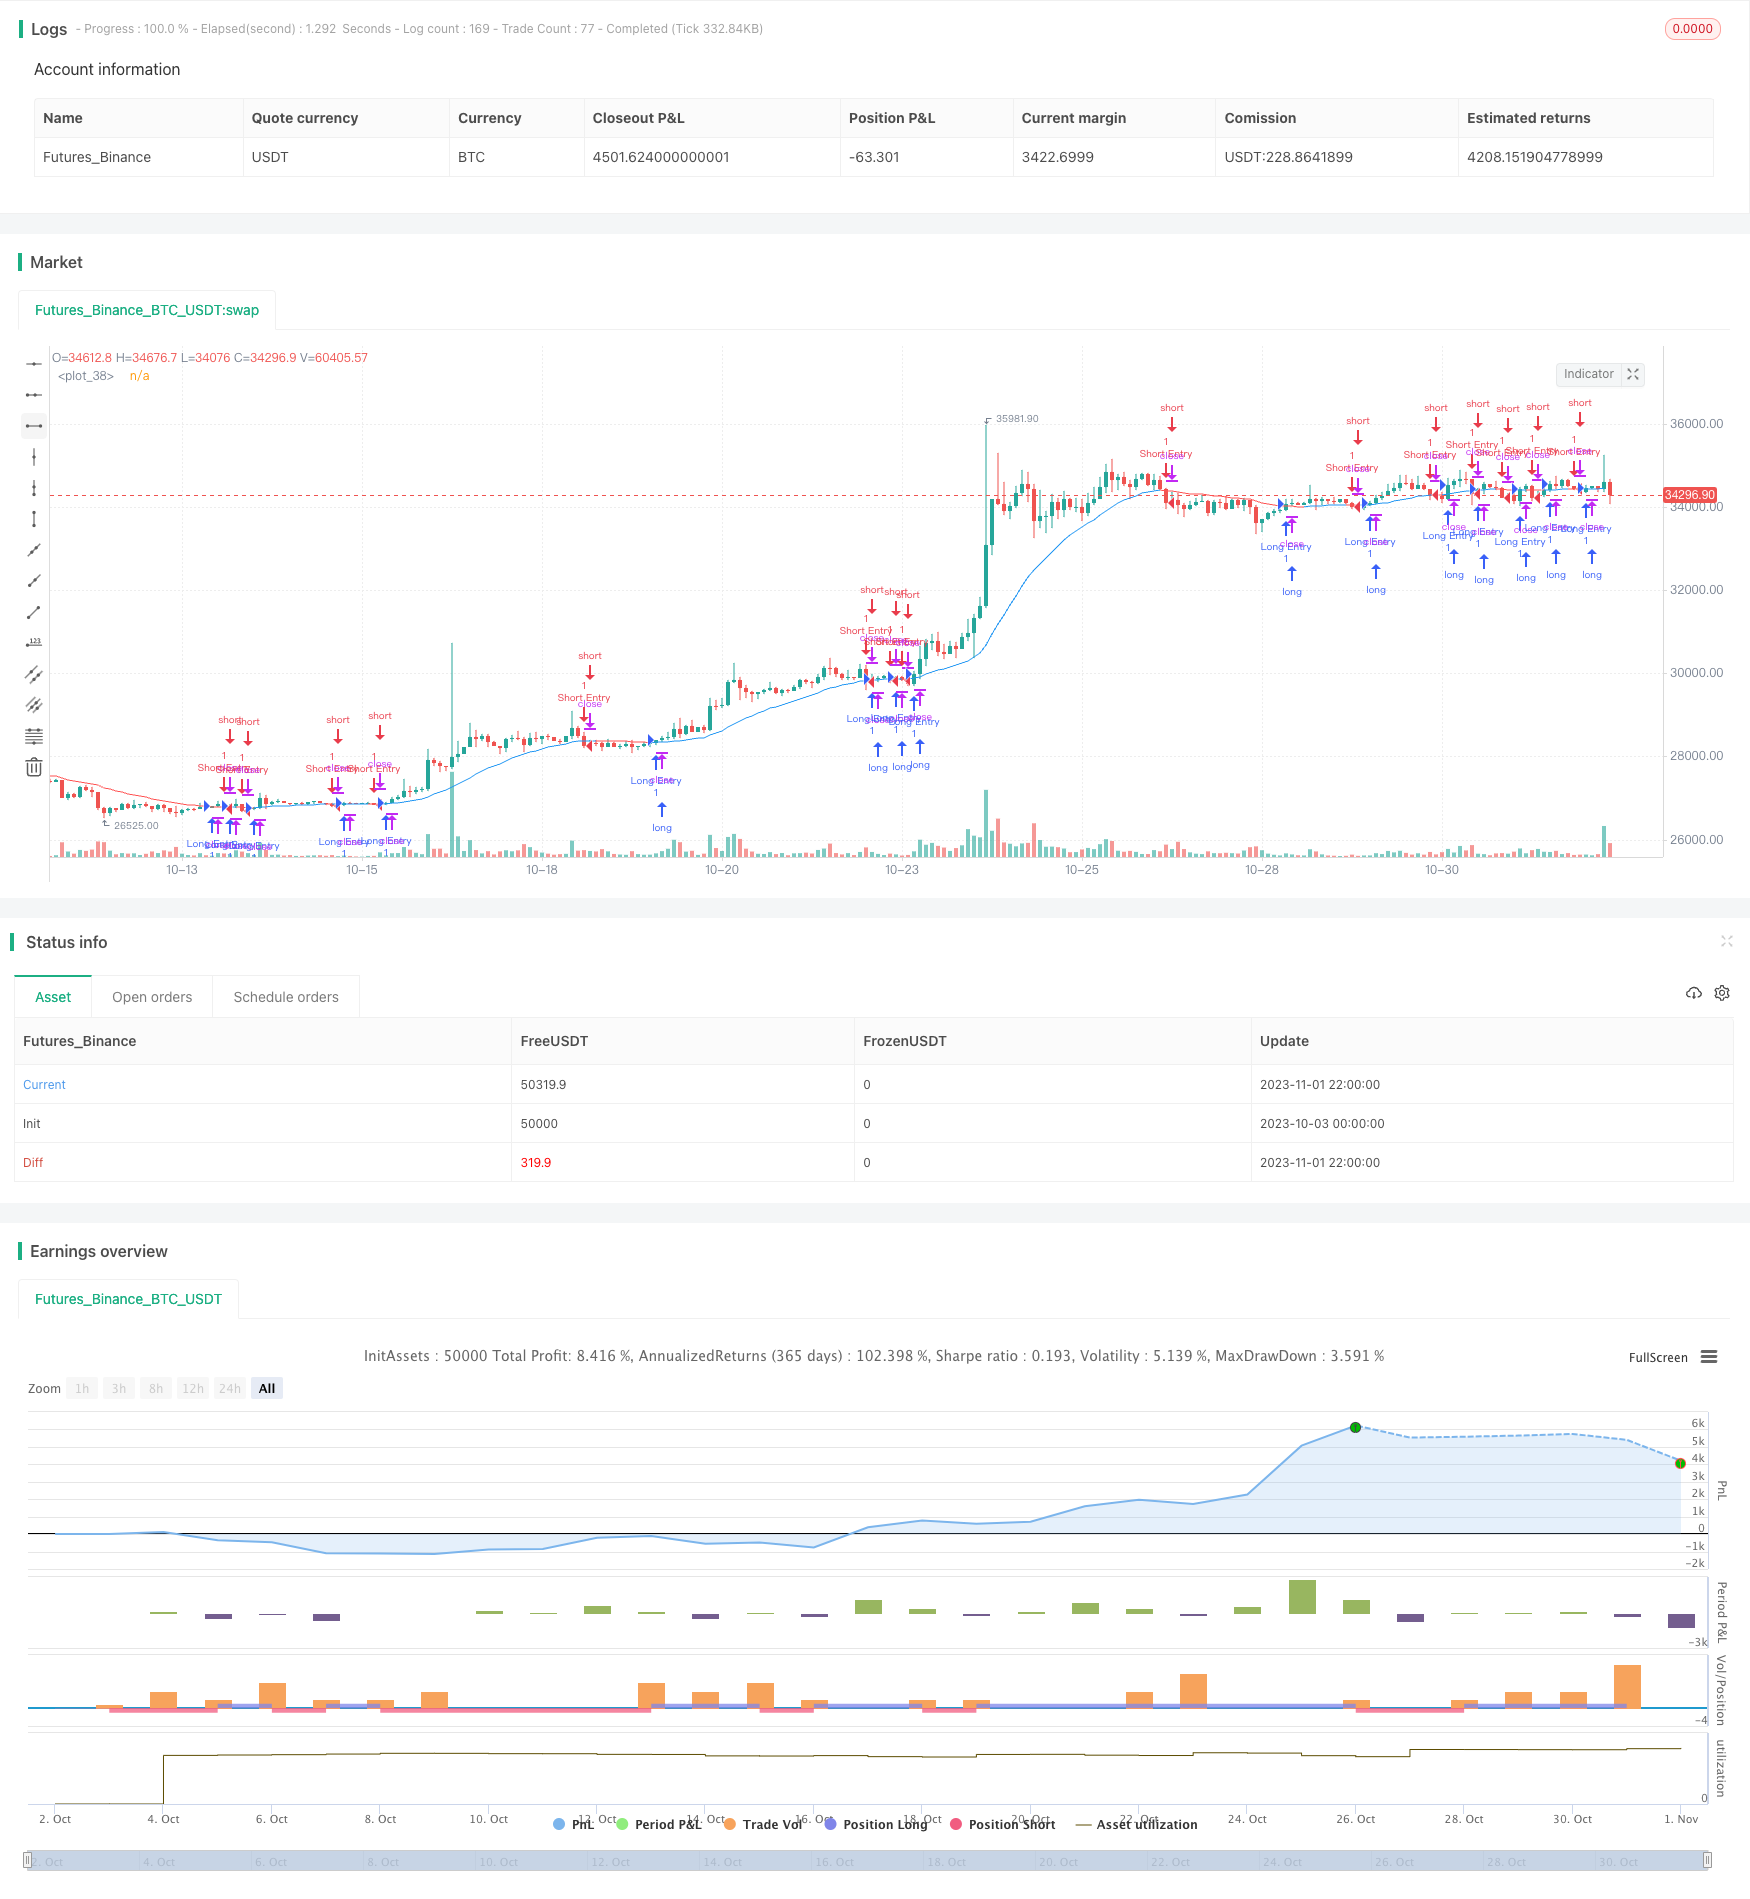 [trans]
概述
移动平均线交叉策略是一种非常经典和常用的技术分析策略。该策略的核心思想是利用不同期间的移动平均线之间的交叉作为买卖信号。当短期移动平均线从下方上穿较长期的移动平均线时,产生买入信号;当短期移动平均线从上方下穿较长期的移动平均线时,产生卖出信号。
策略原理
该策略通过input设置输入移动平均线的类型(SMA,EMA,WMA,RMA)和周期长度,以及回测的时间范围。
在variant函数中计算不同类型的移动平均线。计算出的移动平均线通过ma变量保存。
当close价格上穿ma时,产生买入信号;当close价格下穿ma时,产生卖出信号。
为了设置止损,通过atr计算出14周期的平均真实波动幅度。以穿越点作为参考,向上或向下加减2倍atr作为止损范围。
具体入场和出场逻辑如下:
多头入场:close上穿ma且在回测时间内,止损点为入场点close 多头出场:close下穿 ma减去2倍atr时止损出场,或最高价超过入场点close加2倍atr时止盈出场 空头入场:close下穿ma且在回测时间内,止损点为入场点close 空头出场:close上穿ma加上2倍atr时止损出场,或最低价低于入场点close减2倍atr时止盈出场
策略优势
- 策略思路简单明晰,容易理解和实现
- 应用广泛,适用于不同市场和品种
- 参数设置灵活,移动平均线类型和周期可调
- 采用ATR止损,有助于控制风险
策略风险
- 移动平均线策略容易产生频繁交易和止损,降低盈利空间
- 大幅震荡行情中,移动平均线产生误导信号的可能性较大
- ATR止损范围可能过大或过小,无法达到防止巨额亏损的效果
针对风险,可以从以下方面进行优化:
- 调整移动平均线周期,采用较长周期平均线
- 增加过滤条件,避免在震荡行情中频繁交易
- 优化ATR的参数或采用其他止损方式
- 结合趋势指标判断大趋势,避免逆势操作
策略优化方向
该策略可以从以下几个方面进行优化:
- 增加过滤条件,如交易量,波动率等,避免非理性突破
- 采用自适应ATR止损方式,让止损范围随市场波动率变化
- 结合 Stoch,RSI等指标进行多因子验证,提高信号质量
- 增加趋势判断,避免逆势操作
- 采用时间EXIT,避免长期兑现亏损
- 优化移动平均线周期参数,寻找最佳参数组合
总结
移动平均线交叉策略是一个非常典型和常用的技术分析策略。该策略核心思路简单,容易实现,适用于各个市场,是量化交易的入门策略之一。但该策略也存在一些问题,如产生频繁信号,容易止损等。通过适当优化,可以大大提高该策略的实盘表现。总体来说,移动平均线交叉策略提供了一个非常好的策略开发框架,是量化交易策略学习的基石。
||
Overview
The moving average crossover strategy is a very classic and commonly used technical analysis strategy. The core idea of this strategy is to use the crossover between moving averages of different periods as trading signals. When the short-term moving average crosses above the longer-term moving average from below, a buy signal is generated. When the short-term moving average crosses below the longer-term moving average from above, a sell signal is generated.
Strategy Logic
This strategy uses input to set the type (SMA, EMA, WMA, RMA) and period of the moving average, as well as the backtesting time range.
Different types of moving averages are calculated in the variant function. The calculated moving average is saved in the ma variable.
When the close price crosses above ma, a buy signal is generated. When the close price crosses below ma, a sell signal is generated.
To set a stop loss, the 14-period average true range atr is calculated. Take the crossover point as a reference, add or subtract 2 times atr as the stop loss range.
The specific entry and exit logic is as follows:
Long entry: close crosses above ma and within backtest time range, stop loss point is entry point close
Long exit: close crosses below ma minus 2 times atr for stop loss exit, or highest price exceeds entry point close plus 2 times atr for take profit exit
Short entry: close crosses below ma and within backtest time range, stop loss point is entry point close
Short exit: close crosses above ma plus 2 times atr for stop loss exit, or lowest price lower than entry point close minus 2 times atr for take profit exit
Advantages of the Strategy
- The strategy idea is simple and clear, easy to understand and implement
- Widely used, suitable for different markets and products
- Flexible parameter settings, adjustable moving average type and period
- Use ATR stop loss to help control risks
Risks of the Strategy
- Moving average strategies tend to generate frequent trading and stop loss, reducing profit potential
- In hugely volatile markets, moving averages may generate misleading signals
- ATR stop loss range could be too wide or too narrow, failing to prevent huge losses
To address the risks, optimizations can be made in the following aspects:
- Adjust the moving average period, use longer period moving averages
- Add filter conditions to avoid frequent trading in volatile markets
- Optimize ATR parameters or use other stop loss methods
- Combine trend indicators to determine overall trend, avoid counter-trend trading
Optimization Directions
This strategy can be optimized in the following aspects:
- Add filter conditions such as volume, volatility to avoid irrational breakouts
- Use adaptive ATR stop loss so the stop loss range changes with market volatility
- Combine Stoch, RSI and other indicators for multi-factor confirmation to improve signal quality
- Add trend determination to avoid counter-trend trading
- Use time exit to avoid holding losers for too long
- Optimize moving average period parameters to find best parameter combinations
Summary
The moving average crossover strategy is a very typical and commonly used technical analysis strategy. The core idea of the strategy is simple and easy to implement, suitable for various markets, and is one of the entry-level quant trading strategies. However, the strategy also has some problems like generating frequent signals and being prone to stop loss. With proper optimizations, the performance can be greatly improved. Overall, the moving average crossover strategy provides a very good framework for strategy development and is the cornerstone of quantitative trading strategy learning.
[/trans]
Strategy Arguments
| Argument | Default | Description |
|---|---|---|
| v_input_1 | 0 | MA Type: : WMA |
| v_input_2 | 28 | length |
| v_input_3 | true | From Day |
| v_input_4 | true | From Month |
| v_input_5 | 2000 | From Year |
Source (PineScript)
/*backtest
start: 2023-10-03 00:00:00
end: 2023-11-02 00:00:00
period: 2h
basePeriod: 15m
exchanges: [{"eid":"Futures_Binance","currency":"BTC_USDT"}]
*/

//@version=4
strategy("MA Cross Strategy", overlay=true,commission_value = 0.1)

type = input(defval = "WMA", title = "MA Type: ", options=["RMA", "SMA", "EMA", "WMA"])

length = input(28)
source = close


// === INPUT BACKTEST RANGE ===
FromDay   = input(defval = 1, title = "From Day", minval = 1, maxval = 31)
FromMonth = input(defval = 1, title = "From Month", minval = 1, maxval = 12)
FromYear  = input(defval = 2000, title = "From Year", minval = 2000)

// === FUNCTION EXAMPLE ===
start     = timestamp(FromYear, FromMonth, FromDay, 00, 00)  // backtest start window
finish    = timestamp(9999, 1, 1, 23, 59)        // backtest finish window
window()  => time >= start and time <= finish ? true : false // create function "within window of time"


variant(type, src, len) =>
    v1 = sma(src, len)                                                  // Simple
    v2 = ema(src, len)                                                  // Exponential
    v5 = wma(src, len)                                                  // Weighted
    v7 = rma(src, len)                                                  // Smoothed
    type=="EMA"?v2 : type=="WMA"?v5 : type=="RMA"?v7 : v1
ma = variant(type,source, length)


atr = security(syminfo.tickerid, "D", atr(14))

range = valuewhen(cross(close,ma), (atr*2), na)

ep = valuewhen(cross(close,ma), close, na)

plot(ma,color=ma>ma[1]?color.blue:color.red,transp=0,linewidth=1)
plot(ep,color=#2196f3,transp=100,trackprice=true, offset=-9999)
plot(ep+range,color=#2196f3,transp=100,trackprice=true, offset=-9999)
plot(ep-range,color=#2196f3,transp=100,trackprice=true, offset=-9999)

strategy.entry("Long Entry", true, when = crossover(close,ma)  and window() , stop  = ep )
strategy.exit("Long Exit", "Long Entry", stop  = ep-range)
strategy.exit("Long Exit", "Long Entry", when = high > ep+range ,stop = ep[1] )

strategy.entry("Short Entry", false, when = crossunder(close,ma)  and window() , stop  = ep )
strategy.exit("Short Exit", "Short Entry", stop  = ep+range)
strategy.exit("Short Exit", "Short Entry", when = low < ep-range ,stop = ep[1] )
Detail
https://www.fmz.com/strategy/431014
Last Modified
2023-11-03 17:23:54