
201 lines
9.0 KiB
Markdown
201 lines
9.0 KiB
Markdown
|
|
> Name
|
|
|
|
布林带EMA趋势跟踪策略Bollinger-Bands-EMA-Trend-Following-Strategy
|
|
|
|
> Author
|
|
|
|
ChaoZhang
|
|
|
|
> Strategy Description
|
|
|
|
|
|
[trans]
|
|
## 概述
|
|
|
|
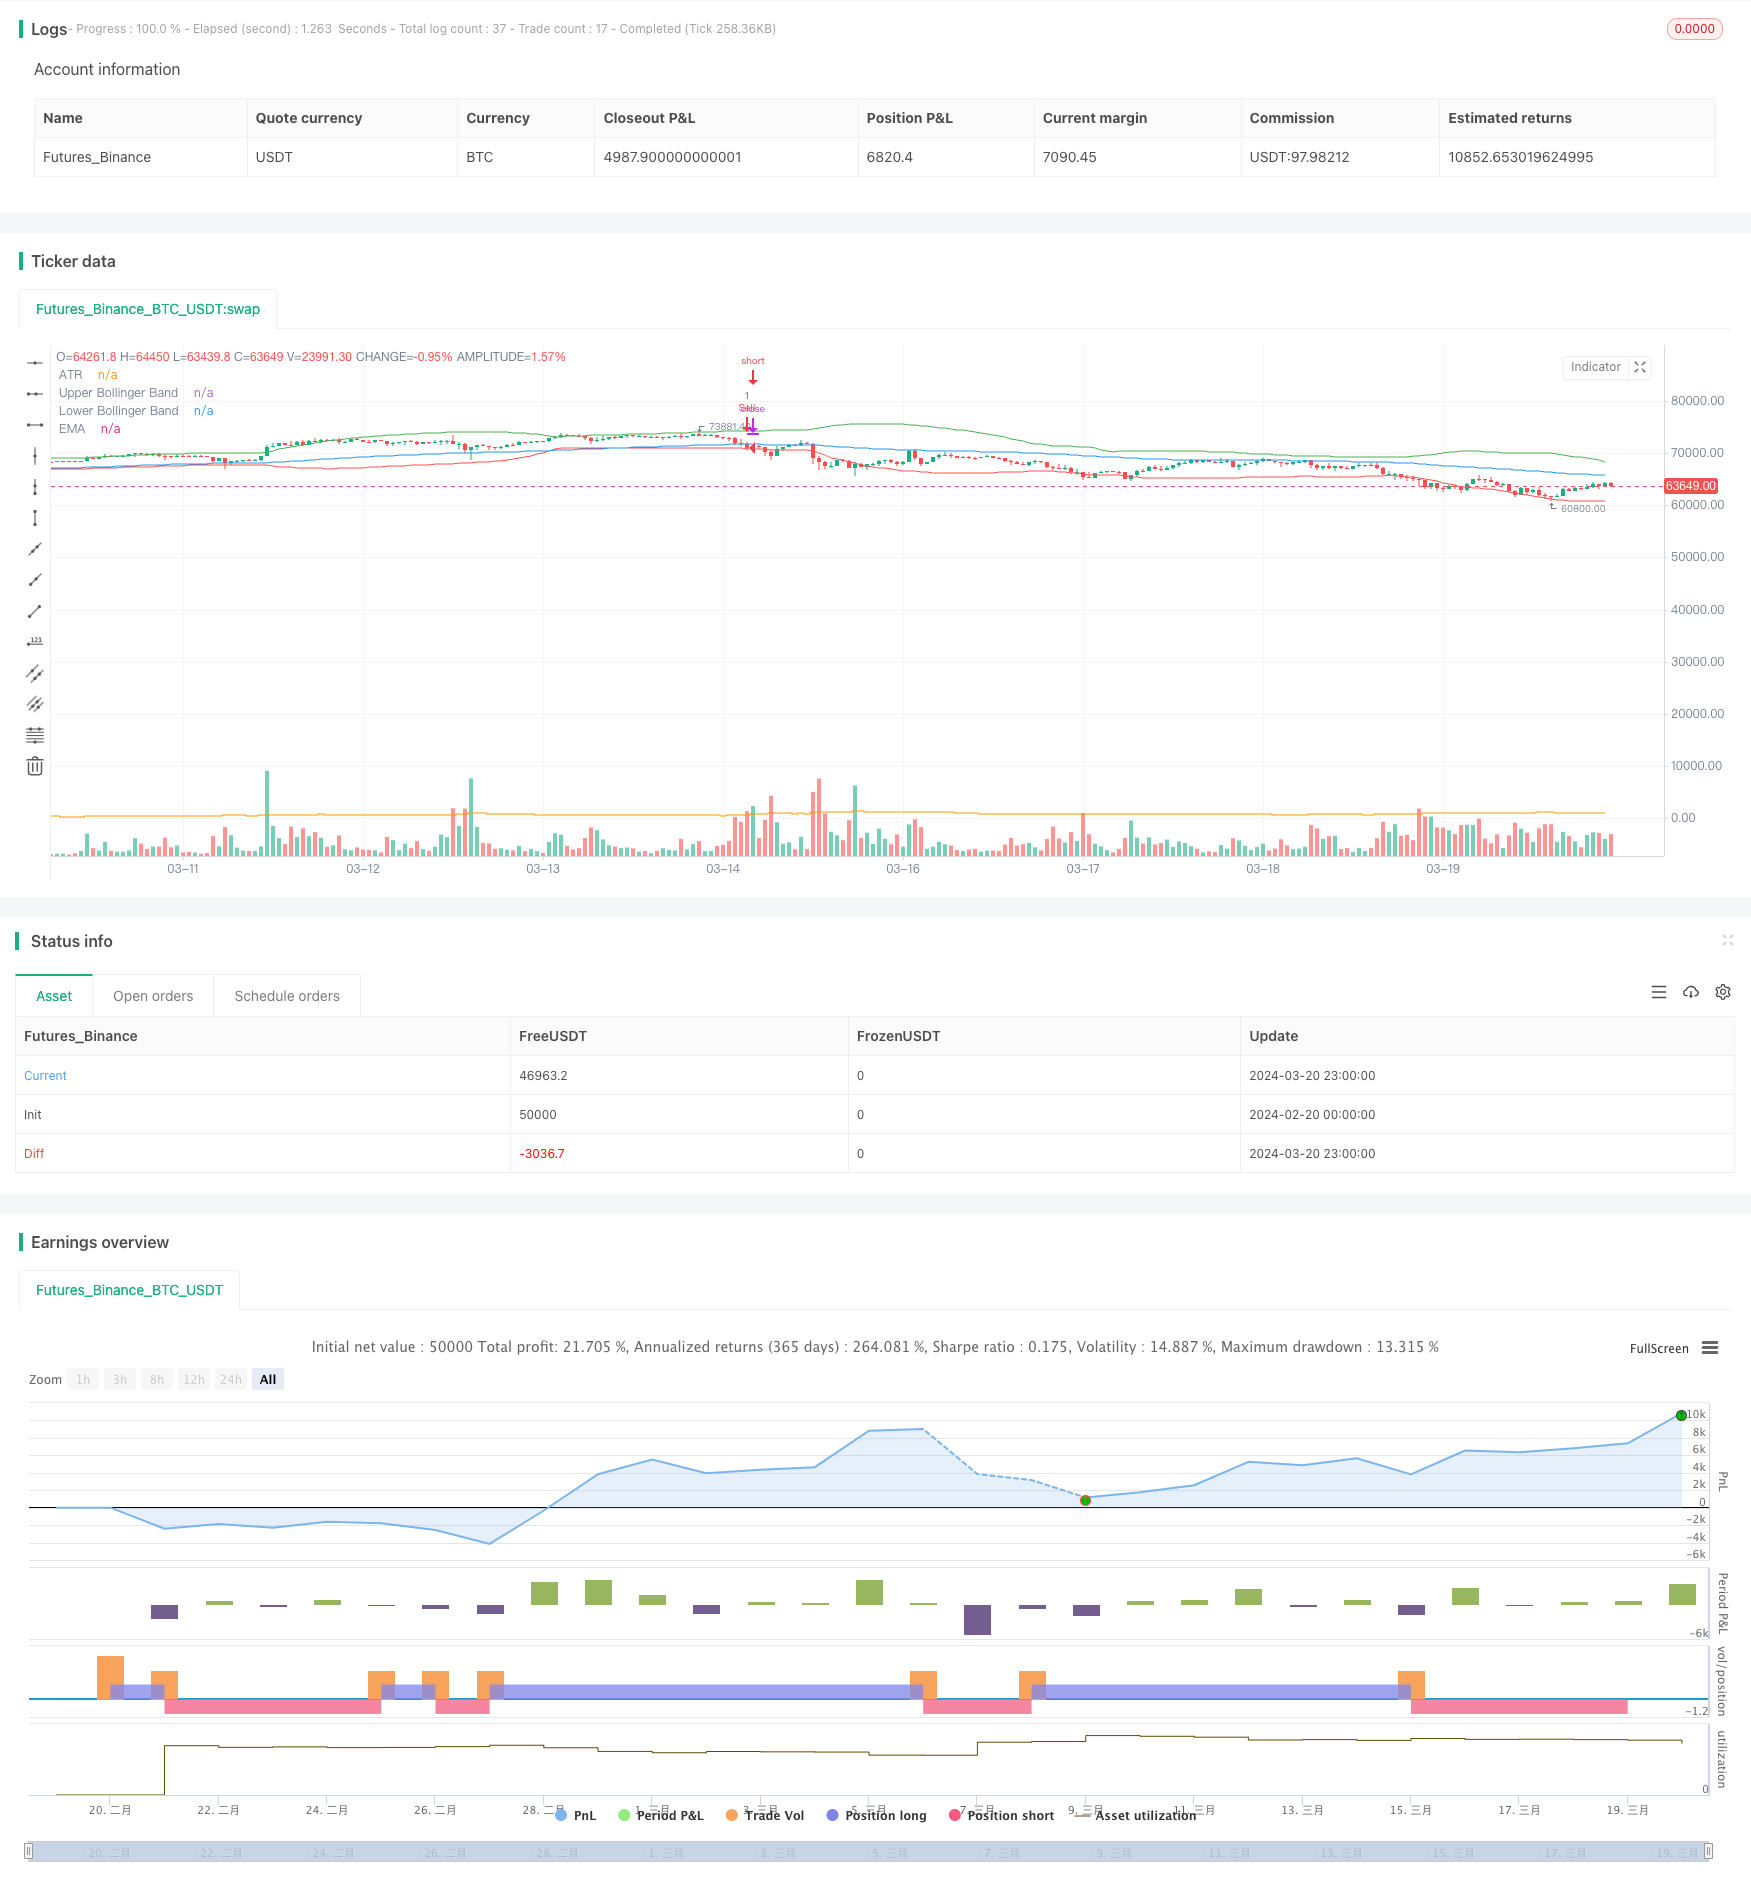
该策略结合了布林带和指数移动平均线(EMA)两个技术指标,旨在捕捉市场的趋势性机会。策略的主要思想是利用布林带来判断价格是否处于相对高位或低位,同时使用EMA作为趋势的过滤条件,最终根据一定的逻辑规则来进行交易决策。
|
|
|
|
## 策略原理
|
|
|
|
1. 计算布林带:通过计算收盘价的简单移动平均线(SMA)和标准差,得到布林带的上轨和下轨。上轨为SMA加上一定倍数的标准差,下轨为SMA减去一定倍数的标准差。
|
|
|
|
2. 计算EMA:根据设定的EMA周期,计算收盘价的指数移动平均线。
|
|
|
|
3. 计算ATR:根据设定的ATR周期,计算平均真实波动幅度(ATR)。
|
|
|
|
4. 买入条件:当收盘价同时高于EMA和布林带上轨时,触发买入信号。
|
|
|
|
5. 卖出条件:当收盘价跌破布林带下轨或EMA时,触发卖出信号。
|
|
|
|
6. 执行交易:根据买入和卖出条件,执行相应的多头或空头交易。
|
|
|
|
7. 绘图:在主图表上绘制EMA和布林带,在副图上绘制ATR。
|
|
|
|
## 优势分析
|
|
|
|
1. 布林带能够有效地捕捉价格的波动范围,帮助判断价格是否处于相对高位或低位。
|
|
|
|
2. EMA能够反映价格的趋势方向,可以用来过滤布林带产生的交易信号,提高交易的准确性。
|
|
|
|
3. ATR可以衡量市场的波动性,为交易决策提供参考。
|
|
|
|
4. 策略逻辑清晰,易于理解和实现。
|
|
|
|
5. 通过调整布林带和EMA的参数,可以适应不同的市场环境和交易品种。
|
|
|
|
## 风险分析
|
|
|
|
1. 在震荡市或趋势反转时,该策略可能会产生较多的假信号,导致频繁交易和损失。
|
|
|
|
2. 策略对参数的选择较为敏感,不同的参数设置可能会导致不同的交易结果。
|
|
|
|
3. 策略没有考虑交易成本和滑点,实际交易中可能会影响策略的收益。
|
|
|
|
4. 策略缺乏对风险的管理,如止损和仓位控制等。
|
|
|
|
## 优化方向
|
|
|
|
1. 引入趋势确认指标,如MACD、DMI等,以进一步验证趋势的可靠性,减少假信号。
|
|
|
|
2. 优化参数选择,可以通过历史数据测试不同的参数组合,找出最优的参数设置。
|
|
|
|
3. 加入风险管理措施,如根据ATR设置动态止损,或根据市场波动性调整仓位大小。
|
|
|
|
4. 考虑交易成本和滑点的影响,在回测和实盘中加以考虑,提高策略的实用性。
|
|
|
|
5. 结合其他技术指标或基本面因素,构建更加全面和稳健的交易策略。
|
|
|
|
## 总结
|
|
|
|
布林带+EMA趋势跟踪策略通过结合布林带和EMA两个技术指标,以捕捉市场的趋势性机会。该策略的优势在于逻辑清晰,易于理解和实现,通过调整参数可以适应不同的市场环境。然而,策略也存在一些风险,如在震荡市或趋势反转时可能产生较多假信号,对参数选择敏感,缺乏风险管理措施等。为了进一步优化策略,可以考虑引入其他趋势确认指标,优化参数选择,加入风险管理措施,考虑交易成本和滑点的影响,以及结合其他技术指标或基本面因素。总的来说,该策略为趋势交易提供了一个基本的框架,但在实际应用中还需要根据具体情况进行优化和改进,以提高策略的稳健性和盈利能力。
|
|
|
|
||
|
|
|
|
## Overview
|
|
|
|
This strategy combines two technical indicators, Bollinger Bands and Exponential Moving Average (EMA), to capture trending opportunities in the market. The main idea behind the strategy is to use Bollinger Bands to determine whether the price is at a relatively high or low level, while using EMA as a trend filter. The strategy makes trading decisions based on a set of logical rules.
|
|
|
|
## Strategy Principles
|
|
|
|
1. Calculate Bollinger Bands: Compute the Simple Moving Average (SMA) and standard deviation of the closing prices to obtain the upper and lower bands of the Bollinger Bands. The upper band is the SMA plus a certain multiple of the standard deviation, while the lower band is the SMA minus a certain multiple of the standard deviation.
|
|
|
|
2. Calculate EMA: Calculate the Exponential Moving Average of the closing prices based on the specified EMA period.
|
|
|
|
3. Calculate ATR: Calculate the Average True Range (ATR) based on the specified ATR period.
|
|
|
|
4. Buy Condition: A buy signal is triggered when the closing price is above both the EMA and the upper Bollinger Band.
|
|
|
|
5. Sell Condition: A sell signal is triggered when the closing price crosses below the lower Bollinger Band or the EMA.
|
|
|
|
6. Execute Trades: Execute long or short trades based on the buy and sell conditions.
|
|
|
|
7. Plotting: Plot the EMA and Bollinger Bands on the main chart, and plot the ATR on a separate pane.
|
|
|
|
## Advantage Analysis
|
|
|
|
1. Bollinger Bands are effective in capturing the price volatility range, helping to determine whether the price is at a relatively high or low level.
|
|
|
|
2. EMA can reflect the trend direction of the price and can be used to filter trading signals generated by Bollinger Bands, improving the accuracy of trades.
|
|
|
|
3. ATR can measure market volatility and provide a reference for trading decisions.
|
|
|
|
4. The strategy logic is clear and easy to understand and implement.
|
|
|
|
5. By adjusting the parameters of Bollinger Bands and EMA, the strategy can adapt to different market environments and trading instruments.
|
|
|
|
## Risk Analysis
|
|
|
|
1. In a sideways market or during trend reversals, the strategy may generate numerous false signals, leading to frequent trades and losses.
|
|
|
|
2. The strategy is sensitive to parameter selection, and different parameter settings may lead to different trading results.
|
|
|
|
3. The strategy does not consider trading costs and slippage, which may impact the strategy's profitability in actual trading.
|
|
|
|
4. The strategy lacks risk management measures, such as stop-loss and position sizing.
|
|
|
|
## Optimization Directions
|
|
|
|
1. Introduce trend confirmation indicators, such as MACD or DMI, to further validate the reliability of the trend and reduce false signals.
|
|
|
|
2. Optimize parameter selection by testing different parameter combinations on historical data to find the optimal settings.
|
|
|
|
3. Incorporate risk management measures, such as setting dynamic stop-losses based on ATR or adjusting position sizes based on market volatility.
|
|
|
|
4. Consider the impact of trading costs and slippage in backtesting and live trading to improve the practicality of the strategy.
|
|
|
|
5. Combine other technical indicators or fundamental factors to construct a more comprehensive and robust trading strategy.
|
|
|
|
## Conclusion
|
|
|
|
The Bollinger Bands + EMA Trend Following Strategy combines two technical indicators, Bollinger Bands and EMA, to capture trending opportunities in the market. The strategy's advantages lie in its clear logic, ease of understanding and implementation, and the ability to adapt to different market environments by adjusting parameters. However, the strategy also has some risks, such as generating numerous false signals in sideways markets or during trend reversals, being sensitive to parameter selection, and lacking risk management measures. To further optimize the strategy, one can consider introducing other trend confirmation indicators, optimizing parameter selection, incorporating risk management measures, considering trading costs and slippage, and combining other technical indicators or fundamental factors. Overall, the strategy provides a basic framework for trend trading, but in practical application, it needs to be optimized and improved based on specific situations to enhance the strategy's robustness and profitability.
|
|
[/trans]
|
|
|
|
|
|
|
|
> Source (PineScript)
|
|
|
|
``` pinescript
|
|
/*backtest
|
|
start: 2024-02-20 00:00:00
|
|
end: 2024-03-21 00:00:00
|
|
period: 1h
|
|
basePeriod: 15m
|
|
exchanges: [{"eid":"Futures_Binance","currency":"BTC_USDT"}]
|
|
*/
|
|
|
|
//@version=4
|
|
strategy("Bollinger Bands + EMA Strategy", overlay=true)
|
|
|
|
// Bollinger Bands settings
|
|
bollinger_period = 50
|
|
bollinger_width = 2.0
|
|
|
|
// EMA settings
|
|
ema_period = 100
|
|
|
|
// ATR settings
|
|
atr_period = 14
|
|
atr_factor = 1.8
|
|
|
|
// Calculate Bollinger Bands
|
|
sma_source = sma(close, bollinger_period)
|
|
std_dev = stdev(close, bollinger_period)
|
|
upper_band = sma_source + bollinger_width * std_dev
|
|
lower_band = sma_source - bollinger_width * std_dev
|
|
|
|
// Calculate EMA
|
|
ema_value = ema(close, ema_period)
|
|
|
|
// Calculate ATR
|
|
atr_value = atr(atr_period)
|
|
|
|
// Buy condition
|
|
buy_condition = close > ema_value and close > upper_band
|
|
|
|
// Sell condition
|
|
sell_condition = crossunder(close, lower_band) or crossunder(close, ema_value)
|
|
|
|
// Plotting Bollinger Bands and EMA
|
|
plot(ema_value, color=color.blue, title="EMA")
|
|
plot(upper_band, color=color.green, title="Upper Bollinger Band")
|
|
plot(lower_band, color=color.red, title="Lower Bollinger Band")
|
|
|
|
// Execute orders based on conditions
|
|
if (buy_condition)
|
|
strategy.entry("Buy", strategy.long)
|
|
if (sell_condition)
|
|
strategy.entry("Sell", strategy.short)
|
|
|
|
// Plot ATR on separate pane
|
|
plot(atr_value, color=color.orange, title="ATR", style=plot.style_stepline, linewidth=1, transp=0)
|
|
|
|
```
|
|
|
|
> Detail
|
|
|
|
https://www.fmz.com/strategy/445814
|
|
|
|
> Last Modified
|
|
|
|
2024-03-22 14:27:44
|