
8.3 KiB
Name
布林带ATR趋势跟踪策略-Bollinger-Band-ATR-Trend-Following-Strategy
Author
ChaoZhang
Strategy Description
[trans]
概述
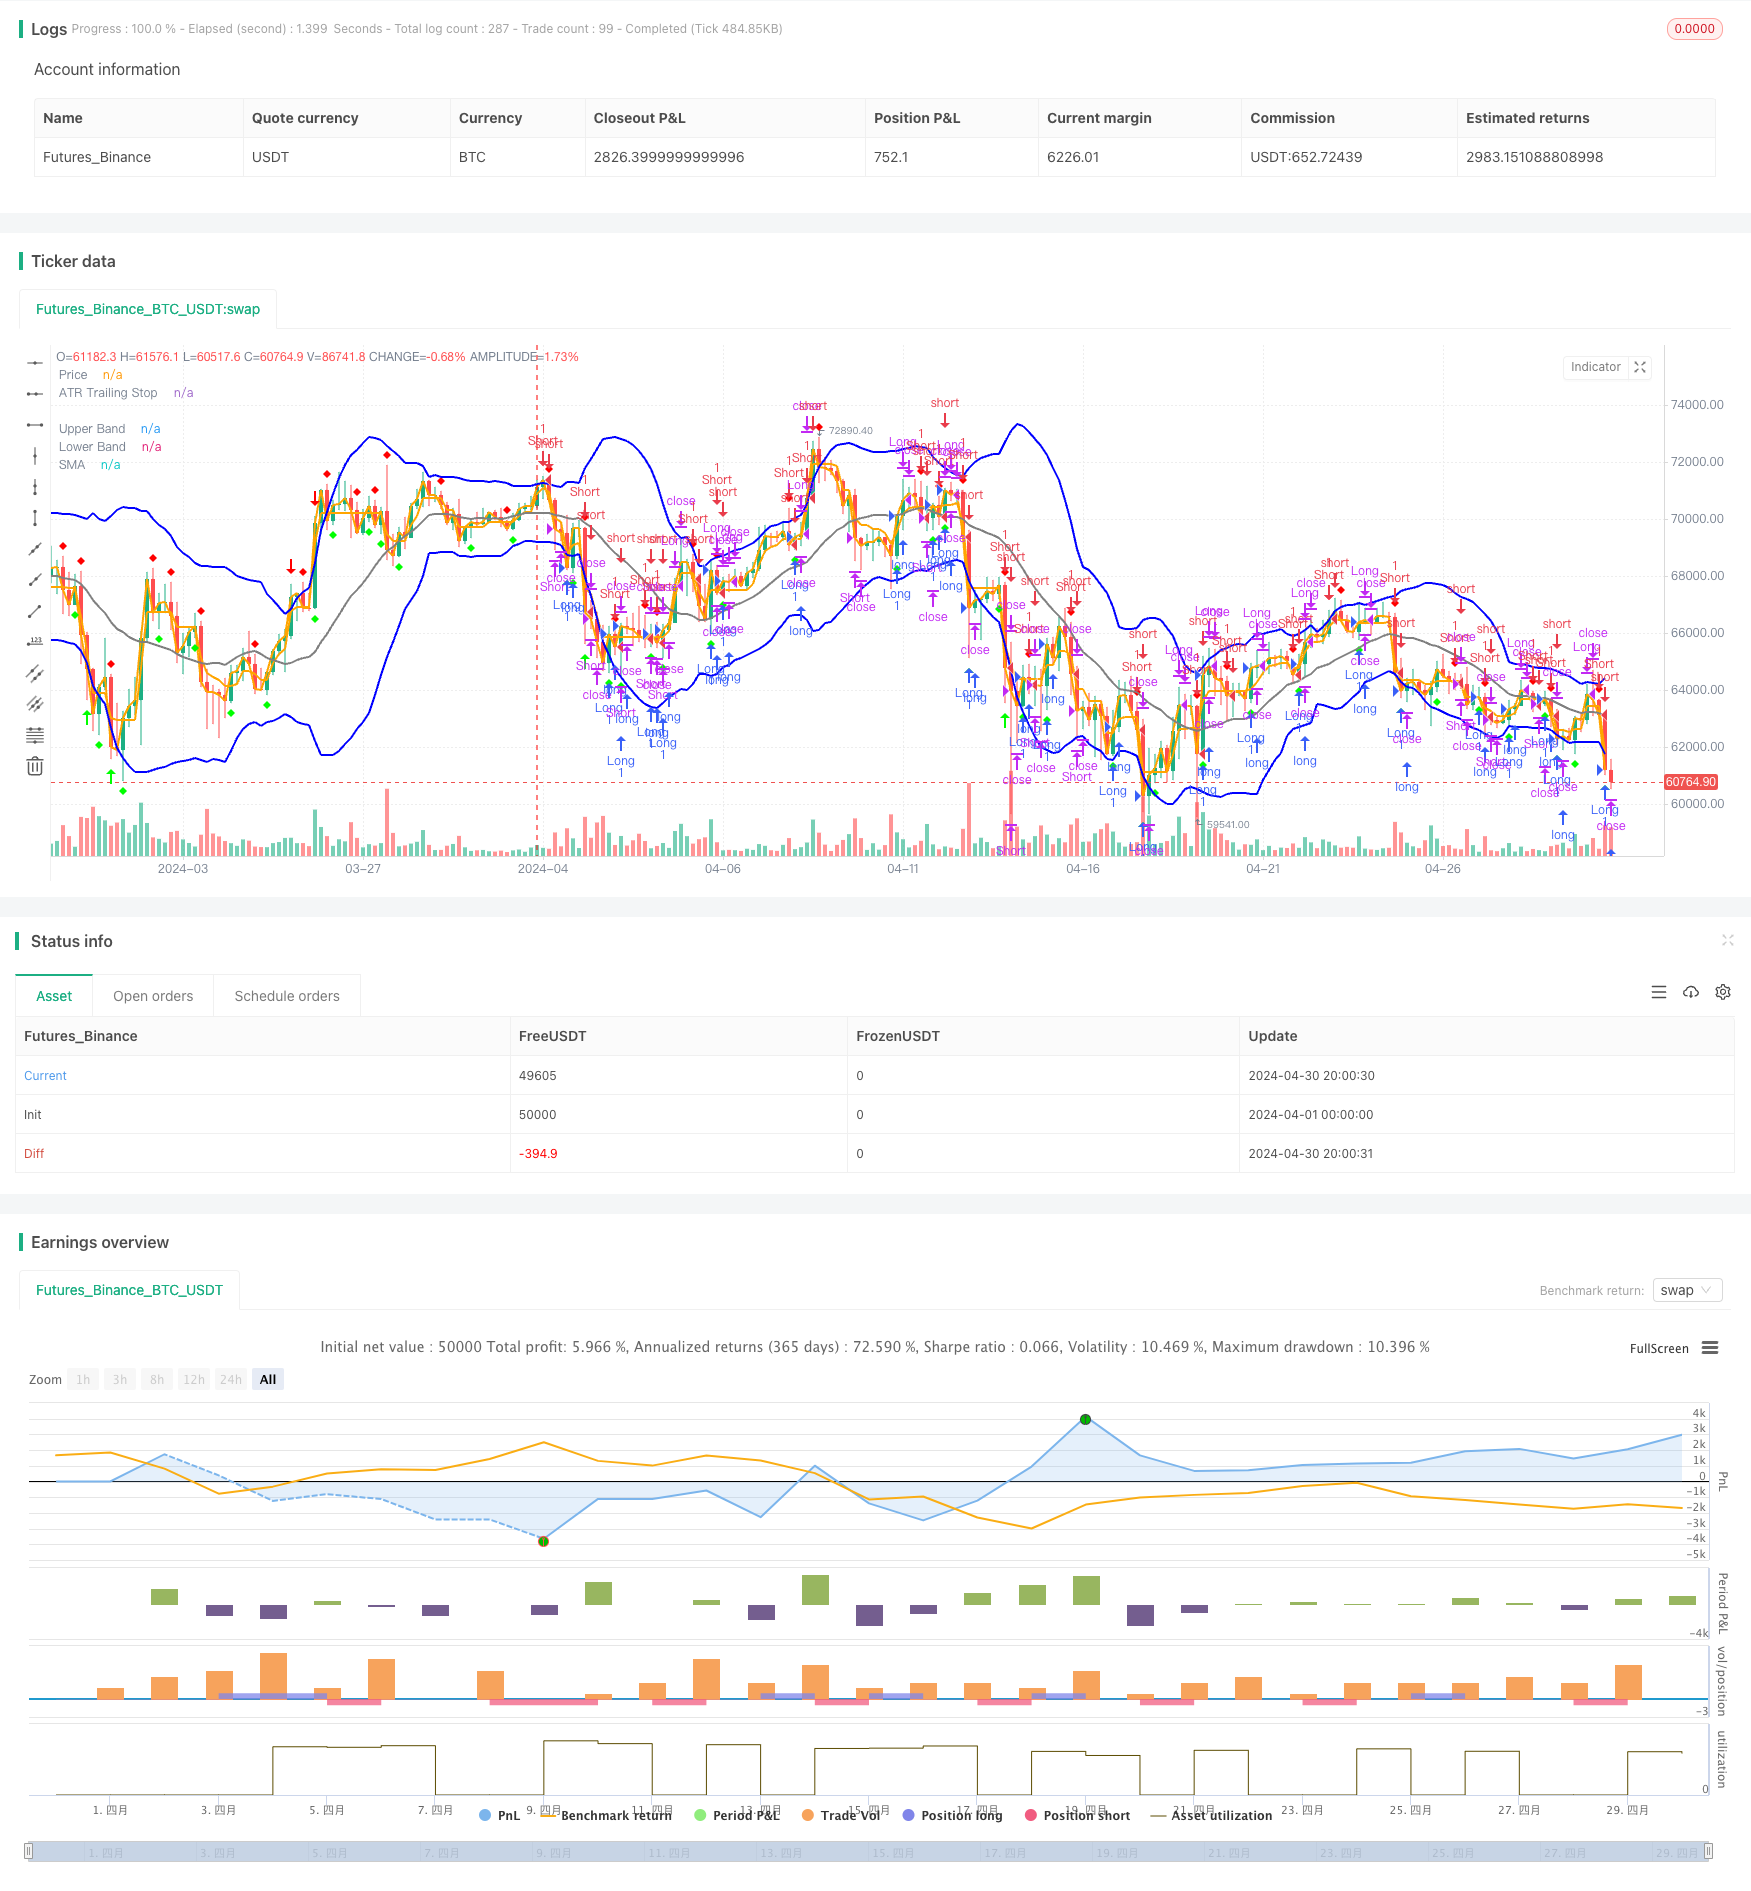
该策略基于布林带和ATR指标,通过布林带捕捉价格的波动范围,利用价格突破布林带上下轨作为建仓信号,同时使用ATR作为移动止损,最后以价格突破简单移动平均线作为平仓信号。该策略试图捕捉趋势行情,跟随趋势方向建仓,并在趋势反转时及时平仓。
策略原理
- 计算布林带:使用收盘价计算简单移动平均线(SMA)作为布林带中轨,并根据波动率(标准差)计算上下轨。
- 计算ATR:使用真实波幅(TR)的移动平均值计算ATR,作为移动止损的依据。
- 产生交易信号:当价格向下突破布林带下轨时产生做多信号,向上突破布林带上轨时产生做空信号;当价格向上突破ATR移动止损时产生做多信号,向下突破ATR移动止损时产生做空信号。
- 平仓:当做多仓位时,如果价格向上突破简单移动平均线,则平多;当做空仓位时,如果价格向下突破简单移动平均线,则平空。
策略优势
- 趋势跟踪:通过布林带和ATR移动止损捕捉趋势行情,适应不同市场环境。
- 及时止损:使用ATR作为移动止损,可以根据市场波动情况动态调整止损位置,控制风险。
- 简单易用:策略逻辑清晰,参数较少,易于理解和应用。
策略风险
- 参数敏感:布林带和ATR的参数选择会影响策略表现,需要根据不同市场和品种进行优化。
- 震荡市:在震荡市场环境下,频繁的交易信号可能导致过多的交易次数和成本。
- 趋势反转:当趋势反转时,策略可能会产生较大回撤。
策略优化方向
- 参数优化:对布林带和ATR的参数进行优化,找到适合不同市场和品种的最佳参数组合。
- 过滤器:添加其他技术指标或价格行为模式作为过滤器,减少误判和提高信号质量。
- 仓位管理:根据市场波动率或账户风险进行仓位动态调整,提高资金利用效率和收益风险比。
总结
布林带ATR趋势跟踪策略通过布林带和ATR指标捕捉趋势行情,具有趋势跟踪、及时止损和简单易用的优势。但同时也存在参数敏感、震荡市和趋势反转等风险。可以通过参数优化、添加过滤器和仓位管理等方式进一步优化策略表现。
||
Overview
This strategy is based on Bollinger Bands and the ATR indicator. It captures price fluctuations using Bollinger Bands, uses price breakouts above or below the bands as entry signals, and employs ATR as a trailing stop loss. The strategy closes positions when the price crosses the simple moving average. It aims to capture trending markets, enter positions in the direction of the trend, and promptly close positions when the trend reverses.
Strategy Principles
- Calculate Bollinger Bands: Use the closing price to calculate the simple moving average (SMA) as the middle band, and calculate the upper and lower bands based on volatility (standard deviation).
- Calculate ATR: Use the moving average of true range (TR) to calculate ATR as the basis for the trailing stop loss.
- Generate trading signals: When the price breaks below the lower Bollinger Band, generate a long signal; when it breaks above the upper Bollinger Band, generate a short signal. When the price breaks above the ATR trailing stop, generate a long signal; when it breaks below the ATR trailing stop, generate a short signal.
- Close positions: For long positions, if the price breaks above the simple moving average, close the long position; for short positions, if the price breaks below the simple moving average, close the short position.
Strategy Advantages
- Trend following: Captures trending markets by using Bollinger Bands and ATR trailing stop, adapting to different market environments.
- Timely stop loss: Uses ATR as a trailing stop loss, dynamically adjusting the stop loss position according to market volatility to control risk.
- Simple and easy to use: The strategy logic is clear, with few parameters, making it easy to understand and apply.
Strategy Risks
- Parameter sensitivity: The performance of the strategy is affected by the choice of parameters for Bollinger Bands and ATR, requiring optimization for different markets and instruments.
- Choppy markets: In choppy market conditions, frequent trading signals may lead to excessive trading frequency and costs.
- Trend reversal: When a trend reverses, the strategy may experience significant drawdowns.
Strategy Optimization Directions
- Parameter optimization: Optimize the parameters of Bollinger Bands and ATR to find the best combination for different markets and instruments.
- Filters: Add other technical indicators or price behavior patterns as filters to reduce misjudgments and improve signal quality.
- Position management: Dynamically adjust positions based on market volatility or account risk to improve capital utilization efficiency and risk-adjusted returns.
Summary
The Bollinger Band ATR Trend Following Strategy captures trending markets using Bollinger Bands and the ATR indicator. It has the advantages of trend following, timely stop loss, and simplicity. However, it also faces risks such as parameter sensitivity, choppy markets, and trend reversals. The strategy's performance can be further optimized through parameter optimization, adding filters, and position management. [/trans]
Source (PineScript)
/*backtest
start: 2024-04-01 00:00:00
end: 2024-04-30 23:59:59
period: 4h
basePeriod: 15m
exchanges: [{"eid":"Futures_Binance","currency":"BTC_USDT"}]
*/

//@version=5
strategy("Bollinger Bands and ATR Strategy", overlay=true)

// Veri Çekme
symbol = "AAPL"
timeframe = "D"
src = close

// Bollinger Bantları Hesaplama
len = 20
mult = 2
sum1 = 0.0, sum2 = 0.0
for i = 0 to len - 1
    sum1 += src[i]
basis = sum1 / len
for i = 0 to len - 1
    diff = src[i] - basis
    sum2 += diff * diff
dev = math.sqrt(sum2 / len)
upper_band = basis + dev * mult
lower_band = basis - dev * mult

// ATR Hesaplama
atr_period = input(10, title="ATR Period")
atr_value = 0.0
for i = 0 to atr_period - 1
    atr_value += math.abs(src[i] - src[i + 1])
atr_value /= atr_period
loss = input(1, title="Key Value (Sensitivity)")
atr_trailing_stop = src[1]
if src > atr_trailing_stop[1]
    atr_trailing_stop := math.max(atr_trailing_stop[1], src - loss * atr_value)
else if src < atr_trailing_stop[1]
    atr_trailing_stop := math.min(atr_trailing_stop[1], src + loss * atr_value)
else
    atr_trailing_stop := src - loss * atr_value

// Sinyal Üretme
long_condition  = src < lower_band and src[1] >= lower_band[1]
short_condition = src > upper_band and src[1] <= upper_band[1]
close_long  = src > basis
close_short = src < basis
buy_signal = src > atr_trailing_stop[1] and src[1] <= atr_trailing_stop[1]
sell_signal = src < atr_trailing_stop[1] and src[1] >= atr_trailing_stop[1]

if (long_condition)
    strategy.entry("Long", strategy.long, comment="Long Signal")
if (short_condition)
    strategy.entry("Short", strategy.short, comment="Short Signal")
if (close_long)
    strategy.close("Long", comment="Close Long")
if (close_short)
    strategy.close("Short", comment="Close Short")
if (buy_signal)
    strategy.entry("Long", strategy.long, comment="Buy Signal")
if (sell_signal)
    strategy.entry("Short", strategy.short, comment="Sell Signal")

// Çizim
plot(upper_band, color=#0000FF, linewidth=2, title="Upper Band")
plot(lower_band, color=#0000FF, linewidth=2, title="Lower Band")
plot(basis, color=#808080, linewidth=2, title="SMA")
plot(atr_trailing_stop, color=#FFA500, linewidth=2, title="ATR Trailing Stop")
plot(src, color=#FFA500, linewidth=2, title="Price")

// Sinyal İşaretleri
plotshape(long_condition, style=shape.arrowup, color=#00FF00, location=location.belowbar, size=size.small, title="Long Signal")
plotshape(short_condition, style=shape.arrowdown, color=#FF0000, location=location.abovebar, size=size.small, title="Short Signal")
plotshape(buy_signal, style=shape.diamond, color=#00FF00, location=location.belowbar, size=size.small, title="Buy Signal")
plotshape(sell_signal, style=shape.diamond, color=#FF0000, location=location.abovebar, size=size.small, title="Sell Signal")
Detail
https://www.fmz.com/strategy/451492
Last Modified
2024-05-15 10:50:14