
159 lines
8.6 KiB
Markdown
159 lines
8.6 KiB
Markdown
|
|
> Name
|
|
|
|
布林带高频量化策略结合过高低点突破的多空策略-Bollinger-Bands-High-Frequency-Quantitative-Strategy-Combined-with-High-Low-Breakout-System
|
|
|
|
> Author
|
|
|
|
ChaoZhang
|
|
|
|
> Strategy Description
|
|
|
|
|
|
|
|
[trans]
|
|
#### 概述
|
|
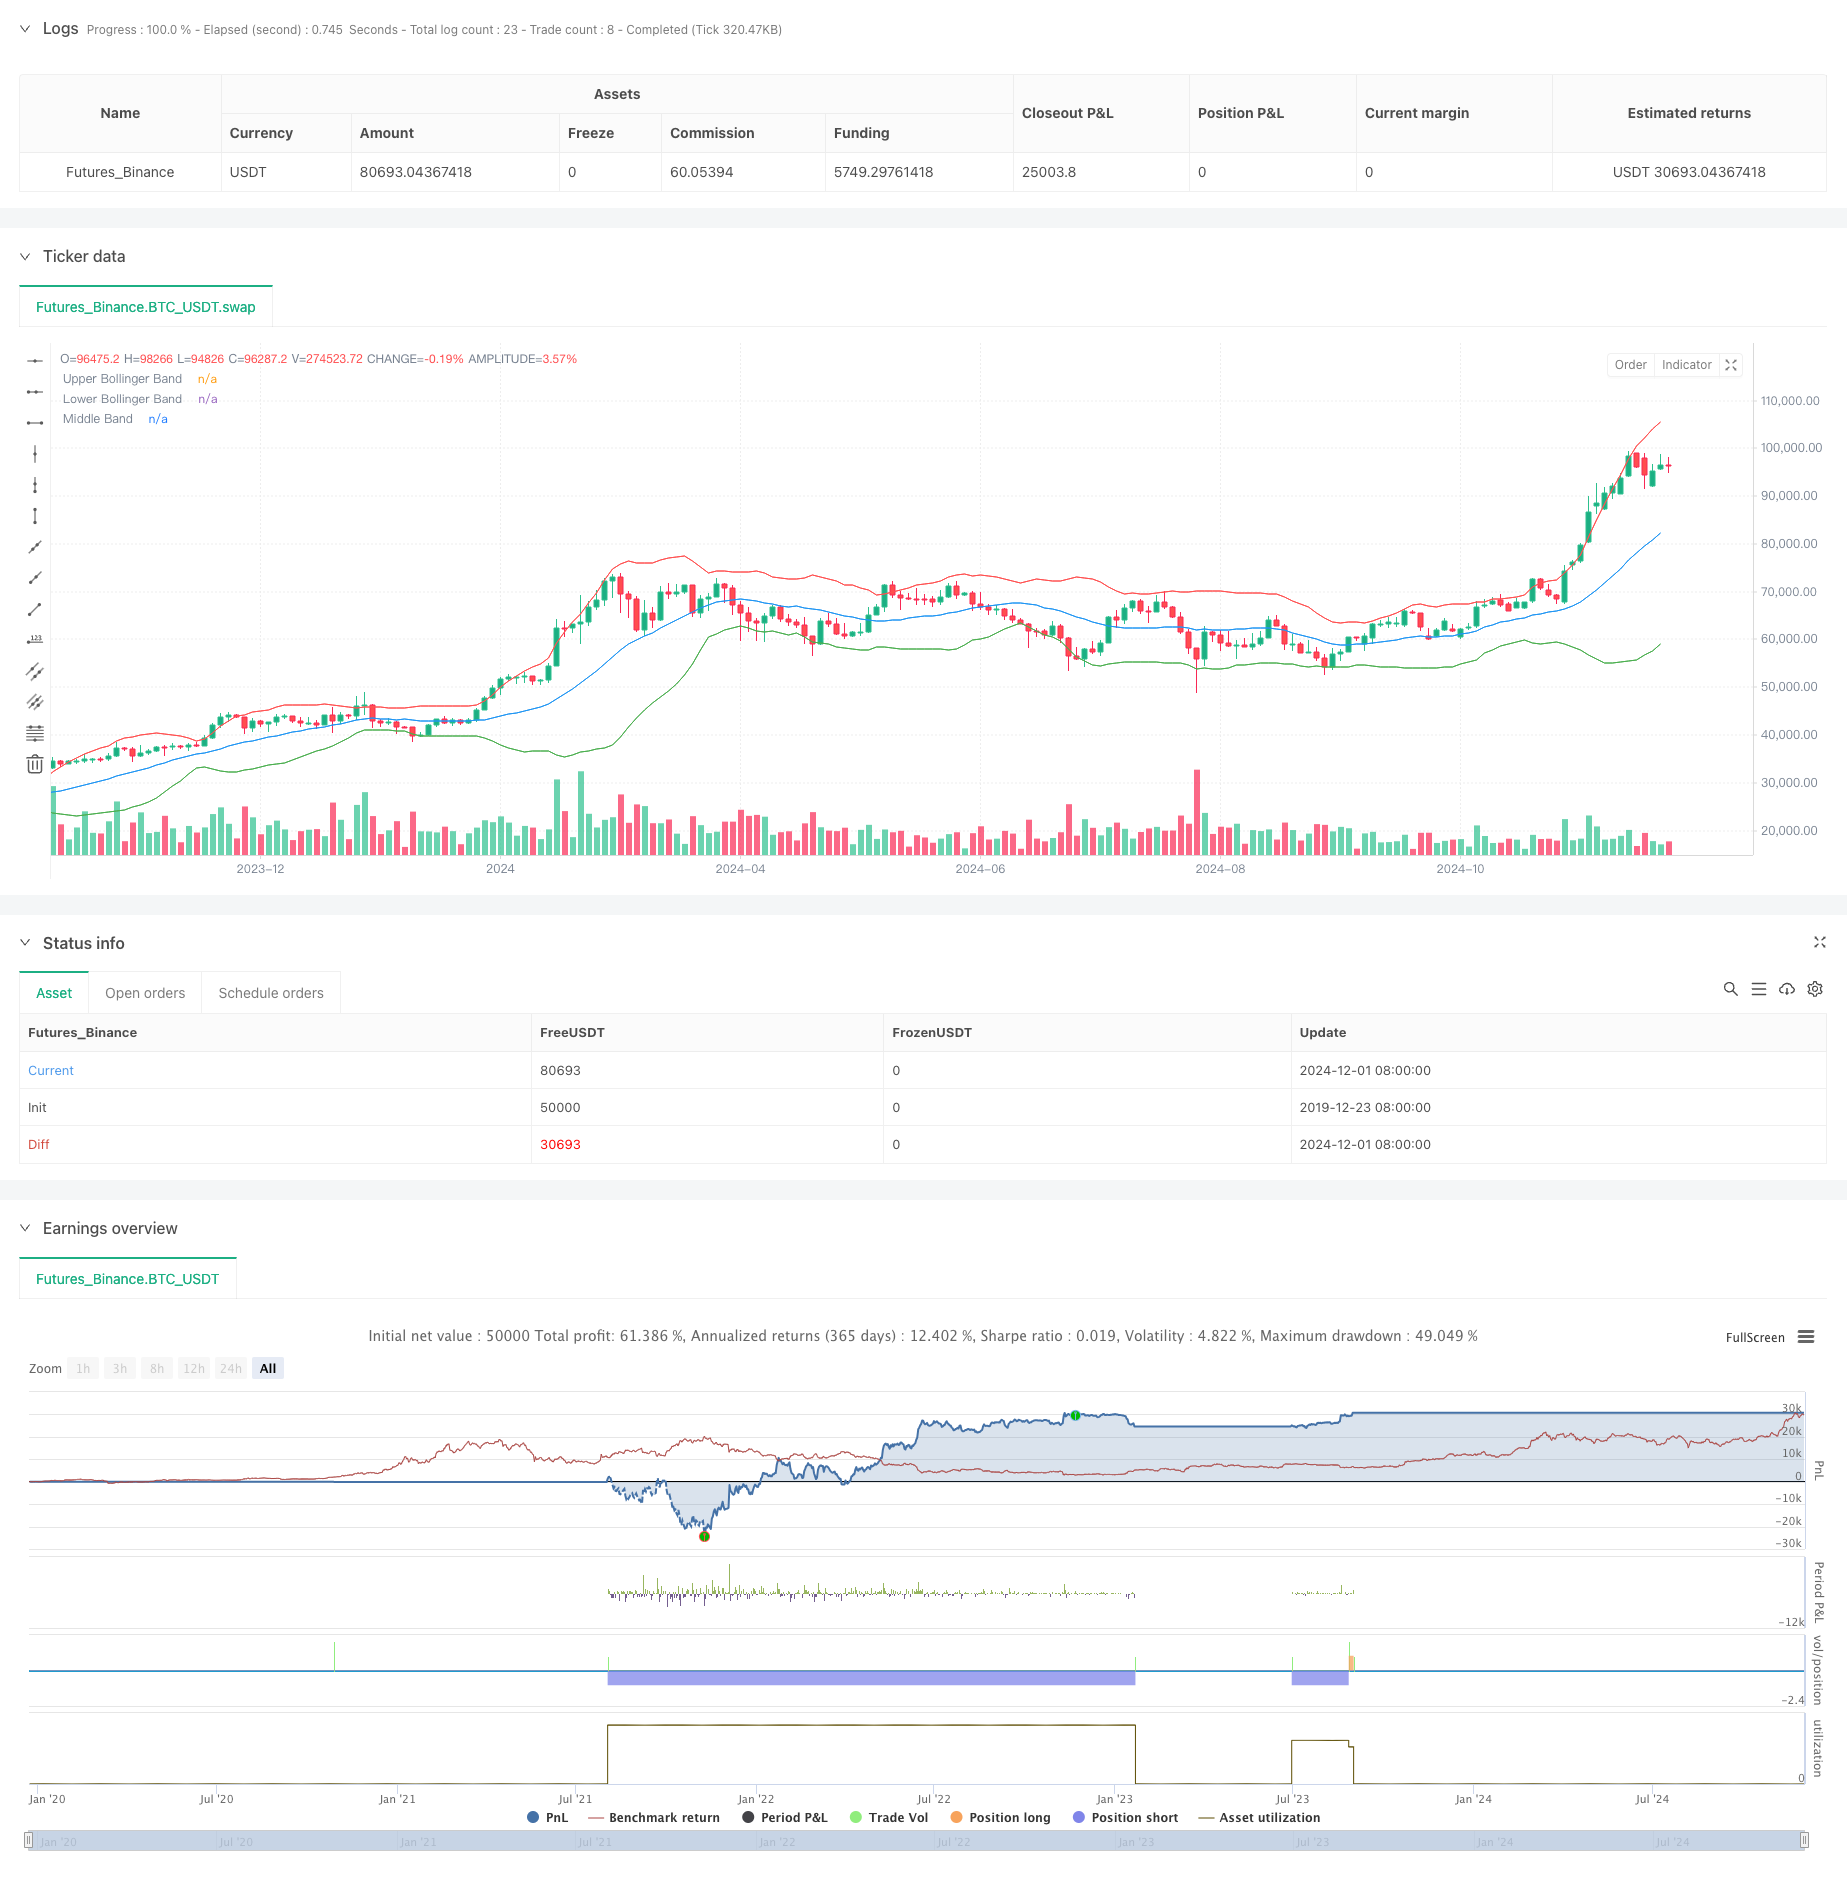
该策略是一个结合布林带指标与价格突破的高频交易系统。策略通过监控价格与布林带的位置关系,结合前期高低点突破信号,在市场出现超买超卖时进行反转交易。系统采用1:1的风险收益比设置止盈止损,并通过可视化的方式展示各个关键价位,帮助交易者直观理解市场走势。
|
|
|
|
#### 策略原理
|
|
策略的核心逻辑建立在两个主要判断条件上:当价格突破前期高点且前期高点位于布林带下轨以下时,触发做多信号;当价格跌破前期低点且前期低点位于布林带上轨以上时,触发做空信号。布林带参数采用20周期移动平均线与2倍标准差,用于判断市场的波动范围和超买超卖区域。系统在触发交易信号后,会自动设置相应的止损位和目标位,并通过不同样式的线条进行可视化展示。
|
|
|
|
#### 策略优势
|
|
1. 结合了趋势突破和均值回归两种交易思路,能够在不同市场环境下保持稳定性
|
|
2. 采用固定的风险收益比进行仓位管理,有利于长期稳定获利
|
|
3. 通过可视化展示入场、止损和目标位,提高了策略的可操作性
|
|
4. 布林带指标的使用帮助识别市场超买超卖状态,提高了交易的准确性
|
|
5. 策略逻辑简单明确,便于理解和执行
|
|
|
|
#### 策略风险
|
|
1. 高频交易可能面临较高的交易成本,需要考虑手续费的影响
|
|
2. 在横盘震荡市场中可能产生频繁的假突破信号
|
|
3. 固定的风险收益比可能无法充分把握大趋势行情
|
|
4. 布林带参数固定可能不适应所有市场环境
|
|
5. 需要实时监控市场以确保信号的及时执行
|
|
|
|
#### 策略优化方向
|
|
1. 引入成交量指标作为信号确认,提高突破的可靠性
|
|
2. 根据市场波动率动态调整布林带参数
|
|
3. 增加趋势过滤器,避免在横盘市场频繁交易
|
|
4. 考虑加入时间过滤,避免在不活跃时段交易
|
|
5. 开发自适应的风险收益比设置机制
|
|
|
|
#### 总结
|
|
这是一个集成了多个技术分析概念的完整交易系统。通过布林带指标与价格突破相结合的方式,策略能够在市场超买超卖区域捕捉反转机会。虽然存在一定的优化空间,但系统的基础框架具有良好的可扩展性和实用价值。通过合理的风险管理和参数优化,该策略有望在实际交易中取得稳定收益。 ||
|
|
|
|
#### Overview
|
|
This strategy is a high-frequency trading system that combines Bollinger Bands indicators with price breakout signals. The strategy monitors the relationship between price and Bollinger Bands, combined with previous high and low point breakout signals, to execute reversal trades during market overbought and oversold conditions. The system implements a 1:1 risk-reward ratio for profit and loss targets, and visualizes key price levels to help traders intuitively understand market trends.
|
|
|
|
#### Strategy Principles
|
|
The core logic of the strategy is based on two main conditions: a buy signal is triggered when the price breaks above the previous high and that high is below the lower Bollinger Band; a sell signal is triggered when the price breaks below the previous low and that low is above the upper Bollinger Band. The Bollinger Bands parameters use a 20-period moving average with 2 standard deviations to determine market volatility range and overbought/oversold areas. After triggering trading signals, the system automatically sets corresponding stop-loss and target levels, visualizing them through different line styles.
|
|
|
|
#### Strategy Advantages
|
|
1. Combines both trend breakout and mean reversion trading approaches, maintaining stability across different market conditions
|
|
2. Uses fixed risk-reward ratio for position management, beneficial for long-term profitable trading
|
|
3. Visualizes entry, stop-loss, and target levels, improving strategy operability
|
|
4. Utilizes Bollinger Bands to identify market overbought/oversold conditions, enhancing trading accuracy
|
|
5. Simple and clear strategy logic, easy to understand and execute
|
|
|
|
#### Strategy Risks
|
|
1. High-frequency trading may face higher transaction costs, requiring consideration of commission impacts
|
|
2. May generate frequent false breakout signals in ranging markets
|
|
3. Fixed risk-reward ratio might not fully capture strong trend movements
|
|
4. Fixed Bollinger Bands parameters may not adapt to all market conditions
|
|
5. Requires real-time market monitoring to ensure timely signal execution
|
|
|
|
#### Strategy Optimization Directions
|
|
1. Incorporate volume indicators for signal confirmation, improving breakout reliability
|
|
2. Dynamically adjust Bollinger Bands parameters based on market volatility
|
|
3. Add trend filters to avoid frequent trading in ranging markets
|
|
4. Consider adding time filters to avoid trading during inactive periods
|
|
5. Develop adaptive risk-reward ratio setting mechanisms
|
|
|
|
#### Summary
|
|
This is a comprehensive trading system integrating multiple technical analysis concepts. Through the combination of Bollinger Bands indicators and price breakouts, the strategy can capture reversal opportunities in market overbought and oversold areas. While there is room for optimization, the system's basic framework has good extensibility and practical value. Through proper risk management and parameter optimization, this strategy has the potential to achieve stable returns in actual trading.[/trans]
|
|
|
|
|
|
|
|
> Source (PineScript)
|
|
|
|
``` pinescript
|
|
/*backtest
|
|
start: 2019-12-23 08:00:00
|
|
end: 2024-12-03 00:00:00
|
|
period: 2d
|
|
basePeriod: 2d
|
|
exchanges: [{"eid":"Futures_Binance","currency":"BTC_USDT"}]
|
|
*/
|
|
|
|
//@version=5
|
|
strategy("Bollinger Band Scalping", overlay=true)
|
|
|
|
// Input for Bollinger Bands length and standard deviation
|
|
bbLength = input(20, title="Bollinger Bands Length")
|
|
stdDev = input(2.0, title="Bollinger Bands Std Dev")
|
|
|
|
// Calculate and plot the Bollinger Bands
|
|
basis = ta.sma(close, bbLength)
|
|
deviation = stdDev * ta.stdev(close, bbLength)
|
|
upperBB = basis + deviation
|
|
lowerBB = basis - deviation
|
|
|
|
// Get previous candle's values
|
|
prevHigh = high[1] // Previous candle high
|
|
prevLow = low[1] // Previous candle low
|
|
|
|
// Buy Signal Condition: Current high crossed above previous high and previous high is below the lower Bollinger Band
|
|
buyCondition = ta.crossover(high, prevHigh) and (prevHigh < lowerBB[1])
|
|
|
|
// Sell Signal Condition: Current low crossed below previous low and previous low is above the upper Bollinger Band
|
|
sellCondition = ta.crossunder(low, prevLow) and (prevLow > upperBB[1])
|
|
|
|
// Entry and exit for Buy signals
|
|
if (buyCondition)
|
|
strategy.entry("Buy", strategy.long)
|
|
// Calculate target and stop loss
|
|
stopLossPrice = prevLow
|
|
targetPrice = prevHigh + (prevHigh - stopLossPrice) // 1:1 RR target
|
|
|
|
// Set stop loss and target orders
|
|
strategy.exit("Sell", "Buy", limit=targetPrice, stop=stopLossPrice)
|
|
|
|
// // Plot entry line
|
|
// line.new(x1=bar_index, y1=prevHigh, x2=bar_index + 12, y2=prevHigh, color=color.green, width=2, style=line.style_solid)
|
|
// // Plot stop loss line
|
|
// line.new(x1=bar_index, y1=stopLossPrice, x2=bar_index + 12, y2=stopLossPrice, color=color.red, width=1, style=line.style_dashed)
|
|
// // Plot target line
|
|
// line.new(x1=bar_index, y1=targetPrice, x2=bar_index + 12, y2=targetPrice, color=color.blue, width=2, style=line.style_solid)
|
|
|
|
// Entry and exit for Sell signals
|
|
if (sellCondition)
|
|
strategy.entry("Sell", strategy.short)
|
|
// Calculate target and stop loss
|
|
stopLossPriceSell = prevHigh
|
|
targetPriceSell = prevLow - (stopLossPriceSell - prevLow) // 1:1 RR target
|
|
|
|
// Set stop loss and target orders
|
|
strategy.exit("Cover", "Sell", limit=targetPriceSell, stop=stopLossPriceSell)
|
|
|
|
// // Plot entry line
|
|
// line.new(x1=bar_index, y1=prevLow, x2=bar_index + 12, y2=prevLow, color=color.red, width=2, style=line.style_solid)
|
|
// // Plot stop loss line
|
|
// line.new(x1=bar_index, y1=stopLossPriceSell, x2=bar_index + 12, y2=stopLossPriceSell, color=color.green, width=1, style=line.style_dashed)
|
|
// // Plot target line
|
|
// line.new(x1=bar_index, y1=targetPriceSell, x2=bar_index + 12, y2=targetPriceSell, color=color.blue, width=2, style=line.style_solid)
|
|
|
|
// Plotting Bollinger Bands with 70% transparency
|
|
plot(upperBB, color=color.red, title="Upper Bollinger Band", transp=70)
|
|
plot(lowerBB, color=color.green, title="Lower Bollinger Band", transp=70)
|
|
plot(basis, color=color.blue, title="Middle Band", transp=70)
|
|
|
|
```
|
|
|
|
> Detail
|
|
|
|
https://www.fmz.com/strategy/473936
|
|
|
|
> Last Modified
|
|
|
|
2024-12-04 15:15:50
|