
201 lines
9.4 KiB
Markdown
201 lines
9.4 KiB
Markdown
|
|
> Name
|
|
|
|
布林带趋势突破增强型量化策略结合指标动量过滤系统-Enhanced-Bollinger-Breakout-Quantitative-Strategy-with-Momentum-Filter-Integration-System
|
|
|
|
> Author
|
|
|
|
ChaoZhang
|
|
|
|
> Strategy Description
|
|
|
|
|
|
|
|
[trans]
|
|
#### 概述
|
|
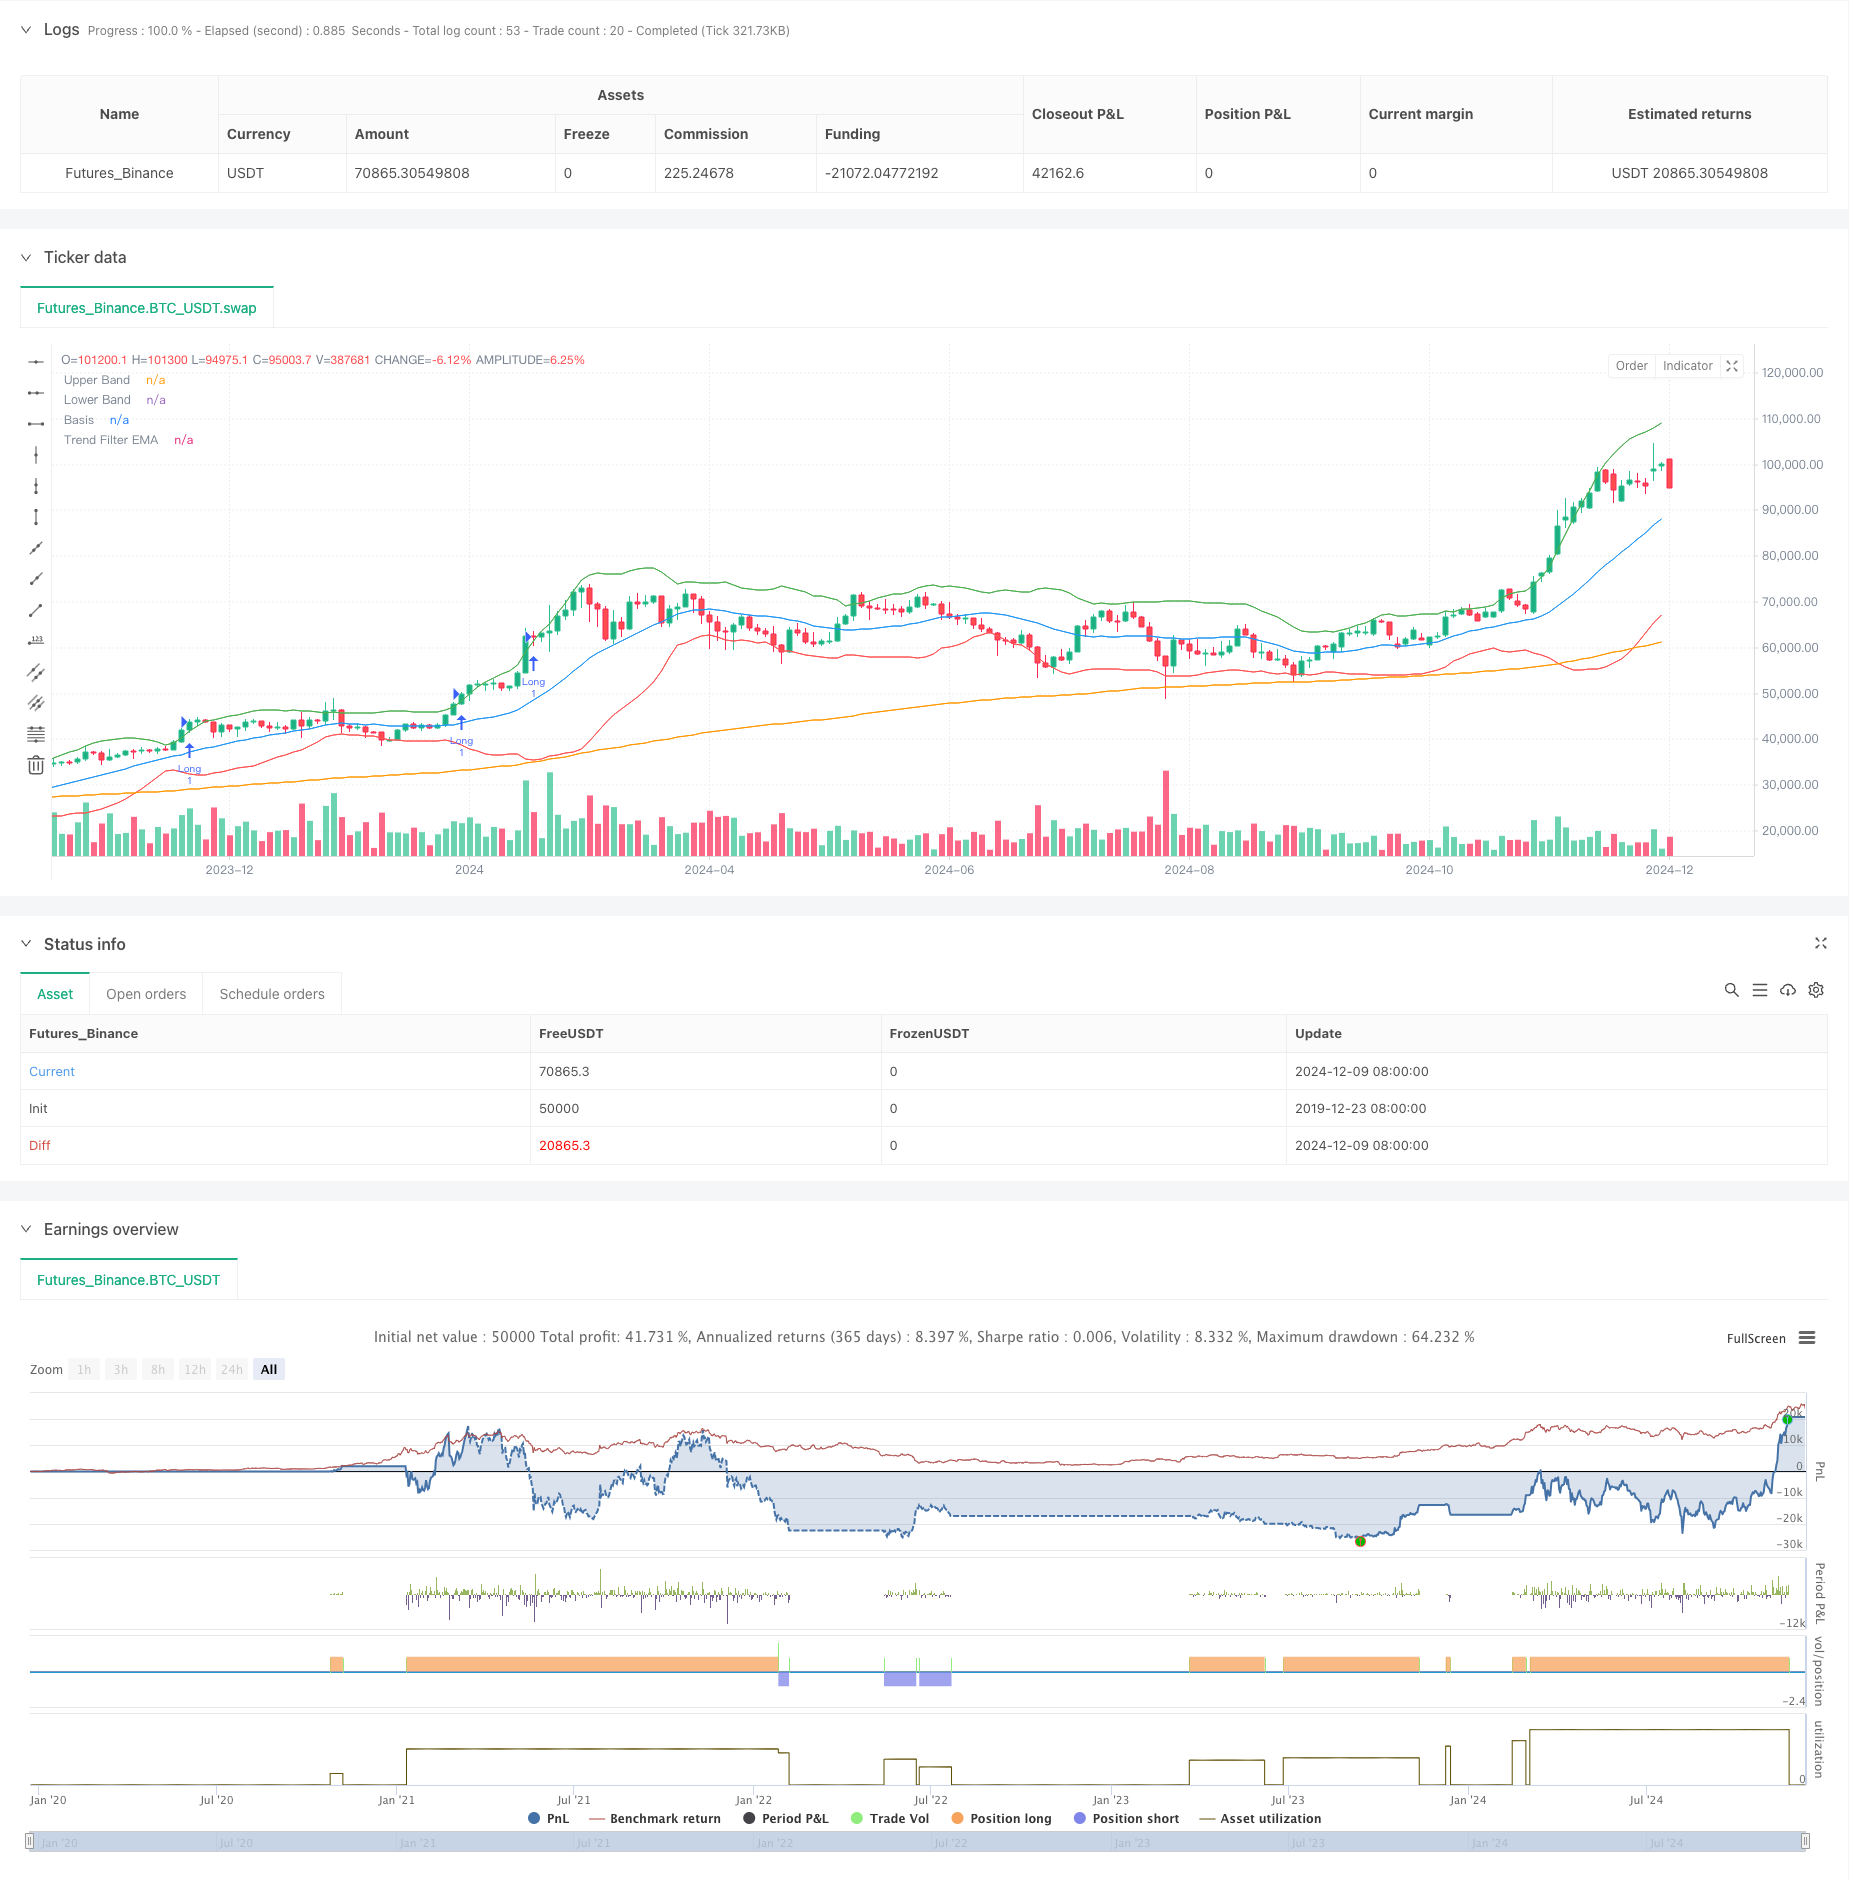
本策略是一个结合布林带、RSI指标和200周期EMA趋势过滤器的高级量化交易系统。该策略通过多重技术指标的协同配合,在趋势方向上捕捉高概率的突破机会,同时有效过滤震荡市场中的虚假信号。系统采用动态止损和基于风险收益比的获利目标设置,旨在实现稳健的交易表现。
|
|
|
|
#### 策略原理
|
|
策略核心逻辑基于以下三个层面:
|
|
1. 布林带突破信号:利用布林带上下轨作为波动率通道,价格突破上轨视为做多信号,突破下轨视为做空信号。
|
|
2. RSI动量确认:RSI位于50以上确认做多动量,位于50以下确认做空动量,避免在无趋势时交易。
|
|
3. EMA趋势过滤:利用200周期EMA判断主趋势,只在趋势方向上开仓。价格在EMA之上做多,之下做空。
|
|
|
|
交易确认需要满足:
|
|
- 连续两根K线维持突破状态
|
|
- 成交量高于20周期均值
|
|
- 动态止损基于ATR值计算
|
|
- 获利目标基于1.5倍风险收益比设置
|
|
|
|
#### 策略优势
|
|
1. 多重技术指标协同过滤,显著提高信号质量
|
|
2. 动态的仓位管理机制,根据市场波动度自适应调整
|
|
3. 严格的交易确认机制,有效降低虚假信号
|
|
4. 完整的风险控制体系,包括动态止损和固定风险收益比
|
|
5. 灵活的参数优化空间,可适应不同市场环境
|
|
|
|
#### 策略风险
|
|
1. 参数优化过度可能导致过拟合
|
|
2. 剧烈波动市场可能触发频繁止损
|
|
3. 震荡市场可能产生连续亏损
|
|
4. 趋势转折点处信号滞后
|
|
5. 技术指标之间可能出现矛盾信号
|
|
|
|
风险控制建议:
|
|
- 严格执行止损纪律
|
|
- 控制单次交易风险
|
|
- 定期回测验证参数有效性
|
|
- 结合基本面分析
|
|
- 避免过度交易
|
|
|
|
#### 策略优化方向
|
|
1. 引入更多技术指标互相验证
|
|
2. 开发自适应参数优化机制
|
|
3. 增加市场情绪指标
|
|
4. 优化交易确认机制
|
|
5. 开发更灵活的仓位管理系统
|
|
|
|
主要优化思路:
|
|
- 根据不同市场周期动态调整参数
|
|
- 增加交易过滤条件
|
|
- 优化风险收益比设置
|
|
- 完善止损机制
|
|
- 开发更智能的信号确认系统
|
|
|
|
#### 总结
|
|
该策略通过布林带、RSI和EMA等技术指标的有机结合,构建了一个完整的交易系统。系统在保证交易质量的同时,通过严格的风险控制和灵活的参数优化空间,展现出较强的实战应用价值。建议交易者在实盘中谨慎验证参数,严格执行交易纪律,持续优化策略表现。 ||
|
|
|
|
#### Overview
|
|
This strategy is an advanced quantitative trading system combining Bollinger Bands, RSI indicator, and 200-period EMA trend filter. Through the synergy of multiple technical indicators, it captures high-probability breakout opportunities in trend direction while effectively filtering false signals in oscillating markets. The system employs dynamic stop-loss and profit targets based on risk-reward ratio to achieve robust trading performance.
|
|
|
|
#### Strategy Principle
|
|
The core logic is based on three levels:
|
|
1. Bollinger Bands breakout signals: Using Bollinger Bands as volatility channels, price breaks above upper band signal long entries, breaks below lower band signal short entries.
|
|
2. RSI momentum confirmation: RSI above 50 confirms bullish momentum, below 50 confirms bearish momentum, avoiding trades without trend.
|
|
3. EMA trend filtering: Using 200-period EMA to determine main trend, only trading in trend direction. Long above EMA, short below EMA.
|
|
|
|
Trade confirmation requires:
|
|
- Breakout conditions maintained for two consecutive candles
|
|
- Volume above 20-period average
|
|
- Dynamic stop-loss calculated based on ATR
|
|
- Profit target set at 1.5 times risk-reward ratio
|
|
|
|
#### Strategy Advantages
|
|
1. Multiple technical indicators synergize to significantly improve signal quality
|
|
2. Dynamic position management mechanism adapts to market volatility
|
|
3. Strict trade confirmation mechanism effectively reduces false signals
|
|
4. Complete risk control system including dynamic stop-loss and fixed risk-reward ratio
|
|
5. Flexible parameter optimization space adaptable to different market environments
|
|
|
|
#### Strategy Risks
|
|
1. Excessive parameter optimization may lead to overfitting
|
|
2. Volatile markets may trigger frequent stop-losses
|
|
3. Oscillating markets may produce consecutive losses
|
|
4. Signals lag at trend turning points
|
|
5. Technical indicators may produce contradictory signals
|
|
|
|
Risk control suggestions:
|
|
- Strictly execute stop-loss discipline
|
|
- Control single trade risk
|
|
- Regular backtest parameter validity
|
|
- Integrate fundamental analysis
|
|
- Avoid overtrading
|
|
|
|
#### Strategy Optimization Directions
|
|
1. Introduce more technical indicators for cross-validation
|
|
2. Develop adaptive parameter optimization mechanism
|
|
3. Add market sentiment indicators
|
|
4. Optimize trade confirmation mechanism
|
|
5. Develop more flexible position management system
|
|
|
|
Main optimization approaches:
|
|
- Dynamically adjust parameters based on different market cycles
|
|
- Add trading filters
|
|
- Optimize risk-reward ratio settings
|
|
- Improve stop-loss mechanism
|
|
- Develop smarter signal confirmation system
|
|
|
|
#### Summary
|
|
This strategy constructs a complete trading system through organic combination of Bollinger Bands, RSI and EMA technical indicators. While ensuring trading quality, the system demonstrates strong practical value through strict risk control and flexible parameter optimization space. Traders are advised to carefully validate parameters in live trading, strictly execute trading discipline, and continuously optimize strategy performance.[/trans]
|
|
|
|
|
|
|
|
> Source (PineScript)
|
|
|
|
``` pinescript
|
|
/*backtest
|
|
start: 2019-12-23 08:00:00
|
|
end: 2024-12-10 08:00:00
|
|
period: 2d
|
|
basePeriod: 2d
|
|
exchanges: [{"eid":"Futures_Binance","currency":"BTC_USDT"}]
|
|
*/
|
|
|
|
//@version=5
|
|
strategy("Improved Bollinger Breakout with Trend Filtering", overlay=true)
|
|
|
|
// === Inputs ===
|
|
length = input(20, title="Bollinger Bands Length", tooltip="The number of candles used to calculate the Bollinger Bands. Higher values smooth the bands, lower values make them more reactive.")
|
|
mult = input(2.0, title="Bollinger Bands Multiplier", tooltip="Controls the width of the Bollinger Bands. Higher values widen the bands, capturing more price movement.")
|
|
rsi_length = input(14, title="RSI Length", tooltip="The number of candles used to calculate the RSI. Shorter lengths make it more sensitive to recent price movements.")
|
|
rsi_midline = input(50, title="RSI Midline", tooltip="Defines the midline for RSI to confirm momentum. Higher values make it stricter for bullish conditions.")
|
|
risk_reward_ratio = input(1.5, title="Risk/Reward Ratio", tooltip="Determines the take-profit level relative to the stop-loss.")
|
|
atr_multiplier = input(1.5, title="ATR Multiplier for Stop-Loss", tooltip="Defines the distance of the stop-loss based on ATR. Higher values set wider stop-losses.")
|
|
volume_filter = input(true, title="Enable Volume Filter", tooltip="If enabled, trades will only execute when volume exceeds the 20-period average.")
|
|
trend_filter_length = input(200, title="Trend Filter EMA Length", tooltip="The EMA length used to filter trades based on the market trend.")
|
|
trade_direction = input.string("Both", title="Trade Direction", options=["Long", "Short", "Both"], tooltip="Choose whether to trade only Long, only Short, or Both directions.")
|
|
confirm_candles = input(2, title="Number of Confirming Candles", tooltip="The number of consecutive candles that must meet the conditions before entering a trade.")
|
|
|
|
// === Indicator Calculations ===
|
|
basis = ta.sma(close, length)
|
|
dev = mult * ta.stdev(close, length)
|
|
upper_band = basis + dev
|
|
lower_band = basis - dev
|
|
rsi_val = ta.rsi(close, rsi_length)
|
|
atr_val = ta.atr(14)
|
|
vol_filter = volume > ta.sma(volume, 20)
|
|
ema_trend = ta.ema(close, trend_filter_length)
|
|
|
|
// === Helper Function for Confirmation ===
|
|
confirm_condition(cond, lookback) =>
|
|
count = 0
|
|
for i = 0 to lookback - 1
|
|
count += cond[i] ? 1 : 0
|
|
count == lookback
|
|
|
|
// === Trend Filter ===
|
|
trend_is_bullish = close > ema_trend
|
|
trend_is_bearish = close < ema_trend
|
|
|
|
// === Long and Short Conditions with Confirmation ===
|
|
long_raw_condition = close > upper_band * 1.01 and rsi_val > rsi_midline and (not volume_filter or vol_filter) and trend_is_bullish
|
|
short_raw_condition = close < lower_band * 0.99 and rsi_val < rsi_midline and (not volume_filter or vol_filter) and trend_is_bearish
|
|
|
|
long_condition = confirm_condition(long_raw_condition, confirm_candles)
|
|
short_condition = confirm_condition(short_raw_condition, confirm_candles)
|
|
|
|
// === Trade Entry and Exit Logic ===
|
|
if long_condition and (trade_direction == "Long" or trade_direction == "Both")
|
|
strategy.entry("Long", strategy.long)
|
|
strategy.exit("Exit Long", "Long", stop=close - (atr_multiplier * atr_val), limit=close + (atr_multiplier * risk_reward_ratio * atr_val))
|
|
|
|
if short_condition and (trade_direction == "Short" or trade_direction == "Both")
|
|
strategy.entry("Short", strategy.short)
|
|
strategy.exit("Exit Short", "Short", stop=close + (atr_multiplier * atr_val), limit=close - (atr_multiplier * risk_reward_ratio * atr_val))
|
|
|
|
// === Plotting ===
|
|
plot(upper_band, color=color.green, title="Upper Band")
|
|
plot(lower_band, color=color.red, title="Lower Band")
|
|
plot(basis, color=color.blue, title="Basis")
|
|
plot(ema_trend, color=color.orange, title="Trend Filter EMA")
|
|
|
|
```
|
|
|
|
> Detail
|
|
|
|
https://www.fmz.com/strategy/474844
|
|
|
|
> Last Modified
|
|
|
|
2024-12-12 14:55:37
|