
17 KiB
Name
布林带结合快速与慢速移动平均线的多维趋势强化量化交易策略-Bollinger-Bands-with-Dual-SMA-Momentum-Enhanced-Quantitative-Trading-Strategy
Author
ianzeng123
Strategy Description
[trans]
概述
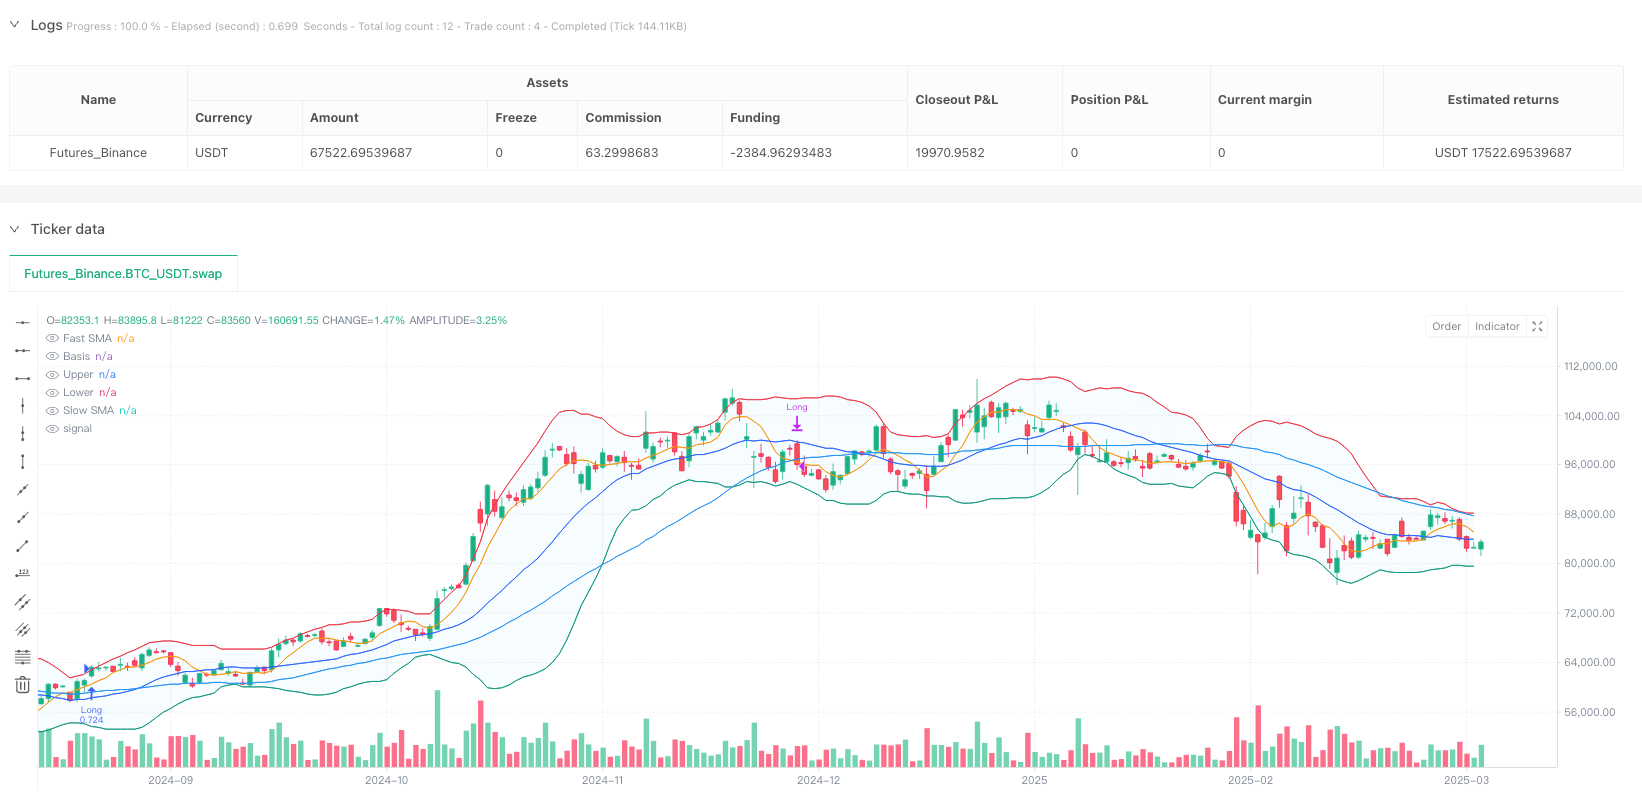
布林带结合快速与慢速移动平均线的多维趋势强化量化交易策略是一种专为市场波动设计的趋势跟踪系统。该策略巧妙地整合了布林带的波动率通道与双重移动平均线的趋势确认机制,形成了一个多重条件筛选的交易决策框架。策略核心在于捕捉价格突破布林带上轨的强势信号,并通过快速与慢速移动平均线的位置关系来确认趋势方向,仅在多重条件同时满足时才进入多头仓位,从而提高了交易的准确性和可靠性。
策略原理
该策略的技术原理建立在三大核心指标的协同作用上:
-
布林带系统: 策略采用21周期的布林带,标准差倍数为2.0,可根据参数设置灵活选择基准移动平均线类型(SMA、EMA、SMMA、WMA或VWMA)。布林带通过捕捉价格波动的范围,为交易提供波动率视角的参考。
-
双重移动平均线系统: 策略引入了6周期的快速简单移动平均线(Fast SMA)和45周期的慢速简单移动平均线(Slow SMA),形成双均线系统。这两条移动平均线的交叉和位置关系可以有效识别和确认当前趋势的方向与强度。
-
多重条件入场机制: 策略仅在满足以下全部条件时才建立多头仓位:
- 收盘价突破布林带上轨(close > upper)
- 收盘价位于慢速移动平均线上方(close > slowSma)
- 快速移动平均线位于慢速移动平均线上方(fastSma > slowSma)
这种多重条件的设计确保了只有在强势上涨趋势得到多重技术指标确认的情况下才会进场,有效过滤了假突破和弱势信号。
平仓条件同样基于明确的技术指标信号,当收盘价跌破布林带下轨或快速移动平均线跌破慢速移动平均线时,策略将自动平仓退出。这种设计使得策略能够及时止损或锁定利润,避免趋势反转带来的损失。
策略优势
-
多重信号确认机制: 结合布林带突破和双均线趋势确认,显著减少了假突破信号,提高了交易的质量和成功率。
-
自适应波动性: 布林带的设计本身具有对市场波动率的自适应特性,在高波动环境中通道会自然扩大,在低波动环境中自然收窄,使策略能够适应不同市场环境。
-
趋势强度验证: 通过要求价格不仅要突破布林带上轨,还必须位于慢速均线上方,同时快速均线要超过慢速均线,这三重条件确保了只有强势趋势才会触发交易。
-
灵活的参数配置: 策略允许用户调整布林带长度、移动平均线类型、标准差倍数以及快慢均线周期,可以根据不同市场条件和个人交易风格进行优化调整。
-
清晰的入场和出场逻辑: 策略的交易规则简洁明确,入场和出场条件都基于客观的技术指标,减少了主观判断的影响。
策略风险
-
趋势延迟识别: 布林带和移动平均线都是滞后指标,在剧烈波动的市场中可能导致入场时机偏晚,错过部分行情初期的收益。解决方法可以适当缩短快速移动平均线的周期或调整布林带参数。
-
频繁交易风险: 在震荡行情中,价格可能频繁突破布林带上轨又回落,导致多次交易而增加交易成本。可以通过增加额外的过滤条件或延长确认周期来减少假信号。
-
单向交易限制: 当前策略仅支持多头交易,在下跌趋势中无法获利,导致资金利用率不足。可以考虑增加空头交易策略,实现双向交易。
-
参数敏感性: 策略性能高度依赖于参数设置,不同市场环境可能需要不同的参数组合。建议进行充分的回测和参数优化,或采用自适应参数调整机制。
-
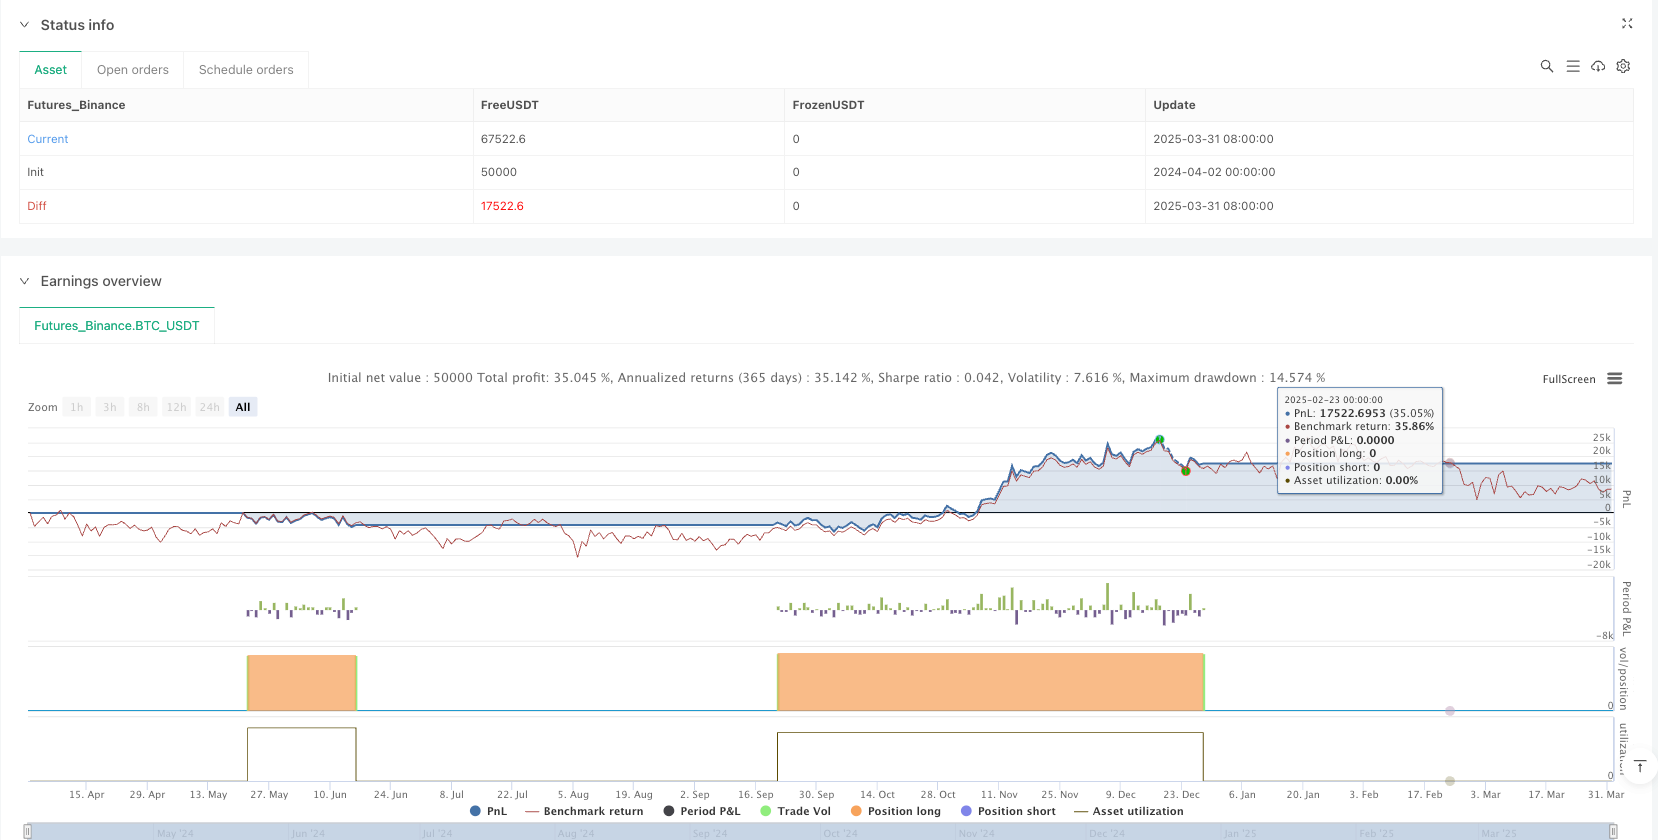
交易成本影响: 策略设定的0.1%的佣金和3点滑点可能在实际交易中有所不同,影响实际收益。应根据实际交易平台的费率结构进行调整和测试。
策略优化方向
-
增加过滤条件: 可以考虑增加交易量确认、趋势强度指标(如ADX)或价格形态识别等额外条件,进一步提高信号质量。例如,可以要求布林带突破时伴随成交量放大,或ADX值大于特定阈值。
-
优化资金管理: 当前策略使用100%的账户资金进行交易,可以考虑引入风险百分比模型或波动率调整的仓位管理,根据市场波动性和信号强度动态调整仓位大小。
-
增加时间框架验证: 可以引入多时间框架分析,要求在更高时间框架上也确认趋势方向,以减少震荡行情中的误判。比如,要求日线和4小时图同时满足趋势条件。
-
引入动态止损策略: 可以基于ATR(平均真实波幅)设置动态止损位,或使用移动止损(如跟踪布林带中轨或慢速移动平均线),以更好地保护利润。
-
增加双向交易能力: 扩展策略以支持空头交易,当满足相反条件时(价格跌破布林带下轨且快速均线低于慢速均线)建立空头仓位,充分利用下跌趋势获利。
-
参数自适应机制: 开发基于市场状态的参数动态调整机制,在不同波动率和趋势强度环境下自动优化布林带和移动平均线参数,提高策略的适应性。
总结
布林带结合快速与慢速移动平均线的多维趋势强化量化交易策略通过整合波动率和趋势指标,构建了一个多层次的交易决策系统。策略核心优势在于多重条件确认机制,显著提高了信号质量和可靠性。尽管存在一定的滞后性和参数敏感性问题,但通过合理的风险管理和参数优化,该策略可以在趋势明确的市场中取得稳健表现。
进一步优化可以从增加过滤条件、完善资金管理、引入多时间框架分析以及开发参数自适应机制等方面入手,使策略更加全面和稳健。综合来看,这是一个结构清晰、逻辑严谨的趋势跟踪策略,适合对技术分析有一定了解的交易者使用,尤其是在中长期趋势明确的市场环境中。 ||
Overview
The Bollinger Bands with Dual SMA Momentum Enhanced Quantitative Trading Strategy is a trend-following system specifically designed for market volatility. This strategy cleverly integrates the volatility channel of Bollinger Bands with a dual moving average trend confirmation mechanism, forming a multi-condition filtering trading decision framework. The core of the strategy lies in capturing strong signals when prices break through the upper Bollinger Band, and confirming trend direction through the positional relationship between fast and slow moving averages. It only enters long positions when multiple conditions are simultaneously satisfied, thereby improving trading accuracy and reliability.
Strategy Principles
The technical principles of this strategy are built on the synergistic effect of three core indicators:
-
Bollinger Bands System: The strategy employs a 21-period Bollinger Band with a standard deviation multiplier of 2.0, and flexibly allows selection of the basis moving average type (SMA, EMA, SMMA, WMA, or VWMA) based on parameter settings. Bollinger Bands capture the range of price volatility, providing a volatility perspective reference for trading.
-
Dual Moving Average System: The strategy introduces a 6-period Fast Simple Moving Average (Fast SMA) and a 45-period Slow Simple Moving Average (Slow SMA), forming a dual moving average system. The crossover and positional relationship between these two moving averages can effectively identify and confirm the current trend's direction and strength.
-
Multi-Condition Entry Mechanism: The strategy only establishes long positions when all the following conditions are met:
- Closing price breaks above the upper Bollinger Band (close > upper)
- Closing price is above the Slow Moving Average (close > slowSma)
- Fast Moving Average is above the Slow Moving Average (fastSma > slowSma)
This multi-condition design ensures that positions are only entered when a strong upward trend is confirmed by multiple technical indicators, effectively filtering out false breakouts and weak signals.
The position closing conditions are similarly based on clear technical indicator signals. When the closing price falls below the lower Bollinger Band or the Fast Moving Average drops below the Slow Moving Average, the strategy will automatically close positions. This design enables the strategy to cut losses or lock in profits in a timely manner, avoiding losses caused by trend reversals.
Strategy Advantages
-
Multiple Signal Confirmation Mechanism: Combining Bollinger Band breakouts with dual moving average trend confirmation significantly reduces false breakout signals, improving trade quality and success rate.
-
Adaptive Volatility: The design of Bollinger Bands inherently possesses adaptive characteristics for market volatility. The channel naturally widens in high-volatility environments and narrows in low-volatility environments, allowing the strategy to adapt to different market conditions.
-
Trend Strength Verification: By requiring not only that the price breaks through the upper Bollinger Band, but also that it is above the slow moving average, and simultaneously that the fast moving average exceeds the slow moving average, these triple conditions ensure that only strong trends trigger trades.
-
Flexible Parameter Configuration: The strategy allows users to adjust Bollinger Band length, moving average type, standard deviation multiplier, and fast/slow moving average periods, enabling optimization adjustments based on different market conditions and personal trading styles.
-
Clear Entry and Exit Logic: The trading rules of the strategy are concise and explicit, with entry and exit conditions based on objective technical indicators, reducing the influence of subjective judgment.
Strategy Risks
-
Delayed Trend Identification: Bollinger Bands and moving averages are lagging indicators, which may lead to delayed entry timing in highly volatile markets, missing some of the early gains. A solution could be to appropriately shorten the period of the fast moving average or adjust Bollinger Band parameters.
-
Frequent Trading Risk: In oscillating markets, prices may frequently break through the upper Bollinger Band and then fall back, leading to multiple trades and increased transaction costs. This can be mitigated by adding additional filtering conditions or extending the confirmation period to reduce false signals.
-
Unidirectional Trading Limitation: The current strategy only supports long trades, unable to profit in downtrend markets, resulting in insufficient capital utilization. Consider adding short trading strategies to implement bidirectional trading.
-
Parameter Sensitivity: Strategy performance is highly dependent on parameter settings, and different market environments may require different parameter combinations. It is recommended to conduct thorough backtesting and parameter optimization, or adopt an adaptive parameter adjustment mechanism.
-
Transaction Cost Impact: The strategy's set 0.1% commission and 3-point slippage may differ in actual trading, affecting real returns. Adjustments and testing should be done according to the actual fee structure of the trading platform.
Strategy Optimization Directions
-
Add Filtering Conditions: Consider adding additional conditions such as volume confirmation, trend strength indicators (like ADX), or price pattern recognition to further improve signal quality. For example, require increased trading volume when Bollinger Bands break out, or ADX values greater than a specific threshold.
-
Optimize Capital Management: The current strategy uses 100% of account funds for trading. Consider introducing risk percentage models or volatility-adjusted position management to dynamically adjust position size based on market volatility and signal strength.
-
Add Timeframe Verification: Introduce multi-timeframe analysis, requiring trend direction confirmation on higher timeframes to reduce misjudgments in oscillating markets. For instance, require trend conditions to be met simultaneously on daily and 4-hour charts.
-
Introduce Dynamic Stop-Loss Strategy: Set dynamic stop-loss levels based on ATR (Average True Range), or use trailing stops (such as following the Bollinger Band middle line or slow moving average) to better protect profits.
-
Add Bidirectional Trading Capability: Extend the strategy to support short trading, establishing short positions when opposite conditions are met (price breaks below the lower Bollinger Band and fast moving average is below slow moving average), fully utilizing downtrend profits.
-
Parameter Adaptive Mechanism: Develop a parameter dynamic adjustment mechanism based on market states, automatically optimizing Bollinger Bands and moving average parameters in different volatility and trend strength environments to improve strategy adaptability.
Conclusion
The Bollinger Bands with Dual SMA Momentum Enhanced Quantitative Trading Strategy integrates volatility and trend indicators to build a multi-level trading decision system. The core advantage of the strategy lies in its multiple condition confirmation mechanism, significantly improving signal quality and reliability. Despite certain lagging and parameter sensitivity issues, with proper risk management and parameter optimization, this strategy can achieve solid performance in markets with clear trends.
Further optimizations can be approached from aspects such as adding filtering conditions, improving capital management, introducing multi-timeframe analysis, and developing parameter adaptive mechanisms to make the strategy more comprehensive and robust. Overall, this is a clearly structured and logically rigorous trend-following strategy, suitable for traders with a certain understanding of technical analysis, especially in medium to long-term trend-oriented market environments.[/trans]
Source (PineScript)
/*backtest
start: 2024-04-02 00:00:00
end: 2025-04-01 00:00:00
period: 1d
basePeriod: 1d
exchanges: [{"eid":"Futures_Binance","currency":"BTC_USDT"}]
*/

//@version=6
strategy("BTC Bollinger Bands w Fast and Slow SMAs", overlay=true, commission_value=0.1, slippage=3, default_qty_type=strategy.percent_of_equity, default_qty_value=100)

length = input.int(21, minval=1)
fastSmaLength = input.int(6, title="Fast SMA Length", minval=1)  // Fast SMA with default 20
slowSmaLength = input.int(45, title="Slow SMA Length", minval=1)  // Slow SMA with default 60
maType = input.string("SMA", "Basis MA Type", options=["SMA", "EMA", "SMMA (RMA)", "WMA", "VWMA"])
src = input(close, title="Source")
mult = input.float(2.0, minval=0.001, maxval=50, title="StdDev")

// Calculate SMAs dynamically
fastSma = ta.sma(src, fastSmaLength)  // Fast SMA
slowSma = ta.sma(src, slowSmaLength)  // Slow SMA

// Bollinger Bands Calculation
ma(source, length, _type) =>
    switch _type
        "SMA" => ta.sma(source, length)
        "EMA" => ta.ema(source, length)
        "SMMA (RMA)" => ta.rma(source, length)
        "WMA" => ta.wma(source, length)
        "VWMA" => ta.vwma(source, length)

basis = ma(src, length, maType)
dev = mult * ta.stdev(src, length)
upper = basis + dev
lower = basis - dev

offset = input.int(0, "Offset", minval=-500, maxval=500)

// Plotting the bands, basis, and both dynamic SMAs
plot(basis, "Basis", color=#2962FF, offset=offset)
p1 = plot(upper, "Upper", color=#F23645, offset=offset)
p2 = plot(lower, "Lower", color=#089981, offset=offset)
plot(fastSma, "Fast SMA", color=color.orange, offset=offset)  // Plot the Fast SMA
plot(slowSma, "Slow SMA", color=color.blue, offset=offset)  // Plot the Slow SMA
fill(p1, p2, title="Background", color=color.rgb(33, 150, 243, 95))

// Strategy logic: Open long position when the price closes above the upper Bollinger Band,
// the price is above the Slow SMA, and the Fast SMA is above the Slow SMA

// Condition to open a long position:
// 1. Price closes above the upper Bollinger Band
// 2. Price is above the Slow SMA
// 3. Fast SMA is above Slow SMA
if (close > upper and close > slowSma and fastSma > slowSma)
    // Open Long position on the next candle's open
    strategy.entry("Long", strategy.long)  // Open Long on the current candle

// Condition to close the long position: previous close below the lower Bollinger Band or Fast SMA is below Slow SMA
if (close < lower or fastSma < slowSma)
    // Close Long on the next candle's open
    strategy.close("Long")  // Close Long on the next bar's open
Detail
https://www.fmz.com/strategy/489156
Last Modified
2025-04-02 11:28:15