
187 lines
8.8 KiB
Markdown
187 lines
8.8 KiB
Markdown
|
|
> Name
|
|
|
|
布林带反转与移动平均线趋势过滤Bollinger-Bands-Reversal-with-MA-Trend-Filter
|
|
|
|
> Author
|
|
|
|
ChaoZhang
|
|
|
|
> Strategy Description
|
|
|
|
|
|
[trans]
|
|
|
|
## 概述
|
|
|
|
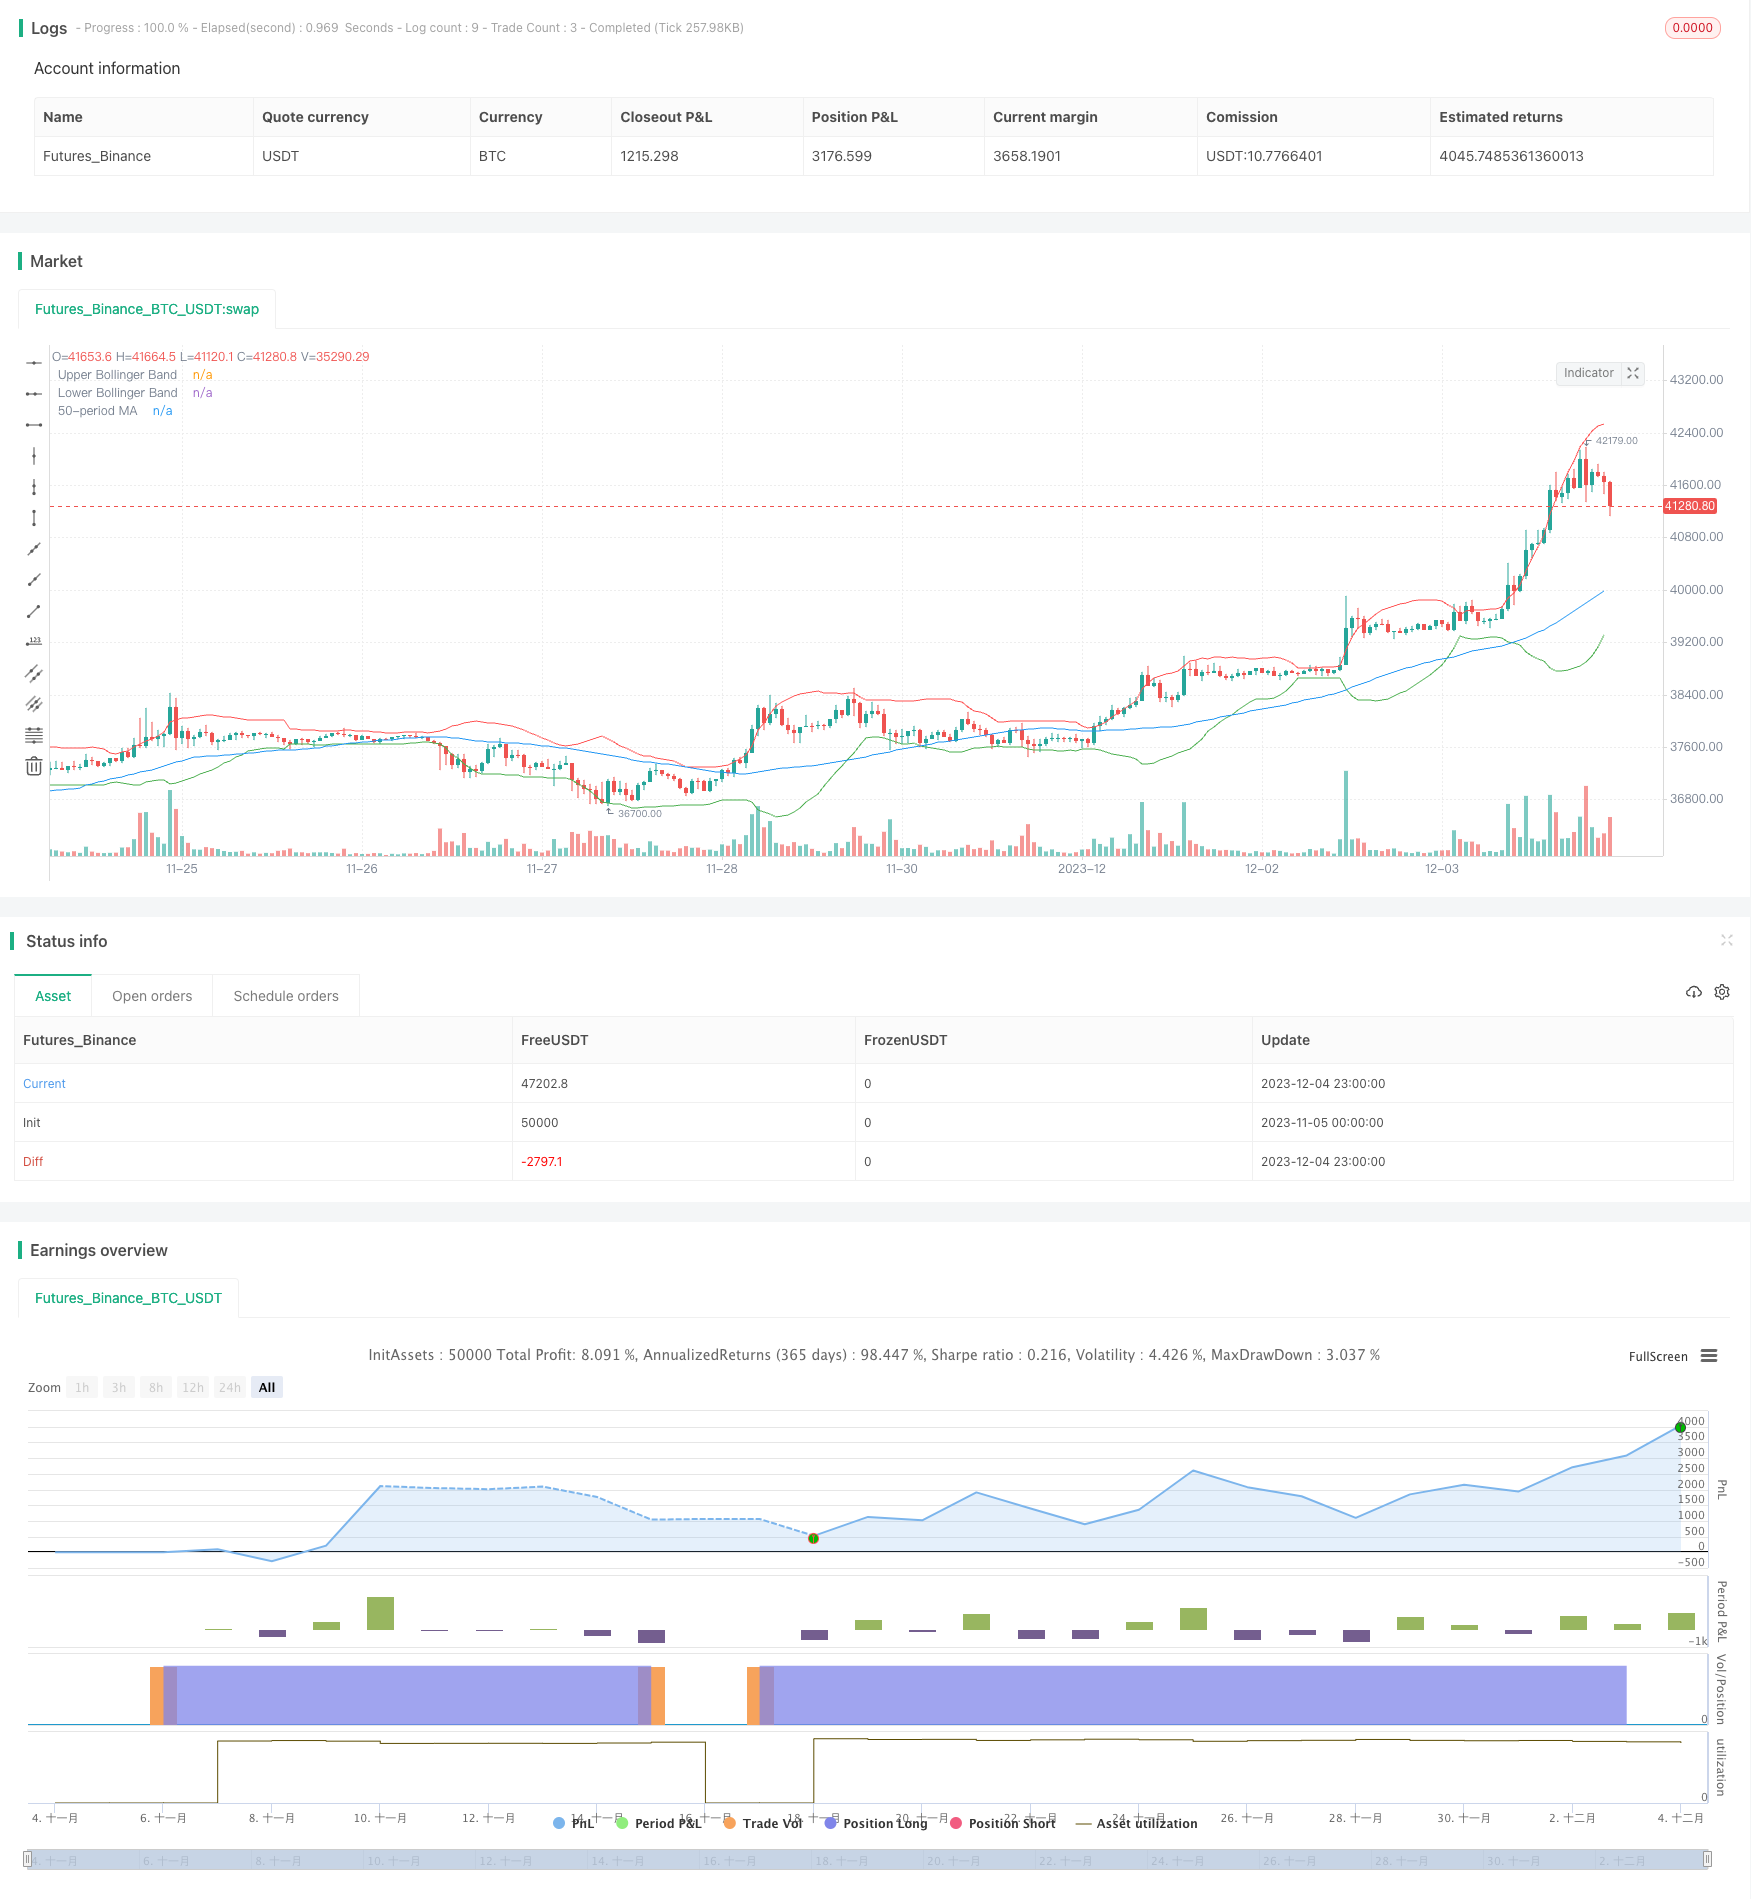
该策略结合了布林带和移动平均线,利用布林带上下轨反转点和移动平均线方向作为入场和出场信号。具体来说,当价格从下向上突破布林带下轨且高于移动平均线时,做多;当价格从上向下突破布林带上轨且低于移动平均线时,平仓。
|
|
|
|
## 策略原理
|
|
|
|
该策略主要基于布林带和移动平均线两个指标。
|
|
|
|
布林带包含上带、下带和中轨。中轨是n天的简单移动平均线,上下带分别是中轨上下k倍标准差。当价格接近上下带时表示过度买入或卖出,这时可能会产生反转。
|
|
|
|
移动平均线反映了价格的平均趋势方向。当短期移动平均线上穿长期移动平均线时,表示价格走势由下向上,可以考虑做多;而短期移动平均线下穿长期移动平均线时,表示价格走势由上向下,可以考虑做空。
|
|
|
|
该策略综合考虑了布林带反转信号和移动平均线的趋势判断。价格突破布林带下轨时产生买入信号,而且要求移动平均线上升以确保大趋势为上涨;价格突破布林带上轨时产生卖出信号,而且要求移动平均线下降以确保大趋势为下跌。这样就实现了在反转的同时考量大的趋势方向。
|
|
|
|
具体操作规则如下:
|
|
|
|
1. 当价格从下向上突破布林带下轨且高于移动平均线时,做多
|
|
2. 当价格从上向下突破布林带上轨且低于移动平均线时,平仓
|
|
|
|
## 优势分析
|
|
|
|
该策略主要优势有:
|
|
|
|
1. 综合考虑了中短期反转信号和长期趋势方向,符合多空双边操作的需要
|
|
2. 利用布林带上下轨反转性较强,可以获得较好的入场机会
|
|
3. 增加移动平均线过滤,避免在震荡行情中被套利
|
|
4. 策略逻辑简单清晰,容易理解实现,适合量化交易
|
|
|
|
## 风险及解决
|
|
|
|
该策略主要风险有:
|
|
|
|
1. 布林带参数设置不当,上下轨突破产生的交易信号可能频繁,容易被套。可以通过优化参数,找到最佳参数组合。
|
|
2. 移动平均线参数设置不当,可能过滤掉较好的交易机会。可以考虑结合其他指标进行优化。
|
|
3. 行情可能出现长时间的震荡,导致亏损加大。可以设置止损点,让单个亏损控制在一定范围。
|
|
|
|
## 策略优化
|
|
|
|
该策略主要可优化的方向:
|
|
|
|
1. 优化布林带参数,找到产生交易信号最优参数组合
|
|
2. 尝试不同类型、长度的参数移动平均线,寻找最匹配的组合
|
|
3. 增加其他指标判断,例如成交量,RSI等,提高策略效果
|
|
4. 建立动态止损机制,能够根据市场波动幅度来设置止损点
|
|
5. 测试不同品种参数设置效果,寻找最佳品种适应性
|
|
|
|
## 总结
|
|
|
|
该策略综合考虑布林带反转信号和移动平均线趋势判断,在保证反转效果的同时控制了局部震荡对总体趋势判断的影响。策略信号产生及原理简单清晰,容易理解实现,且可以通过多种方式进行优化提高效果,是一种适合量化交易的有效策略。
|
|
|
|
||
|
|
|
|
## Overview
|
|
|
|
This strategy combines Bollinger Bands and Moving Average, using the reversal points of Bollinger Bands' upper and lower rails and the direction of Moving Average as entry and exit signals. Specifically, when the price breaks through the lower rail of Bollinger Bands upwards and is higher than Moving Average, go long; when the price breaks through the upper rail of Bollinger Bands downwards and is lower than Moving Average, close position.
|
|
|
|
## Strategy Principle
|
|
|
|
This strategy is mainly based on two indicators: Bollinger Bands and Moving Average.
|
|
|
|
Bollinger Bands contain upper band, lower band and middle rail. The middle rail is the n-day simple moving average, and the upper and lower bands are k times standard deviation up and down from the middle rail. When the price approaches the upper or lower band, it indicates overbuying or overselling, which may result in a reversal.
|
|
|
|
Moving average reflects the average trend direction of prices. When the short-term moving average crosses above the long-term moving average, it indicates the price trend is upgoing, so going long can be considered; when the short-term moving average crosses below the long-term moving average, it indicates the price trend is downgoing, so going short can be considered.
|
|
|
|
This strategy takes into account both the reversal signals from Bollinger Bands and the trend judgment from Moving Average. It generates buy signals when prices break through the lower band of Bollinger Bands, and also requires the Moving Average to go upwards to ensure an upward major trend; it generates sell signals when prices break through the upper band of Bollinger Bands, and also requires the Moving Average to go downwards to ensure a downward major trend. Thus it realizes considering major trend directions while capturing reversals.
|
|
|
|
The specific operation rules are:
|
|
|
|
1. When price breaks through the lower band of Bollinger Bands upwards and is higher than Moving Average, go long.
|
|
2. When price breaks through the upper band of Bollinger Bands downwards and is lower than Moving Average, close position.
|
|
|
|
## Advantage Analysis
|
|
|
|
The main advantages of this strategy include:
|
|
|
|
1. Taking both medium-term reversal signals and long-term trend directions into consideration, meeting the needs for dual-directional operations.
|
|
2. Utilizing the strong reversal nature of Bollinger Bands' upper and lower rails to obtain better entry opportunities.
|
|
3. Adding Moving Average filter to avoid whipsaws in sideways markets.
|
|
4. The strategy logic is simple and clear, easy to understand and implement, suitable for quantitative trading.
|
|
|
|
## Risks and Solutions
|
|
|
|
The main risks of this strategy include:
|
|
|
|
1. Improper parameter settings for Bollinger Bands may result in too frequent trading signals from upper and lower bands breakouts, causing whipsaws easily. Parameters can be optimized to find the best combination.
|
|
2. Improper parameter settings for Moving Average may filter some good trading opportunities. Other indicators can be considered to combine with for optimization.
|
|
3. Markets may have long sideways consolidations, enlarging losses. Stop loss points can be set to limit individual losses within certain range.
|
|
|
|
## Strategy Optimization
|
|
|
|
The main aspects this strategy can optimize on:
|
|
|
|
1. Optimize parameters for Bollinger Bands to find the optimal parameter combination for producing trading signals.
|
|
2. Try different types and lengths of parameters for Moving Average to find the best match.
|
|
3. Add judgments from other indicators such as volume, RSI etc. to improve strategy performance.
|
|
4. Build dynamic stop loss mechanisms that set stop loss points according to market volatility ranges.
|
|
5. Test parameter settings on different products to find optimal adaptability.
|
|
|
|
## Summary
|
|
|
|
This strategy takes both the reversal signals from Bollinger Bands and trend judgments from Moving Average into consideration, controlling the impact of local shocks on overall trend judgments while ensuring reversal effectiveness. The signals and principles are simple and clear, easy to understand and implement, and there are multiple ways to optimize for better performance, making it an efficient strategy suitable for quantitative trading.
|
|
|
|
[/trans]
|
|
|
|
> Strategy Arguments
|
|
|
|
|
|
|
|
|Argument|Default|Description|
|
|
|----|----|----|
|
|
|v_input_1|20|Bollinger Bands Length|
|
|
|v_input_2_close|0|Source: close|high|low|open|hl2|hlc3|hlcc4|ohlc4|
|
|
|v_input_3|2|Standard Deviation|
|
|
|v_input_4|50|MA Length|
|
|
|v_input_5_close|0|MA Source: close|high|low|open|hl2|hlc3|hlcc4|ohlc4|
|
|
|
|
|
|
> Source (PineScript)
|
|
|
|
``` pinescript
|
|
/*backtest
|
|
start: 2023-11-05 00:00:00
|
|
end: 2023-12-05 00:00:00
|
|
period: 1h
|
|
basePeriod: 15m
|
|
exchanges: [{"eid":"Futures_Binance","currency":"BTC_USDT"}]
|
|
*/
|
|
|
|
//@version=5
|
|
strategy("Bollinger Bands Rejection with MA Trend Filter", overlay=true)
|
|
|
|
// Bollinger Bands Settings
|
|
length = input(20, title="Bollinger Bands Length")
|
|
src = input(close, title="Source")
|
|
mult = input(2.0, title="Standard Deviation")
|
|
basis = ta.sma(src, length)
|
|
dev = mult * ta.stdev(src, length)
|
|
|
|
// Calculate Bollinger Bands
|
|
upper_band = basis + dev
|
|
lower_band = basis - dev
|
|
|
|
// MA Settings
|
|
ma_length = input(50, title="MA Length")
|
|
ma_src = input(close, title="MA Source")
|
|
ma = ta.sma(ma_src, ma_length)
|
|
|
|
// Buy Condition
|
|
buy_condition = ta.crossover(close, lower_band) and ta.crossover(close, ma)
|
|
|
|
// Sell Condition
|
|
sell_condition = ta.crossunder(close, upper_band) and ta.crossunder(close, ma)
|
|
|
|
if buy_condition
|
|
strategy.entry("Buy", strategy.long)
|
|
|
|
if sell_condition
|
|
strategy.close("Buy")
|
|
|
|
plot(upper_band, color=color.red, title="Upper Bollinger Band")
|
|
plot(lower_band, color=color.green, title="Lower Bollinger Band")
|
|
plot(ma, color=color.blue, title="50-period MA")
|
|
|
|
```
|
|
|
|
> Detail
|
|
|
|
https://www.fmz.com/strategy/434482
|
|
|
|
> Last Modified
|
|
|
|
2023-12-06 17:34:51
|