
203 lines
11 KiB
Markdown
203 lines
11 KiB
Markdown
|
|
> Name
|
|
|
|
布林带动量交叉策略-Bollinger-Bands-Momentum-Crossover-Strategy
|
|
|
|
> Author
|
|
|
|
ChaoZhang
|
|
|
|
> Strategy Description
|
|
|
|
|
|
|
|
[trans]
|
|
#### 概述
|
|
|
|
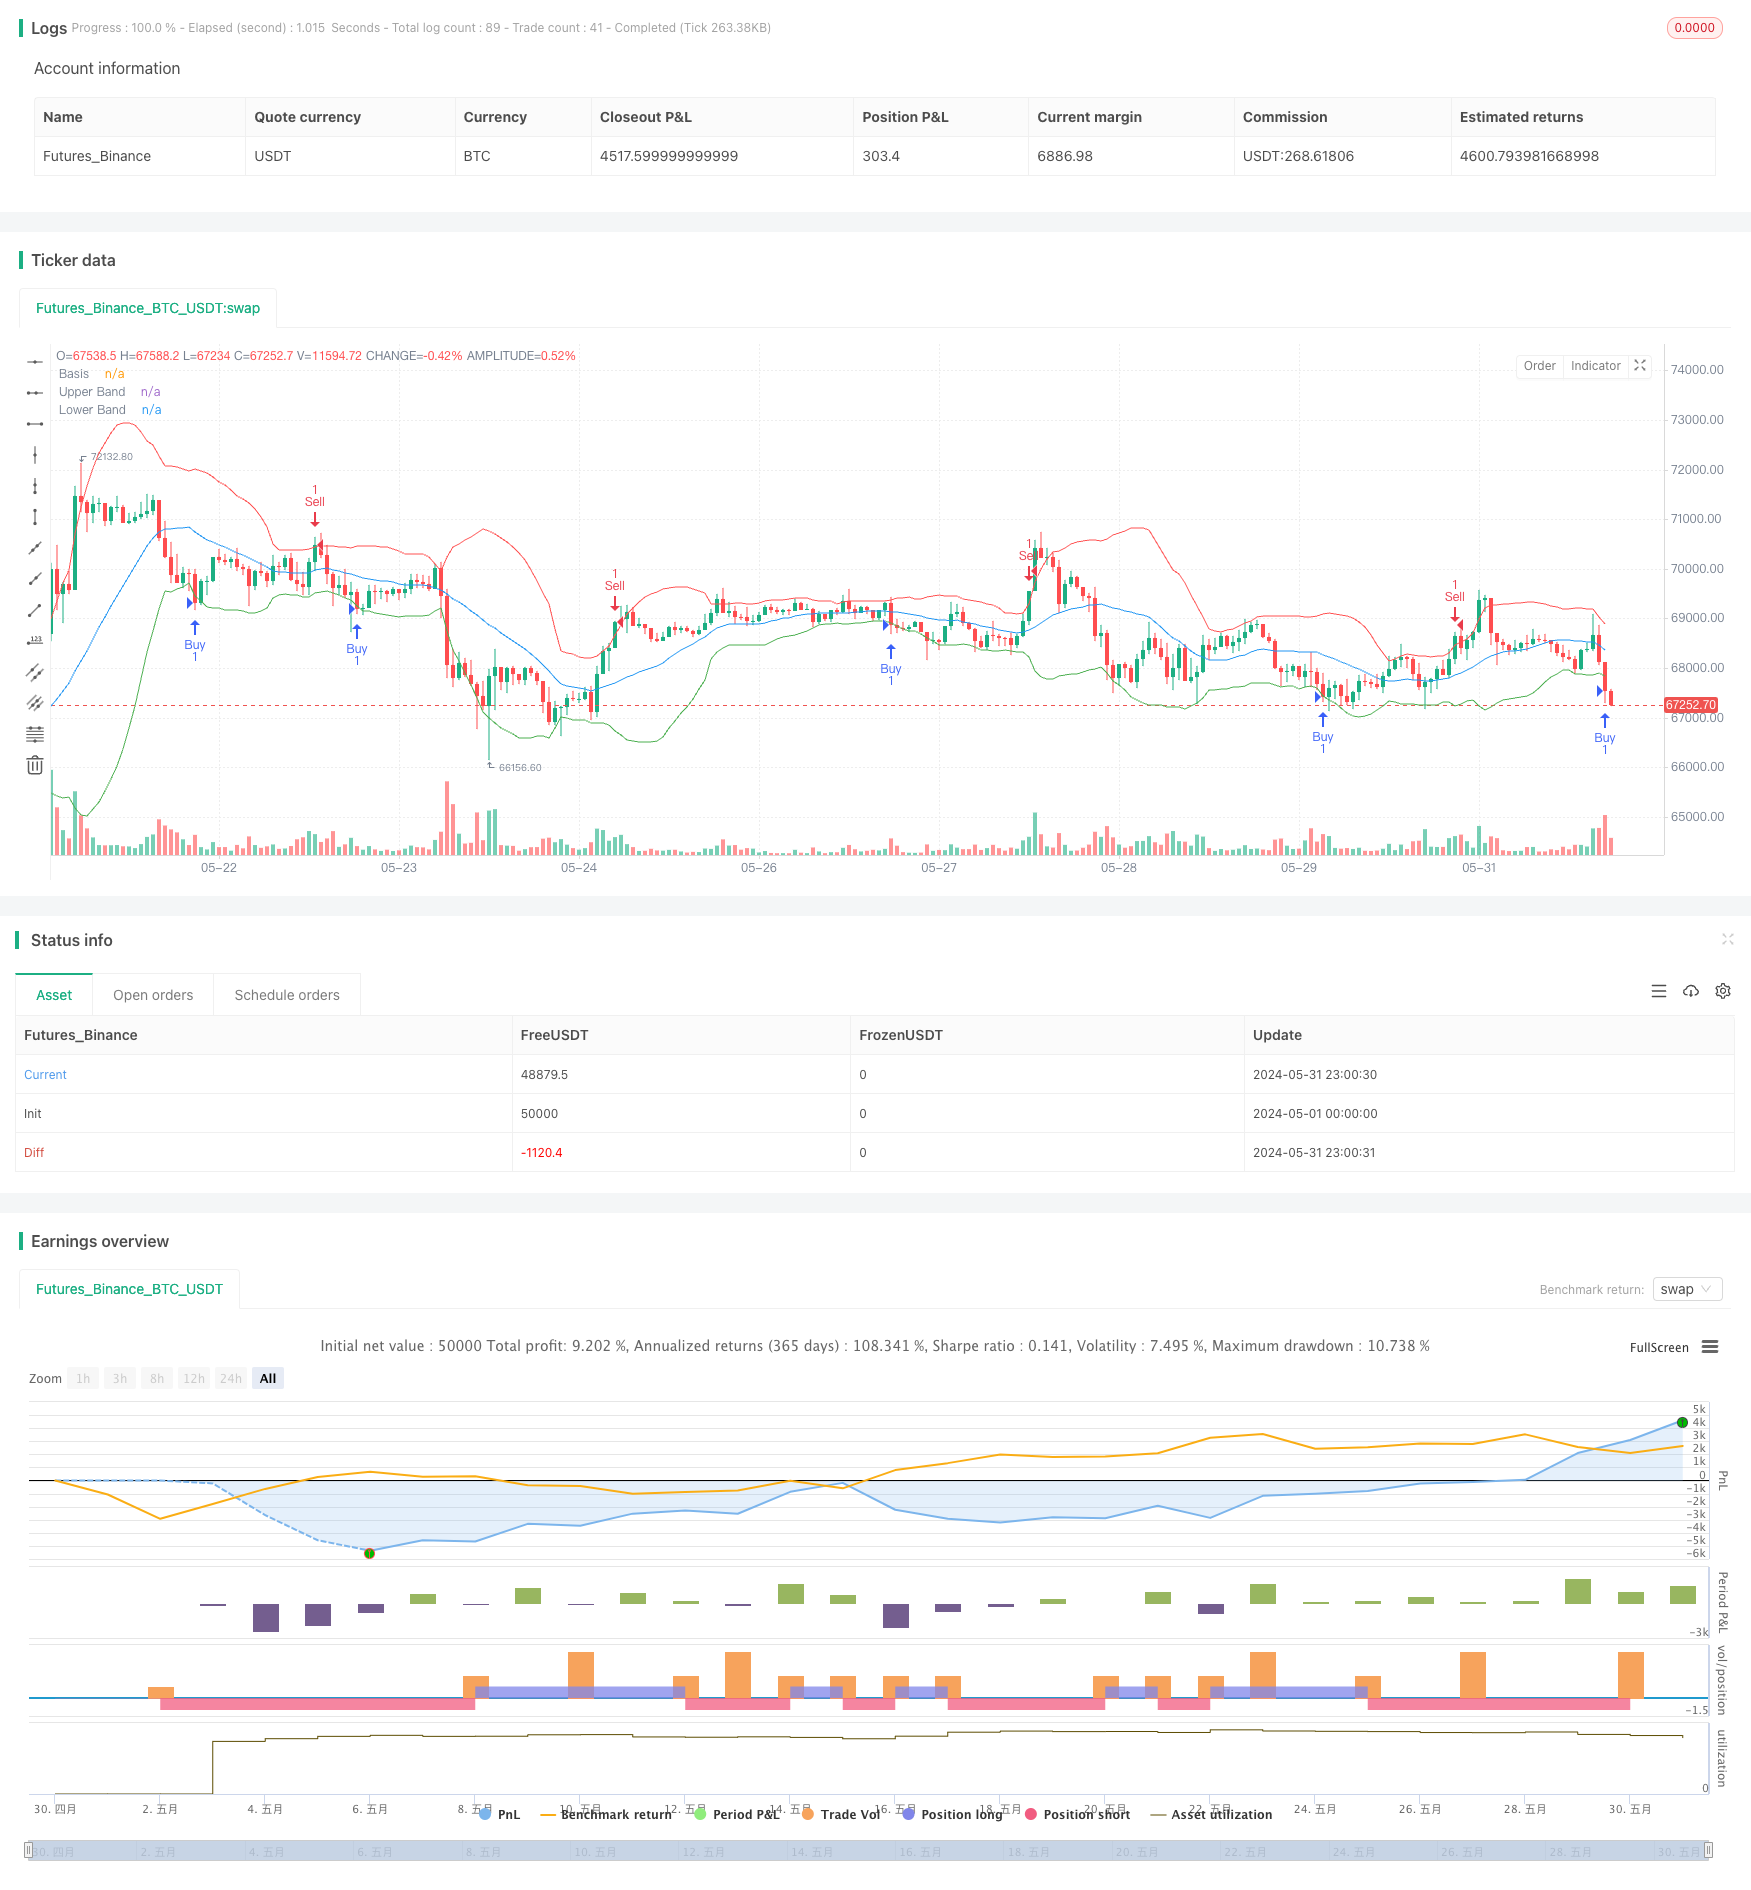
布林带动量交叉策略是一种基于技术分析的交易方法,结合了布林带指标和价格动量的概念。该策略主要利用价格与布林带上下轨的交叉来生成买卖信号,旨在捕捉市场的超买和超卖机会。通过观察价格是否突破布林带的上下轨,交易者可以识别潜在的反转点,从而在市场波动中获利。
|
|
|
|
#### 策略原理
|
|
|
|
该策略的核心原理是利用布林带来衡量市场波动性和价格偏离程度。布林带由三条线组成:中轨(简单移动平均线)、上轨(中轨加上标准差的倍数)和下轨(中轨减去标准差的倍数)。策略的具体逻辑如下:
|
|
|
|
1. 计算布林带:使用20期简单移动平均线作为中轨,上下轨距离中轨2倍标准差。
|
|
2. 买入信号:当收盘价低于下轨时,认为市场可能超卖,触发买入信号。
|
|
3. 卖出信号:当收盘价高于上轨时,认为市场可能超买,触发卖出信号。
|
|
4. 平仓逻辑:当持有多头仓位时,如果出现卖出信号,则平掉多头;当持有空头仓位时,如果出现买入信号,则平掉空头。
|
|
|
|
策略通过设置变量in_long和in_short来跟踪当前持仓状态,确保不会重复开仓,并在适当的时候平仓。
|
|
|
|
#### 策略优势
|
|
|
|
1. 趋势跟随与反转结合:该策略既可以捕捉趋势延续(当价格在上轨或下轨附近运行时),又可以捕捉潜在的反转(当价格突破布林带时)。
|
|
|
|
2. 自适应性强:布林带会根据市场波动性自动调整宽度,使策略能够适应不同市场环境。
|
|
|
|
3. 风险控制:通过在价格突破布林带时开仓,策略在一定程度上控制了入场风险。
|
|
|
|
4. 清晰的入场和出场信号:策略提供了明确的买卖信号,减少了主观判断的影响。
|
|
|
|
5. 可视化支持:策略在图表上绘制了布林带,便于交易者直观地分析市场状况。
|
|
|
|
#### 策略风险
|
|
|
|
1. 假突破风险:价格可能短暂突破布林带后又回归,导致错误信号。
|
|
|
|
2. 趋势市场表现欠佳:在强烈趋势市场中,价格可能长期运行在布林带外,导致频繁交易和潜在损失。
|
|
|
|
3. 滞后性:由于使用了移动平均线,策略在市场快速变化时可能反应较慢。
|
|
|
|
4. 参数敏感性:布林带的期数和标准差倍数对策略性能影响较大,需要仔细调优。
|
|
|
|
5. 缺乏止损机制:当前策略没有明确的止损设置,可能导致在市场剧烈波动时承受较大损失。
|
|
|
|
#### 策略优化方向
|
|
|
|
1. 引入额外确认指标:可以结合其他技术指标(如RSI或MACD)来过滤交易信号,提高准确性。
|
|
|
|
2. 动态调整参数:可以根据市场波动性自动调整布林带的期数和标准差倍数,以适应不同市场环境。
|
|
|
|
3. 添加止损和止盈机制:设置基于ATR或固定点数的止损止盈,控制风险和锁定利润。
|
|
|
|
4. 优化入场时机:可以考虑在价格回测布林带时入场,而不是直接在突破时入场,以减少假突破风险。
|
|
|
|
5. 引入交易量分析:结合成交量指标,可以帮助确认突破的有效性,提高交易成功率。
|
|
|
|
6. 时间过滤:添加时间过滤条件,避免在波动较大或流动性较差的时段交易。
|
|
|
|
7. 考虑市场状态:根据布林带宽度或其他指标判断市场是否处于趋势或震荡状态,采用不同的交易策略。
|
|
|
|
#### 总结
|
|
|
|
布林带动量交叉策略是一种结合了均值回归和趋势跟随理念的交易方法。通过利用价格与布林带的关系,该策略旨在捕捉市场的超买超卖机会和潜在反转点。虽然策略具有自适应性强、信号明确等优势,但也面临假突破和趋势市场表现欠佳等风险。为了提高策略的稳健性和盈利能力,可以考虑引入额外的确认指标、优化参数设置、添加风险管理机制等方法。在实际应用中,交易者需要根据具体市场环境和个人风险偏好对策略进行持续优化和回测,以获得最佳的交易效果。
|
|
|
|
||
|
|
|
|
#### Overview
|
|
|
|
The Bollinger Bands Momentum Crossover Strategy is a technical analysis-based trading method that combines the Bollinger Bands indicator with price momentum concepts. This strategy primarily uses the crossover of price with the upper and lower Bollinger Bands to generate buy and sell signals, aiming to capture overbought and oversold market opportunities. By observing whether the price breaks through the upper or lower bands of the Bollinger Bands, traders can identify potential reversal points and profit from market fluctuations.
|
|
|
|
#### Strategy Principles
|
|
|
|
The core principle of this strategy is to use Bollinger Bands to measure market volatility and price deviation. Bollinger Bands consist of three lines: the middle band (simple moving average), the upper band (middle band plus a multiple of standard deviation), and the lower band (middle band minus a multiple of standard deviation). The specific logic of the strategy is as follows:
|
|
|
|
1. Calculate Bollinger Bands: Use a 20-period simple moving average as the middle band, with upper and lower bands 2 standard deviations away from the middle band.
|
|
2. Buy signal: When the closing price is below the lower band, the market is considered potentially oversold, triggering a buy signal.
|
|
3. Sell signal: When the closing price is above the upper band, the market is considered potentially overbought, triggering a sell signal.
|
|
4. Position closing logic: When holding a long position, if a sell signal appears, close the long position; when holding a short position, if a buy signal appears, close the short position.
|
|
|
|
The strategy uses variables in_long and in_short to track the current position status, ensuring that positions are not repeatedly opened and are closed at appropriate times.
|
|
|
|
#### Strategy Advantages
|
|
|
|
1. Combination of trend following and reversal: This strategy can capture both trend continuation (when price moves near the upper or lower bands) and potential reversals (when price breaks through the Bollinger Bands).
|
|
|
|
2. Strong adaptability: Bollinger Bands automatically adjust their width according to market volatility, allowing the strategy to adapt to different market environments.
|
|
|
|
3. Risk control: By opening positions when the price breaks through the Bollinger Bands, the strategy controls entry risk to some extent.
|
|
|
|
4. Clear entry and exit signals: The strategy provides clear buy and sell signals, reducing the impact of subjective judgment.
|
|
|
|
5. Visualization support: The strategy plots Bollinger Bands on the chart, allowing traders to visually analyze market conditions.
|
|
|
|
#### Strategy Risks
|
|
|
|
1. False breakout risk: Prices may briefly break through the Bollinger Bands and then return, leading to false signals.
|
|
|
|
2. Poor performance in trending markets: In strongly trending markets, prices may run outside the Bollinger Bands for extended periods, resulting in frequent trading and potential losses.
|
|
|
|
3. Lag: Due to the use of moving averages, the strategy may react slowly to rapid market changes.
|
|
|
|
4. Parameter sensitivity: The period and standard deviation multiplier of the Bollinger Bands significantly impact strategy performance and require careful optimization.
|
|
|
|
5. Lack of stop-loss mechanism: The current strategy does not have explicit stop-loss settings, which may lead to significant losses during extreme market volatility.
|
|
|
|
#### Strategy Optimization Directions
|
|
|
|
1. Introduce additional confirmation indicators: Combine other technical indicators (such as RSI or MACD) to filter trading signals and improve accuracy.
|
|
|
|
2. Dynamic parameter adjustment: Automatically adjust the Bollinger Bands period and standard deviation multiplier based on market volatility to adapt to different market environments.
|
|
|
|
3. Add stop-loss and take-profit mechanisms: Set stop-loss and take-profit levels based on ATR or fixed points to control risk and lock in profits.
|
|
|
|
4. Optimize entry timing: Consider entering positions when the price retests the Bollinger Bands instead of entering directly on breakouts to reduce false breakout risk.
|
|
|
|
5. Incorporate volume analysis: Combine volume indicators to help confirm the validity of breakouts and improve trade success rates.
|
|
|
|
6. Time filtering: Add time filtering conditions to avoid trading during highly volatile or low liquidity periods.
|
|
|
|
7. Consider market conditions: Use Bollinger Band width or other indicators to determine whether the market is in a trending or ranging state, and adopt different trading strategies accordingly.
|
|
|
|
#### Conclusion
|
|
|
|
The Bollinger Bands Momentum Crossover Strategy is a trading method that combines mean reversion and trend-following concepts. By leveraging the relationship between price and Bollinger Bands, this strategy aims to capture market overbought and oversold opportunities and potential reversal points. While the strategy has advantages such as strong adaptability and clear signals, it also faces risks like false breakouts and poor performance in trending markets. To improve the strategy's robustness and profitability, consider introducing additional confirmation indicators, optimizing parameter settings, and adding risk management mechanisms. In practical application, traders need to continuously optimize and backtest the strategy based on specific market environments and individual risk preferences to achieve the best trading results.
|
|
|
|
[/trans]
|
|
|
|
|
|
|
|
> Source (PineScript)
|
|
|
|
``` pinescript
|
|
/*backtest
|
|
start: 2024-05-01 00:00:00
|
|
end: 2024-05-31 23:59:59
|
|
period: 1h
|
|
basePeriod: 15m
|
|
exchanges: [{"eid":"Futures_Binance","currency":"BTC_USDT"}]
|
|
*/
|
|
|
|
//@version=5
|
|
strategy("Bollinger Bands Strategy", overlay=true)
|
|
|
|
// Input parameters
|
|
length = input.int(20, title="BB Length")
|
|
src = input(close, title="Source")
|
|
mult = input.float(2.0, title="BB Mult")
|
|
|
|
// Calculate Bollinger Bands
|
|
basis = ta.sma(src, length)
|
|
dev = mult * ta.stdev(src, length)
|
|
|
|
upper_band = basis + dev
|
|
lower_band = basis - dev
|
|
|
|
// Plotting Bollinger Bands
|
|
plot(basis, title="Basis", color=color.blue)
|
|
plot(upper_band, title="Upper Band", color=color.red)
|
|
plot(lower_band, title="Lower Band", color=color.green)
|
|
|
|
// Buy and Sell conditions
|
|
buy_condition = close < lower_band
|
|
sell_condition = close > upper_band
|
|
|
|
// Strategy logic
|
|
var in_long = false
|
|
var in_short = false
|
|
|
|
if buy_condition and not in_long
|
|
strategy.entry("Buy", strategy.long)
|
|
in_long := true
|
|
|
|
if sell_condition and not in_short
|
|
strategy.entry("Sell", strategy.short)
|
|
in_short := true
|
|
|
|
if in_long and sell_condition
|
|
strategy.close("Buy")
|
|
in_long := false
|
|
|
|
if in_short and buy_condition
|
|
strategy.close("Sell")
|
|
in_short := false
|
|
|
|
```
|
|
|
|
> Detail
|
|
|
|
https://www.fmz.com/strategy/454732
|
|
|
|
> Last Modified
|
|
|
|
2024-06-21 14:12:29
|