
221 lines
11 KiB
Markdown
221 lines
11 KiB
Markdown
|
|
> Name
|
|
|
|
布林带交叉与滑点价格影响组合策略-Bollinger-Band-Crossover-with-Slippage-and-Price-Impact-Combined-Strategy
|
|
|
|
> Author
|
|
|
|
ChaoZhang
|
|
|
|
> Strategy Description
|
|
|
|
|
|
|
|
[trans]
|
|
#### 概述
|
|
|
|
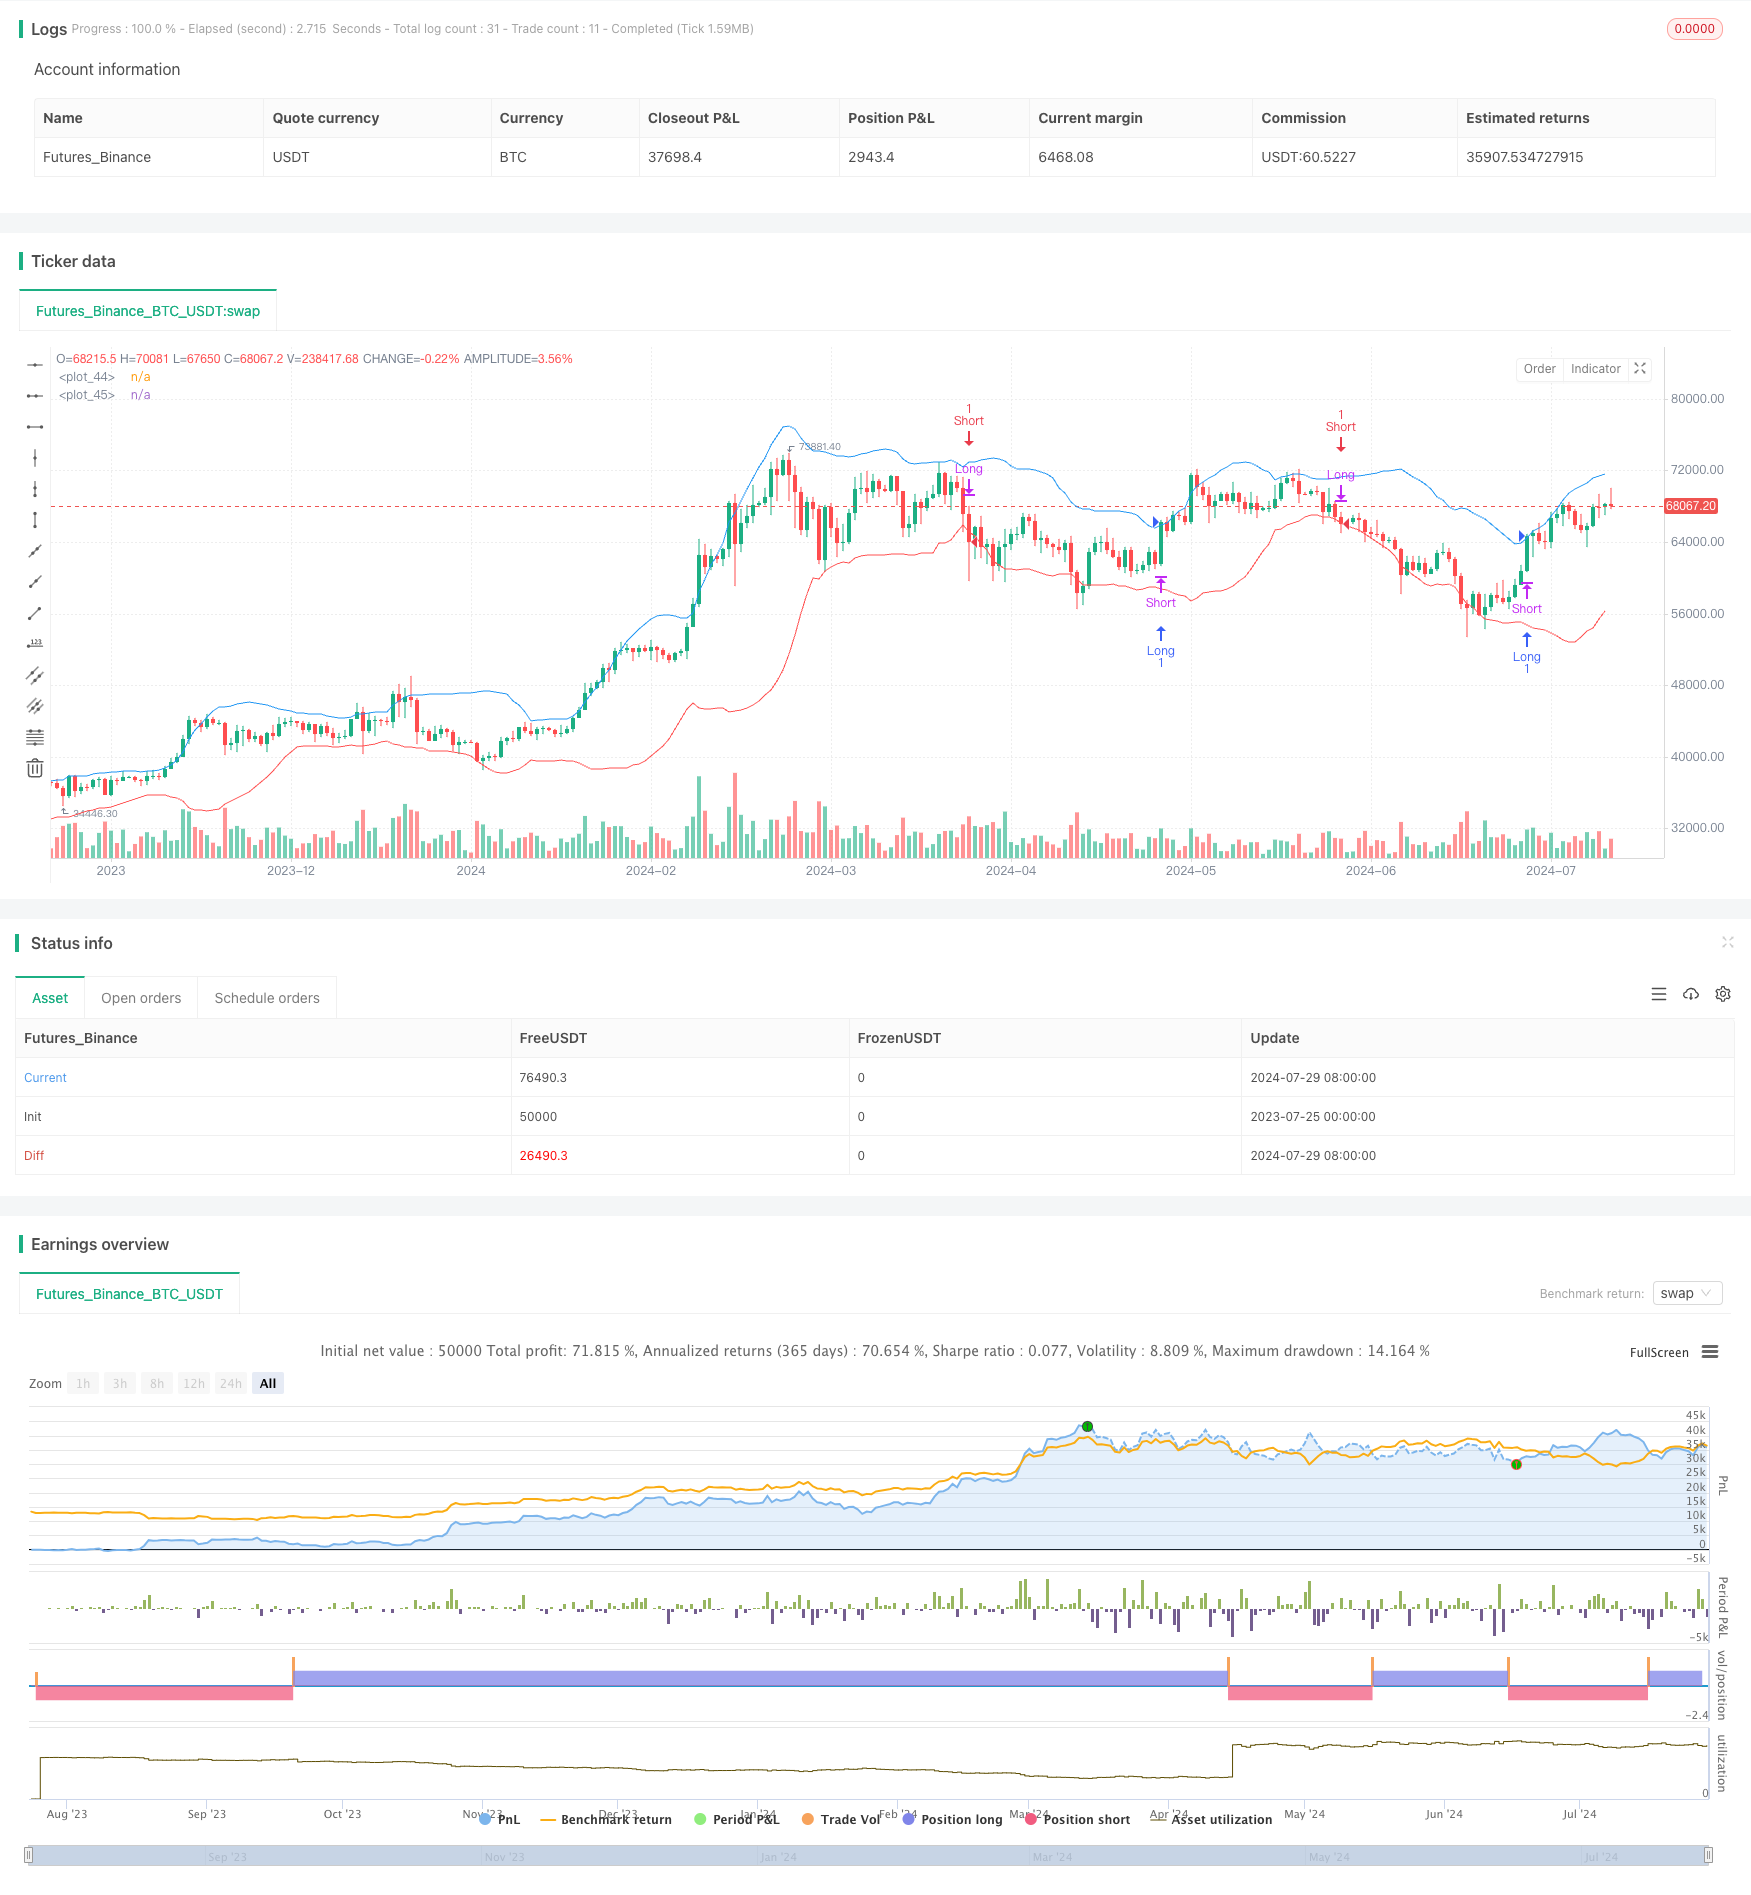
本策略是一个基于布林带交叉信号和考虑滑点及价格影响的综合交易系统。它利用布林带的上下轨来识别潜在的超买和超卖区域,同时在执行交易时考虑了滑点和价格影响因素,以更好地模拟真实市场条件下的交易情况。这种方法旨在提高交易策略的可靠性和实用性,特别适用于波动性较大的市场环境。
|
|
|
|
#### 策略原理
|
|
|
|
1. 布林带计算:
|
|
- 使用20周期的简单移动平均线(SMA)作为中轨。
|
|
- 上下轨为中轨加减2倍标准差。
|
|
|
|
2. 交易信号:
|
|
- 当价格突破上轨时,触发做多信号。
|
|
- 当价格跌破下轨时,触发做空信号。
|
|
|
|
3. 滑点和价格影响调整:
|
|
- 考虑40%的滑点和40%的价格影响。
|
|
- 买入价格 = 当前价格 + 滑点调整 + 价格影响调整
|
|
- 卖出价格 = 当前价格 - 滑点调整 - 价格影响调整
|
|
|
|
4. 平仓条件:
|
|
- 做多仓位在触发做空信号时平仓。
|
|
- 做空仓位在触发做多信号时平仓。
|
|
|
|
#### 策略优势
|
|
|
|
1. 市场波动适应性:布林带能够根据市场波动性自动调整,使策略在不同市场环境下都能保持有效性。
|
|
|
|
2. 趋势跟踪与反转结合:通过布林带交叉信号,策略既能捕捉趋势延续,又能抓住潜在的反转机会。
|
|
|
|
3. 实际交易成本考虑:纳入滑点和价格影响因素,使策略更贴近真实交易环境,提高了回测结果的可信度。
|
|
|
|
4. 风险管理:使用布林带作为动态支撑和阻力水平,有助于控制风险。
|
|
|
|
5. 灵活性:通过参数化设计,策略可以根据不同市场和交易品种进行优化调整。
|
|
|
|
#### 策略风险
|
|
|
|
1. 过度交易:在横盘市场中,价格可能频繁穿越布林带,导致过多不必要的交易。
|
|
|
|
2. 滞后性:布林带作为滞后指标,可能在快速趋势变化时反应不及时。
|
|
|
|
3. 高滑点和价格影响:40%的滑点和价格影响设置可能过高,导致实际交易难以执行或产生巨大损失。
|
|
|
|
4. 假突破风险:价格短暂突破布林带后又回落,可能引发错误的交易信号。
|
|
|
|
5. 缺乏附加确认:仅依赖布林带信号,缺少其他技术指标或基本面分析的确认。
|
|
|
|
#### 策略优化方向
|
|
|
|
1. 引入成交量指标:结合成交量分析可以帮助确认突破的有效性,减少假突破带来的风险。
|
|
|
|
2. 添加趋势过滤器:如使用长期移动平均线或ADX指标,以确保在主要趋势方向上进行交易。
|
|
|
|
3. 优化滑点和价格影响参数:根据实际市场数据调整滑点和价格影响百分比,使其更符合实际交易条件。
|
|
|
|
4. 实现动态止损:可以考虑使用ATR指标设置动态止损,以适应市场波动性的变化。
|
|
|
|
5. 加入时间过滤:避免在波动性较低的时段(如亚洲盘)进行交易,以减少噪音信号。
|
|
|
|
6. 优化布林带参数:尝试不同的布林带长度和乘数,找到最适合目标市场的设置。
|
|
|
|
7. 引入机器学习算法:利用机器学习技术优化入场和出场时机,提高策略的整体性能。
|
|
|
|
#### 总结
|
|
|
|
布林带交叉与滑点价格影响组合策略是一个结合了技术分析和实际交易考量的综合交易系统。通过布林带指标捕捉市场动向,并考虑滑点和价格影响,该策略旨在提供一个更贴近实际的交易方法。然而,策略仍存在一些潜在风险,如过度交易和假突破等问题。通过引入额外的确认指标、优化参数设置和加强风险管理,该策略有潜力成为一个更加稳健和可靠的交易系统。未来的优化方向应着重于提高信号质量、减少假突破、以及更好地适应不同市场条件。总的来说,这个策略为量化交易者提供了一个有趣的起点,可以在此基础上进行进一步的研究和改进。
|
|
|
|
||
|
|
|
|
#### Overview
|
|
|
|
This strategy is a comprehensive trading system based on Bollinger Band crossover signals that incorporates slippage and price impact considerations. It utilizes the upper and lower bands of the Bollinger Bands to identify potential overbought and oversold areas, while accounting for slippage and price impact factors when executing trades to better simulate real market conditions. This approach aims to enhance the reliability and practicality of the trading strategy, particularly suitable for markets with high volatility.
|
|
|
|
#### Strategy Principles
|
|
|
|
1. Bollinger Bands Calculation:
|
|
- Uses a 20-period Simple Moving Average (SMA) as the middle band.
|
|
- Upper and lower bands are set at 2 standard deviations above and below the middle band.
|
|
|
|
2. Trading Signals:
|
|
- A long signal is triggered when the price breaks above the upper band.
|
|
- A short signal is triggered when the price breaks below the lower band.
|
|
|
|
3. Slippage and Price Impact Adjustment:
|
|
- Considers 40% slippage and 40% price impact.
|
|
- Buy price = Current price + Slippage adjustment + Price impact adjustment
|
|
- Sell price = Current price - Slippage adjustment - Price impact adjustment
|
|
|
|
4. Position Closing Conditions:
|
|
- Long positions are closed when a short signal is triggered.
|
|
- Short positions are closed when a long signal is triggered.
|
|
|
|
#### Strategy Advantages
|
|
|
|
1. Market Volatility Adaptation: Bollinger Bands automatically adjust to market volatility, ensuring strategy effectiveness across different market environments.
|
|
|
|
2. Trend Following and Reversal Combination: Through Bollinger Band crossover signals, the strategy can capture both trend continuation and potential reversal opportunities.
|
|
|
|
3. Practical Trading Cost Consideration: Incorporating slippage and price impact factors makes the strategy more aligned with real trading environments, improving the credibility of backtesting results.
|
|
|
|
4. Risk Management: Using Bollinger Bands as dynamic support and resistance levels helps control risk.
|
|
|
|
5. Flexibility: The parameterized design allows for optimization and adjustment according to different markets and trading instruments.
|
|
|
|
#### Strategy Risks
|
|
|
|
1. Overtrading: In ranging markets, price may frequently cross the Bollinger Bands, leading to excessive unnecessary trades.
|
|
|
|
2. Lag: As a lagging indicator, Bollinger Bands may not react timely to rapid trend changes.
|
|
|
|
3. High Slippage and Price Impact: The 40% slippage and price impact settings may be too high, making actual trades difficult to execute or potentially causing significant losses.
|
|
|
|
4. False Breakout Risk: Price briefly breaking through the Bollinger Bands before retracing may trigger false trading signals.
|
|
|
|
5. Lack of Additional Confirmation: Relying solely on Bollinger Band signals without confirmation from other technical indicators or fundamental analysis.
|
|
|
|
#### Strategy Optimization Directions
|
|
|
|
1. Introduce Volume Indicators: Combining volume analysis can help confirm the validity of breakouts, reducing risks from false breakouts.
|
|
|
|
2. Add Trend Filters: Such as using long-term moving averages or the ADX indicator to ensure trading in the direction of the main trend.
|
|
|
|
3. Optimize Slippage and Price Impact Parameters: Adjust slippage and price impact percentages based on actual market data to better reflect real trading conditions.
|
|
|
|
4. Implement Dynamic Stop-Loss: Consider using the ATR indicator to set dynamic stop-losses, adapting to changes in market volatility.
|
|
|
|
5. Incorporate Time Filters: Avoid trading during low volatility sessions (e.g., Asian session) to reduce noise signals.
|
|
|
|
6. Optimize Bollinger Band Parameters: Experiment with different Bollinger Band lengths and multipliers to find the most suitable settings for the target market.
|
|
|
|
7. Introduce Machine Learning Algorithms: Utilize machine learning techniques to optimize entry and exit timing, improving overall strategy performance.
|
|
|
|
#### Conclusion
|
|
|
|
The Bollinger Band Crossover with Slippage and Price Impact Combined Strategy is a comprehensive trading system that combines technical analysis with practical trading considerations. By capturing market dynamics through the Bollinger Bands indicator and accounting for slippage and price impact, this strategy aims to provide a more realistic trading approach. However, the strategy still faces potential risks such as overtrading and false breakouts. By introducing additional confirmation indicators, optimizing parameter settings, and strengthening risk management, this strategy has the potential to become a more robust and reliable trading system. Future optimization should focus on improving signal quality, reducing false breakouts, and better adapting to different market conditions. Overall, this strategy provides an interesting starting point for quantitative traders to conduct further research and improvements.
|
|
|
|
[/trans]
|
|
|
|
|
|
|
|
> Source (PineScript)
|
|
|
|
``` pinescript
|
|
/*backtest
|
|
start: 2023-07-25 00:00:00
|
|
end: 2024-07-30 00:00:00
|
|
period: 1d
|
|
basePeriod: 1h
|
|
exchanges: [{"eid":"Futures_Binance","currency":"BTC_USDT"}]
|
|
*/
|
|
|
|
//@version=5
|
|
strategy("Combined Strategy", overlay=true)
|
|
|
|
// Input parameters for Bollinger Band Strategy
|
|
bb_length = input.int(20, title="BB Length")
|
|
bb_mult = input.float(2.0, title="BB Mult")
|
|
|
|
// Input parameters for Slippage and Price Impact
|
|
slippage_percent = input.float(40.0, title="Slippage (%)") / 100 // 40% slippage
|
|
price_impact_percent = input.float(40.0, title="Price Impact (%)") / 100 // 40% price impact
|
|
|
|
// Calculating Bollinger Bands
|
|
basis_bb = ta.sma(close, bb_length)
|
|
deviation = bb_mult * ta.stdev(close, bb_length)
|
|
upper = basis_bb + deviation
|
|
lower = basis_bb - deviation
|
|
|
|
// Entry and exit conditions for Bollinger Band Strategy
|
|
longCondition = ta.crossover(close, upper)
|
|
shortCondition = ta.crossunder(close, lower)
|
|
closeLongCondition = shortCondition
|
|
closeShortCondition = longCondition
|
|
|
|
// Adjust entry price for slippage and price impact
|
|
slippage_adjustment = close * slippage_percent
|
|
price_impact_adjustment = close * price_impact_percent
|
|
slippage_price_impact_adjusted_long_price = close + slippage_adjustment + price_impact_adjustment
|
|
slippage_price_impact_adjusted_short_price = close - slippage_adjustment - price_impact_adjustment
|
|
|
|
// Strategy logic for Bollinger Band Strategy
|
|
if (longCondition)
|
|
strategy.entry("Long", strategy.long, limit=slippage_price_impact_adjusted_long_price)
|
|
|
|
if (shortCondition)
|
|
strategy.entry("Short", strategy.short, limit=slippage_price_impact_adjusted_short_price)
|
|
|
|
if (closeLongCondition)
|
|
strategy.close("Long")
|
|
|
|
if (closeShortCondition)
|
|
strategy.close("Short")
|
|
|
|
// Plotting Bollinger Bands
|
|
plot(upper, color=color.blue)
|
|
plot(lower, color=color.red)
|
|
|
|
```
|
|
|
|
> Detail
|
|
|
|
https://www.fmz.com/strategy/458241
|
|
|
|
> Last Modified
|
|
|
|
2024-07-31 11:25:52
|