
165 lines
7.7 KiB
Markdown
165 lines
7.7 KiB
Markdown
|
|
> Name
|
|
|
|
布林带与斐波那契日内趋势追踪策略-Bollinger-Bands-and-Fibonacci-Intraday-Trend-Following-Strategy
|
|
|
|
> Author
|
|
|
|
ChaoZhang
|
|
|
|
> Strategy Description
|
|
|
|
|
|
|
|
[trans]
|
|
#### 概述
|
|
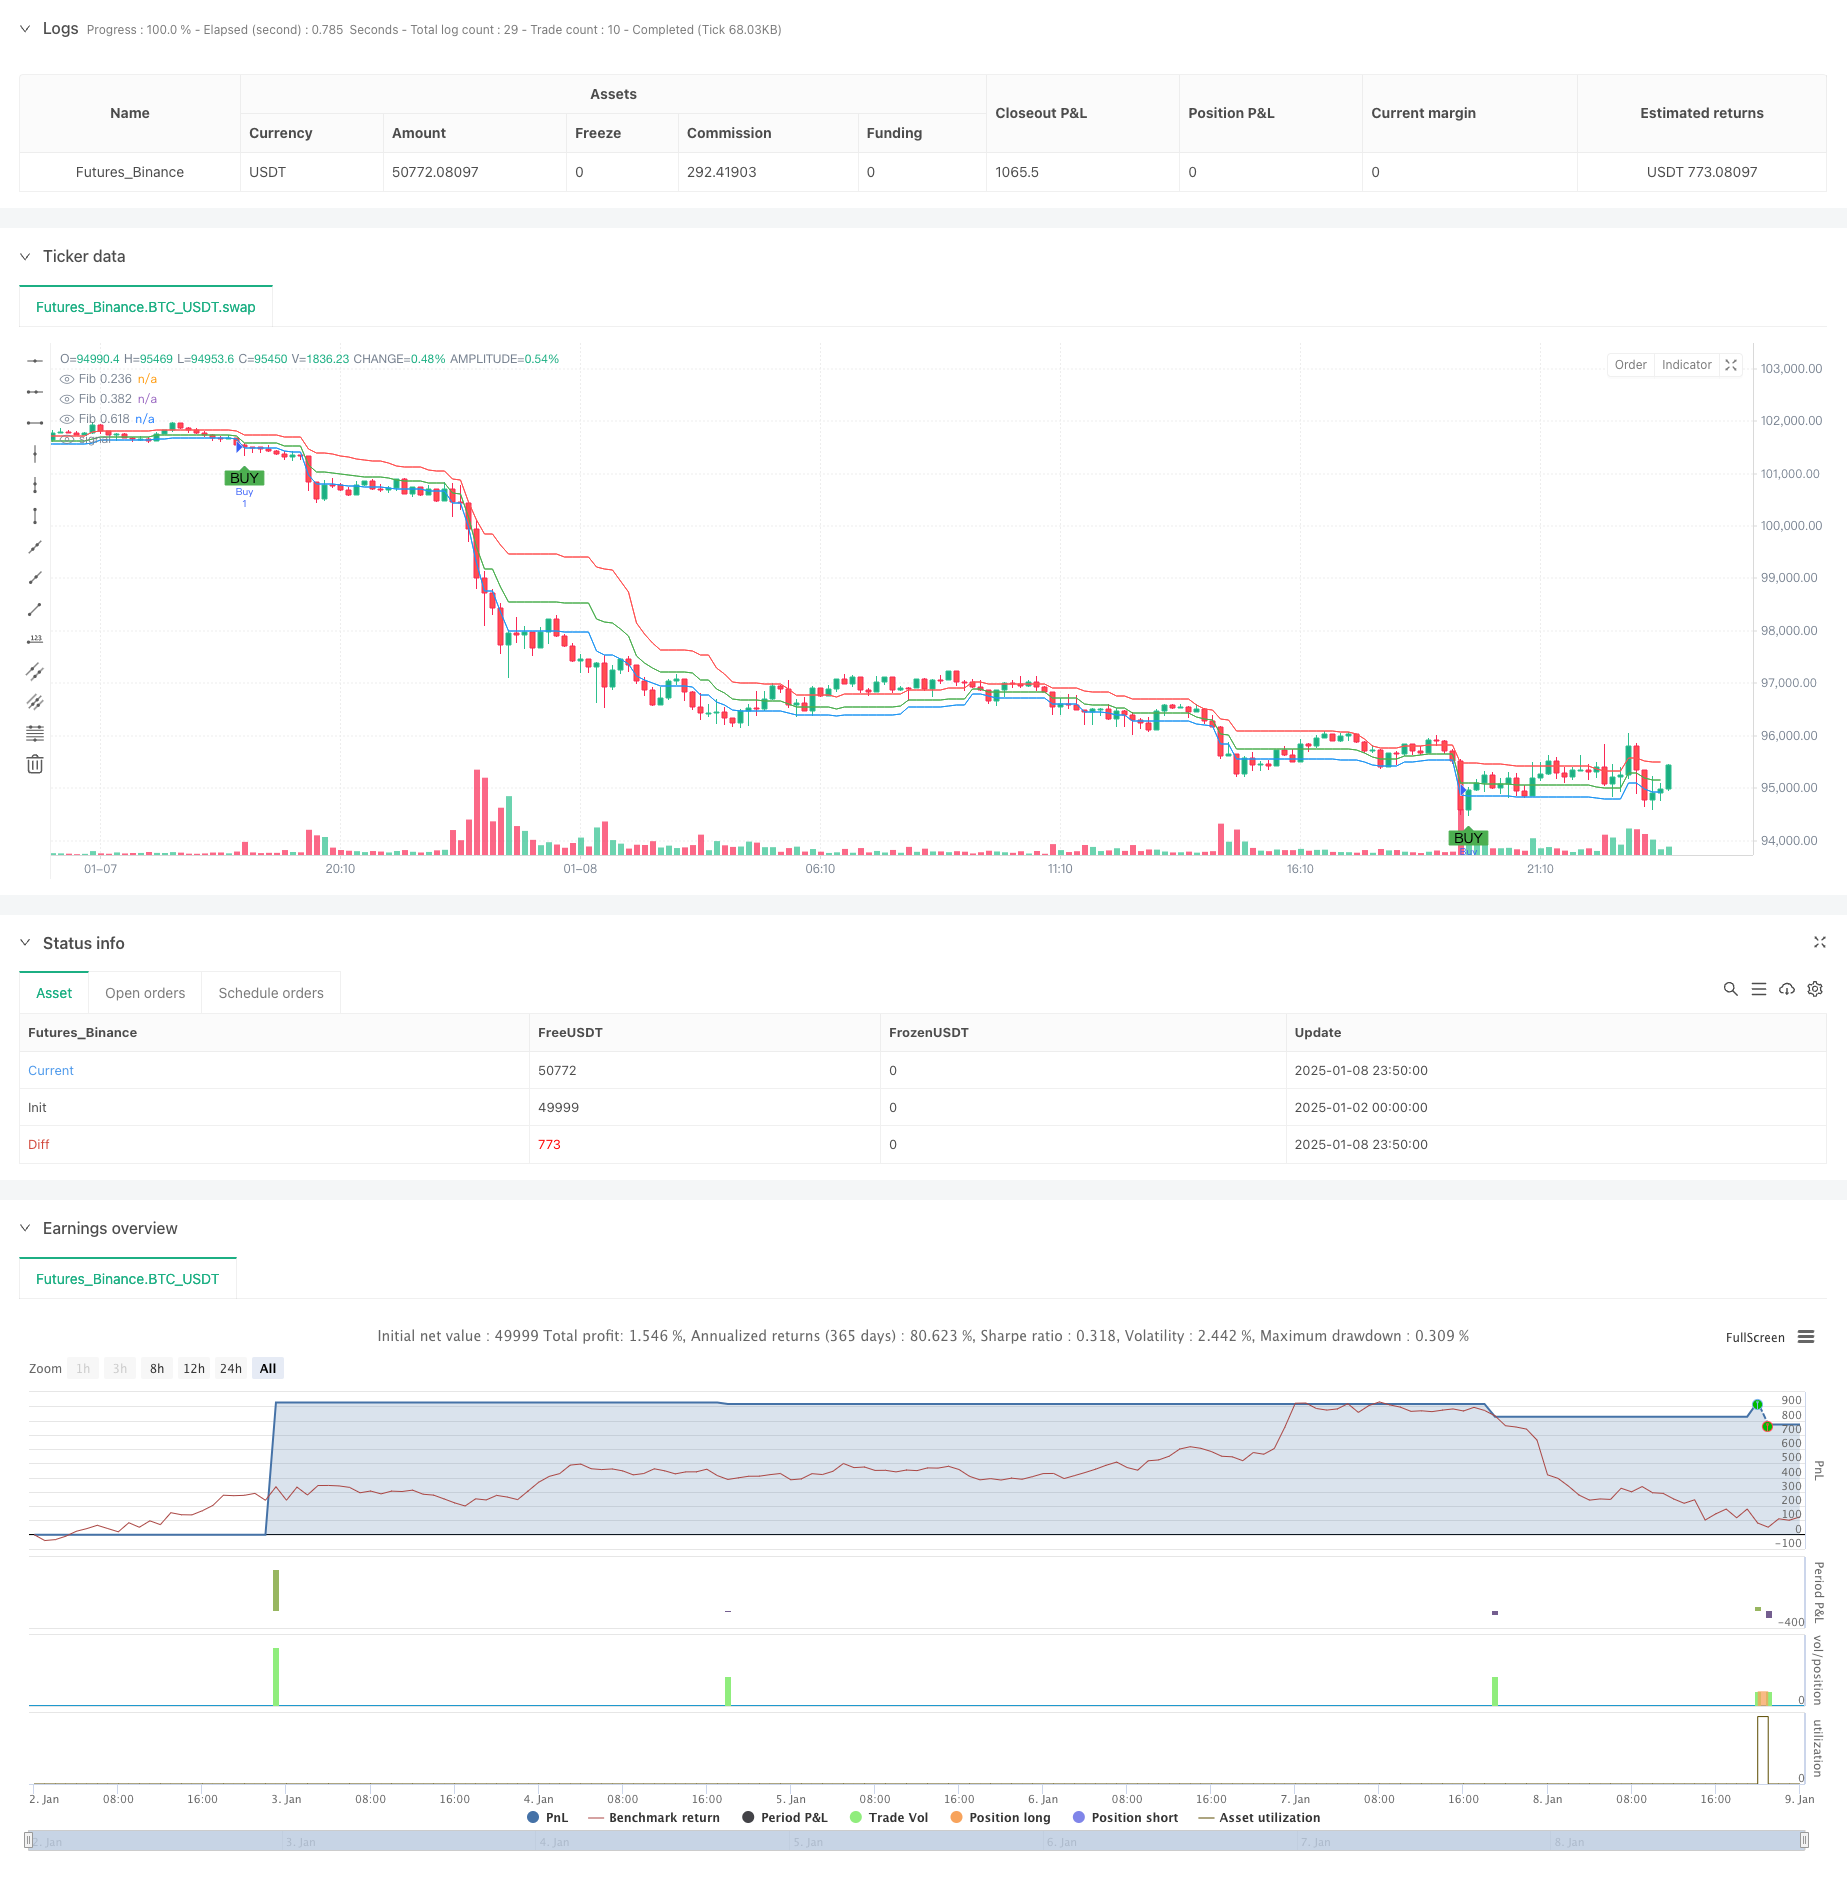
本策略是一个结合布林带和斐波那契回调水平的日内交易系统。它通过布林带指标识别超买超卖状态,同时利用斐波那契回调水平来确认潜在的支撑和阻力位,从而在市场波动中捕捉交易机会。策略采用基于20个周期的布林带和0.236、0.382、0.618三个关键的斐波那契水平进行信号生成。
|
|
|
|
#### 策略原理
|
|
策略的核心逻辑基于以下几个关键要素:
|
|
1. 利用布林带上下轨(标准差为2)标识价格的超买超卖区域
|
|
2. 通过最近20个周期的最高价和最低价计算斐波那契回调水平
|
|
3. 在价格突破布林带下轨且位于斐波那契0.236或0.382支撑位上方时产生买入信号
|
|
4. 在价格突破布林带上轨且位于斐波那契0.618阻力位下方时产生卖出信号
|
|
5. 使用固定的止损和止盈点数来控制风险和锁定利润
|
|
|
|
#### 策略优势
|
|
1. 结合了趋势和支撑阻力的双重确认机制,提高了交易信号的可靠性
|
|
2. 布林带能够动态适应市场波动率的变化,使策略具有良好的适应性
|
|
3. 斐波那契水平为入场和出场提供了清晰的参考框架
|
|
4. 固定的止损止盈设置有助于严格的风险控制
|
|
5. 策略参数可根据不同市场条件灵活调整
|
|
|
|
#### 策略风险
|
|
1. 在震荡市场中可能产生频繁的假突破信号
|
|
2. 固定的止损止盈设置可能不适合所有市场环境
|
|
3. 斐波那契水平的有效性受市场结构影响较大
|
|
4. 在快速趋势市场中,可能错过部分行情
|
|
5. 需要持续监控和调整参数以适应市场变化
|
|
|
|
#### 策略优化方向
|
|
1. 引入成交量指标来确认突破的有效性
|
|
2. 根据市场波动率动态调整止损止盈水平
|
|
3. 增加趋势过滤器以避免在横盘市场中交易
|
|
4. 优化斐波那契水平的计算周期
|
|
5. 考虑加入时间过滤器以避免在低流动性时段交易
|
|
|
|
#### 总结
|
|
这是一个结合技术分析经典工具的完整交易系统,通过布林带和斐波那契回调的协同作用,为交易者提供了一个系统化的交易框架。虽然存在一定的局限性,但通过适当的参数优化和风险管理,该策略能够在日内交易中发挥良好的效果。关键是要根据具体的交易品种和市场条件进行相应的调整和优化。
|
|
|
|
||
|
|
|
|
#### Overview
|
|
This strategy is an intraday trading system that combines Bollinger Bands and Fibonacci retracement levels. It identifies overbought and oversold conditions using Bollinger Bands while utilizing Fibonacci retracement levels to confirm potential support and resistance zones, thereby capturing trading opportunities in market fluctuations. The strategy employs Bollinger Bands based on a 20-period window and three key Fibonacci levels: 0.236, 0.382, and 0.618.
|
|
|
|
#### Strategy Principles
|
|
The core logic of the strategy is based on the following key elements:
|
|
1. Using Bollinger Bands (2 standard deviations) to identify overbought and oversold price zones
|
|
2. Calculating Fibonacci retracement levels based on the highest and lowest prices of the last 20 periods
|
|
3. Generating buy signals when price breaks below the lower Bollinger Band and remains above the Fibonacci 0.236 or 0.382 support levels
|
|
4. Generating sell signals when price breaks above the upper Bollinger Band and remains below the Fibonacci 0.618 resistance level
|
|
5. Using fixed stop-loss and take-profit points to control risk and secure profits
|
|
|
|
#### Strategy Advantages
|
|
1. Combines trend and support/resistance confirmation mechanisms, improving signal reliability
|
|
2. Bollinger Bands dynamically adapt to changes in market volatility, providing good strategy adaptability
|
|
3. Fibonacci levels provide a clear reference framework for entries and exits
|
|
4. Fixed stop-loss and take-profit settings help maintain strict risk control
|
|
5. Strategy parameters can be flexibly adjusted for different market conditions
|
|
|
|
#### Strategy Risks
|
|
1. May generate frequent false breakout signals in ranging markets
|
|
2. Fixed stop-loss and take-profit settings may not suit all market environments
|
|
3. Effectiveness of Fibonacci levels is heavily influenced by market structure
|
|
4. May miss some opportunities in rapidly trending markets
|
|
5. Requires continuous monitoring and parameter adjustment to adapt to market changes
|
|
|
|
#### Strategy Optimization Directions
|
|
1. Introduce volume indicators to confirm breakout validity
|
|
2. Dynamically adjust stop-loss and take-profit levels based on market volatility
|
|
3. Add trend filters to avoid trading in ranging markets
|
|
4. Optimize the calculation period for Fibonacci levels
|
|
5. Consider adding time filters to avoid trading during low liquidity periods
|
|
|
|
#### Summary
|
|
This is a complete trading system combining classic technical analysis tools, providing traders with a systematic trading framework through the synergy of Bollinger Bands and Fibonacci retracements. While it has certain limitations, the strategy can perform well in intraday trading through appropriate parameter optimization and risk management. The key is to make corresponding adjustments and optimizations based on specific trading instruments and market conditions.
|
|
[/trans]
|
|
|
|
|
|
|
|
> Source (PineScript)
|
|
|
|
``` pinescript
|
|
/*backtest
|
|
start: 2025-01-02 00:00:00
|
|
end: 2025-01-09 00:00:00
|
|
period: 10m
|
|
basePeriod: 10m
|
|
exchanges: [{"eid":"Futures_Binance","currency":"BTC_USDT","balance":49999}]
|
|
*/
|
|
|
|
//@version=5
|
|
strategy("Bollinger Bands and Fibonacci Intraday Strategy", overlay=true)
|
|
|
|
// Bollinger Bands settings
|
|
length = input.int(20, title="Bollinger Band Length")
|
|
src = close
|
|
mult = input.float(2.0, title="Bollinger Band Multiplier")
|
|
basis = ta.sma(src, length)
|
|
dev = mult * ta.stdev(src, length)
|
|
upper = basis + dev
|
|
lower = basis - dev
|
|
|
|
// Fibonacci retracement levels
|
|
fibRetrace1 = input.float(0.236, title="Fibonacci Level 0.236")
|
|
fibRetrace2 = input.float(0.382, title="Fibonacci Level 0.382")
|
|
fibRetrace3 = input.float(0.618, title="Fibonacci Level 0.618")
|
|
|
|
// Define the Fibonacci levels based on recent high and low
|
|
var float fibLow = na
|
|
var float fibHigh = na
|
|
|
|
if (bar_index == 0 or ta.highest(high, 20) != fibHigh or ta.lowest(low, 20) != fibLow)
|
|
fibHigh := ta.highest(high, 20)
|
|
fibLow := ta.lowest(low, 20)
|
|
|
|
fibLevel1 = fibLow + (fibHigh - fibLow) * fibRetrace1
|
|
fibLevel2 = fibLow + (fibHigh - fibLow) * fibRetrace2
|
|
fibLevel3 = fibLow + (fibHigh - fibLow) * fibRetrace3
|
|
|
|
// Plot Fibonacci levels on the chart
|
|
plot(fibLevel1, title="Fib 0.236", color=color.blue, linewidth=1)
|
|
plot(fibLevel2, title="Fib 0.382", color=color.green, linewidth=1)
|
|
plot(fibLevel3, title="Fib 0.618", color=color.red, linewidth=1)
|
|
|
|
// Buy and Sell conditions
|
|
buyCondition = close < lower and close > fibLevel1
|
|
sellCondition = close > upper and close < fibLevel3
|
|
|
|
// Plot Buy and Sell signals
|
|
plotshape(buyCondition, title="Buy Signal", location=location.belowbar, color=color.green, style=shape.labelup, text="BUY")
|
|
plotshape(sellCondition, title="Sell Signal", location=location.abovebar, color=color.red, style=shape.labeldown, text="SELL")
|
|
|
|
// Execute strategy
|
|
if (buyCondition)
|
|
strategy.entry("Buy", strategy.long)
|
|
|
|
if (sellCondition)
|
|
strategy.entry("Sell", strategy.short)
|
|
|
|
// Exit strategy with stop loss and take profit
|
|
stopLoss = input.float(50, title="Stop Loss (pips)", minval=1)
|
|
takeProfit = input.float(100, title="Take Profit (pips)", minval=1)
|
|
|
|
strategy.exit("Exit Buy", "Buy", stop=close - stopLoss * syminfo.mintick, limit=close + takeProfit * syminfo.mintick)
|
|
strategy.exit("Exit Sell", "Sell", stop=close + stopLoss * syminfo.mintick, limit=close - takeProfit * syminfo.mintick)
|
|
```
|
|
|
|
> Detail
|
|
|
|
https://www.fmz.com/strategy/477975
|
|
|
|
> Last Modified
|
|
|
|
2025-01-10 16:29:16
|