
205 lines
9.6 KiB
Markdown
205 lines
9.6 KiB
Markdown
|
|
> Name
|
|
|
|
布林带与指数移动平均结合交易策略-Bollinger-Bands-and-Exponential-Moving-Average-Crossover-Trading-Strategy
|
|
|
|
> Author
|
|
|
|
ChaoZhang
|
|
|
|
> Strategy Description
|
|
|
|
|
|
[trans]
|
|
#### 概述
|
|
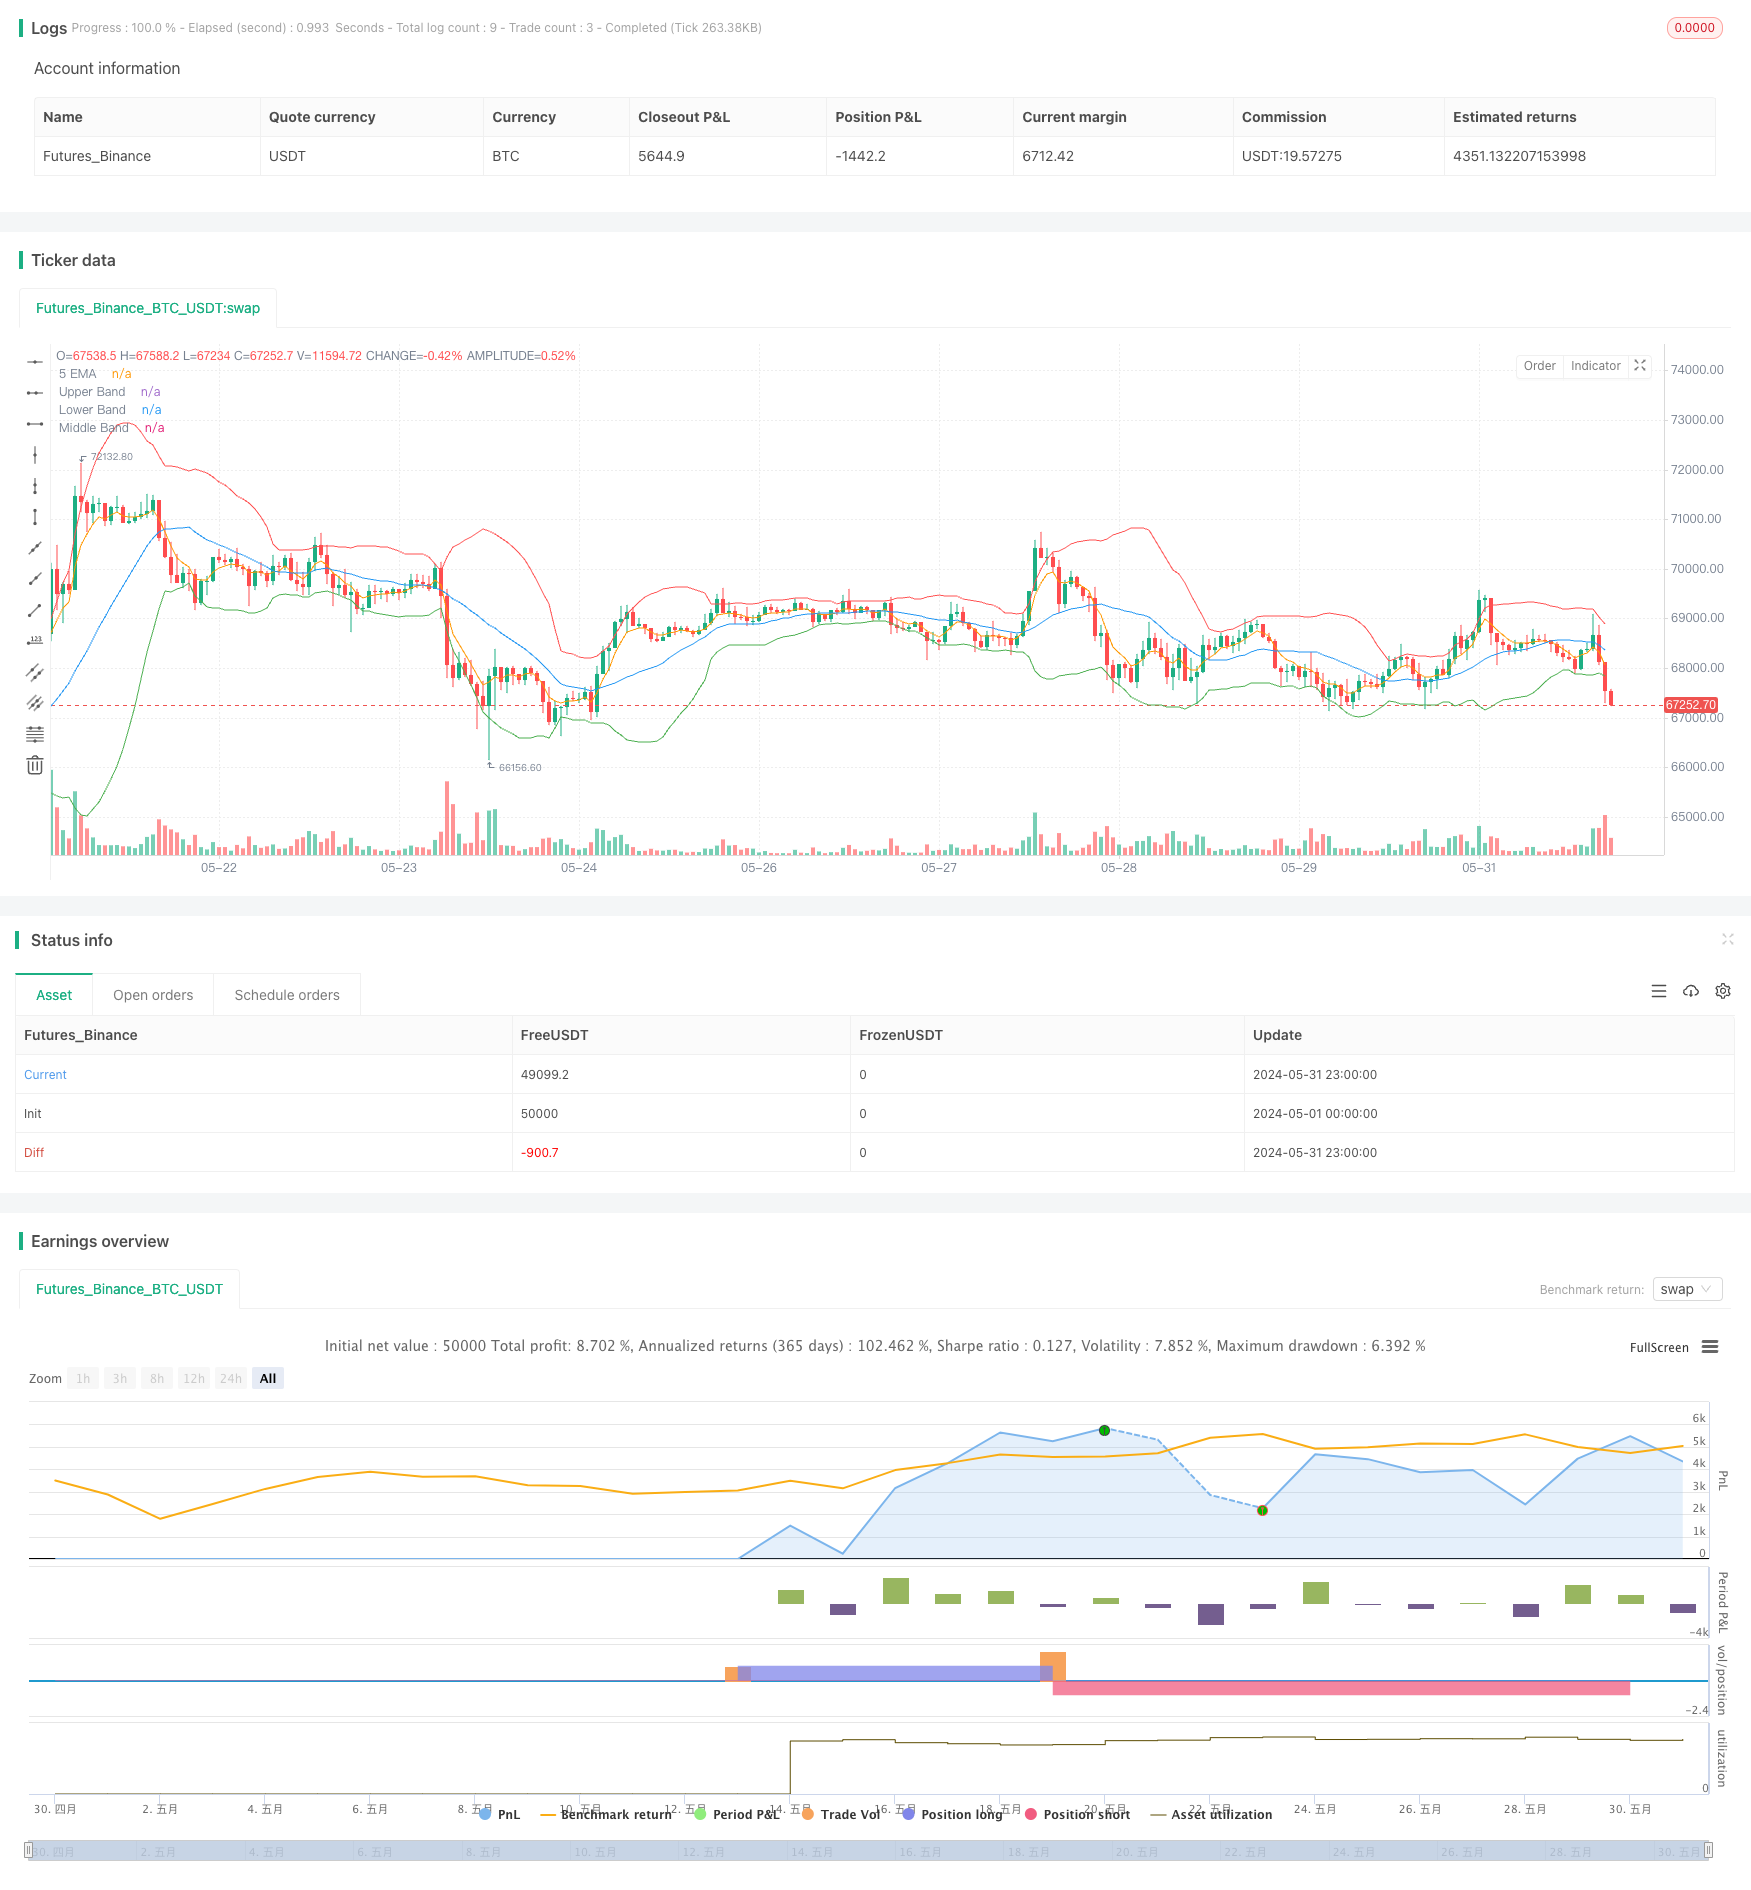
这个策略结合了布林带(Bollinger Bands)和5日指数移动平均线(5-day EMA)来生成交易信号。当价格超出布林带上轨且收盘价低于5日EMA时,开空头仓位;当价格跌破布林带下轨且收盘价高于5日EMA时,开多头仓位。同时,当出现反向信号时,策略会平掉现有仓位并开立新的反向仓位。这个策略旨在捕捉市场的波动性和趋势变化,通过布林带来判断价格的相对高低,并利用EMA作为趋势的滤网,以此来产生交易信号。
|
|
|
|
#### 策略原理
|
|
1. 计算布林带的上轨、中轨和下轨。上轨为中轨加上两倍标准差,下轨为中轨减去两倍标准差,中轨为收盘价的简单移动平均线。
|
|
2. 计算5日EMA作为趋势的参考。
|
|
3. 当开盘价大于布林带上轨且收盘价小于5日EMA时,开空头仓位。
|
|
4. 当开盘价小于布林带下轨且收盘价大于5日EMA时,开多头仓位。
|
|
5. 如果已有空头仓位,当触发多头信号时,平掉空头并开多头仓位。
|
|
6. 如果已有多头仓位,当触发空头信号时,平掉多头并开空头仓位。
|
|
7. 如果持有多头仓位,当触发空头平仓信号时,平掉多头仓位。
|
|
8. 如果持有空头仓位,当触发多头平仓信号时,平掉空头仓位。
|
|
|
|
#### 策略优势
|
|
1. 同时利用价格的波动性和趋势特征来产生信号,可以在趋势和震荡行情中把握机会。
|
|
2. 布林带能够灵活调整参数,适应不同的市场状况和品种特征。
|
|
3. 5日EMA作为趋势过滤,可以有效降低噪音和频繁交易。
|
|
4. 及时止损和反向开仓的机制,可以更好地控制风险,并积极把握新的趋势机会。
|
|
5. 逻辑清晰,容易理解和实现,便于进一步优化。
|
|
|
|
#### 策略风险
|
|
1. 参数选择不当可能导致信号失真或者过度交易。需要根据品种和周期进行优化测试。
|
|
2. 在震荡市可能出现频繁的交易信号,导致过度交易和成本增加。
|
|
3. 趋势转折点的把握存在滞后,可能错过最佳入场时机。
|
|
4. 单一技术指标组合可能面临失效的风险,需要与其他信号进行验证。
|
|
5. 极端行情下可能面临失控的风险,需要严格的风控措施。
|
|
|
|
#### 策略优化方向
|
|
1. 对布林带的参数如长度、倍数等进行优化,找到最佳的参数组合。
|
|
2. 对EMA的周期进行优化测试,选择最佳的趋势周期。
|
|
3. 加入其他趋势类指标如MACD等作为辅助判断,提高趋势把握的准确性。
|
|
4. 引入波动率指标如ATR等作为止损和仓位管理的依据,控制单笔风险。
|
|
5. 对交易的时间段进行限制,避开特定时间的非有效波动。
|
|
6. 根据行情特征,设置适当的止盈止损策略。
|
|
|
|
#### 总结
|
|
该策略通过布林带和EMA的结合,可以比较有效地捕捉趋势性机会和波动性机会,适用于中长周期的交易策略。但是需要注意参数的优化,仓位的控制以及风险的管理,并且要与其他技术指标和基本面分析相结合,才能更好地发挥策略的效力。策略的表现可能会受到市场状态的影响,需要根据实际情况进行调整和优化。
|
|
|
|
||
|
|
|
|
#### Overview
|
|
This strategy combines Bollinger Bands and the 5-day Exponential Moving Average (EMA) to generate trading signals. When the price breaks above the upper Bollinger Band and closes below the 5-day EMA, a short position is opened. Conversely, when the price breaks below the lower Bollinger Band and closes above the 5-day EMA, a long position is opened. Additionally, when a reverse signal appears, the strategy closes the current position and opens a new position in the opposite direction. The strategy aims to capture market volatility and trend changes by using Bollinger Bands to gauge relative price levels and the EMA as a trend filter to generate trading signals.
|
|
|
|
#### Strategy Principles
|
|
1. Calculate the upper, middle, and lower Bollinger Bands. The upper band is the middle band plus two standard deviations, the lower band is the middle band minus two standard deviations, and the middle band is the simple moving average of the closing prices.
|
|
2. Calculate the 5-day EMA as a trend reference.
|
|
3. When the opening price is above the upper Bollinger Band and the closing price is below the 5-day EMA, open a short position.
|
|
4. When the opening price is below the lower Bollinger Band and the closing price is above the 5-day EMA, open a long position.
|
|
5. If a short position is already open and a long signal is triggered, close the short position and open a long position.
|
|
6. If a long position is already open and a short signal is triggered, close the long position and open a short position.
|
|
7. If holding a long position and a short closing signal is triggered, close the long position.
|
|
8. If holding a short position and a long closing signal is triggered, close the short position.
|
|
|
|
#### Strategy Advantages
|
|
1. Utilizes both price volatility and trend characteristics to generate signals, allowing opportunities to be seized in both trending and oscillating markets.
|
|
2. Bollinger Bands can be flexibly adjusted to adapt to different market conditions and instrument characteristics.
|
|
3. The 5-day EMA acts as a trend filter, effectively reducing noise and frequent trades.
|
|
4. The mechanism of timely stop-loss and reverse position opening allows for better risk control and actively seizing new trend opportunities.
|
|
5. Clear logic, easy to understand and implement, and convenient for further optimization.
|
|
|
|
#### Strategy Risks
|
|
1. Improper parameter selection may lead to signal distortion or excessive trading. Optimization and testing based on the instrument and timeframe are necessary.
|
|
2. In oscillating markets, frequent trading signals may occur, resulting in overtrading and increased costs.
|
|
3. There may be a lag in capturing trend turning points, potentially missing the best entry opportunities.
|
|
4. The risk of failure exists with a single technical indicator combination, requiring validation with other signals.
|
|
5. In extreme market conditions, there may be a risk of losing control, requiring strict risk control measures.
|
|
|
|
#### Strategy Optimization Directions
|
|
1. Optimize the parameters of the Bollinger Bands, such as length and multiplier, to find the best parameter combination.
|
|
2. Optimize and test the EMA period to select the best trend period.
|
|
3. Incorporate other trend indicators such as MACD as auxiliary judgment to improve the accuracy of trend capture.
|
|
4. Introduce volatility indicators such as ATR as a basis for stop-loss and position management to control single-trade risk.
|
|
5. Restrict trading to specific time periods to avoid ineffective fluctuations at certain times.
|
|
6. Set appropriate take-profit and stop-loss strategies based on market characteristics.
|
|
|
|
#### Summary
|
|
By combining Bollinger Bands and EMA, this strategy can effectively capture trending and volatility opportunities, suitable for medium to long-term trading strategies. However, attention should be paid to parameter optimization, position control, and risk management. It should also be combined with other technical indicators and fundamental analysis for better performance. The strategy's performance may be influenced by market conditions and require adjustments and optimizations based on actual situations.
|
|
[/trans]
|
|
|
|
|
|
|
|
> Source (PineScript)
|
|
|
|
``` pinescript
|
|
/*backtest
|
|
start: 2024-05-01 00:00:00
|
|
end: 2024-05-31 23:59:59
|
|
period: 1h
|
|
basePeriod: 15m
|
|
exchanges: [{"eid":"Futures_Binance","currency":"BTC_USDT"}]
|
|
*/
|
|
|
|
//@version=5
|
|
strategy("Bollinger Bands and EMA Strategy", overlay=true)
|
|
|
|
// Define the Bollinger Bands
|
|
length = input.int(20, title="BB Length")
|
|
src = input(close, title="BB Source")
|
|
mult = input.float(2.0, title="BB Multiplier")
|
|
|
|
basis = ta.sma(src, length)
|
|
dev = mult * ta.stdev(src, length)
|
|
upper = basis + dev
|
|
lower = basis - dev
|
|
|
|
// Plot Bollinger Bands
|
|
plot(upper, "Upper Band", color=color.red)
|
|
plot(lower, "Lower Band", color=color.green)
|
|
plot(basis, "Middle Band", color=color.blue) // Use plot instead of hline for basis
|
|
|
|
// Define the 5-period EMA
|
|
ema5 = ta.ema(close, 5)
|
|
|
|
// Plot the 5 EMA
|
|
plot(ema5, "5 EMA", color=color.orange)
|
|
|
|
// Generate signals
|
|
var float entry_price = na
|
|
var string trade_direction = "none"
|
|
|
|
if (na(close[1]))
|
|
trade_direction := "none"
|
|
|
|
// Condition for entering a short trade
|
|
if (open > upper and close < ema5)
|
|
if (trade_direction != "short")
|
|
strategy.entry("Short", strategy.short)
|
|
entry_price := close
|
|
trade_direction := "short"
|
|
|
|
// Condition for entering a long trade
|
|
if (open < lower and close > ema5)
|
|
if (trade_direction != "long")
|
|
strategy.entry("Long", strategy.long)
|
|
entry_price := close
|
|
trade_direction := "long"
|
|
|
|
// Close short trade on a long signal
|
|
if (trade_direction == "short" and open < lower and close > ema5)
|
|
strategy.close("Short")
|
|
strategy.entry("Long", strategy.long)
|
|
entry_price := close
|
|
trade_direction := "long"
|
|
|
|
// Close long trade on a short signal
|
|
if (trade_direction == "long" and open > upper and close < ema5)
|
|
strategy.close("Long")
|
|
strategy.entry("Short", strategy.short)
|
|
entry_price := close
|
|
trade_direction := "short"
|
|
|
|
// Close trades when opposite signal is generated
|
|
if (trade_direction == "long" and open > upper and close < ema5)
|
|
strategy.close("Long")
|
|
trade_direction := "none"
|
|
|
|
if (trade_direction == "short" and open < lower and close > ema5)
|
|
strategy.close("Short")
|
|
trade_direction := "none"
|
|
|
|
|
|
|
|
|
|
|
|
|
|
|
|
|
|
|
|
|
|
|
|
|
|
|
|
|
|
|
|
|
|
|
|
|
|
|
|
|
|
|
|
|
|
|
|
```
|
|
|
|
> Detail
|
|
|
|
https://www.fmz.com/strategy/454368
|
|
|
|
> Last Modified
|
|
|
|
2024-06-17 16:58:43
|