
262 lines
20 KiB
Markdown
262 lines
20 KiB
Markdown
|
||
> Name
|
||
|
||
多重确认动态止盈止损交易策略RSI与MACD结合EMA趋势和蜡烛形态识别-Multi-Confirmation-Dynamic-TP-SL-Trading-Strategy-RSI-and-MACD-Combined-with-EMA-Trend-and-Candlestick-Pattern-Recognition
|
||
|
||
> Author
|
||
|
||
ianzeng123
|
||
|
||
> Strategy Description
|
||
|
||
|
||
|
||
|
||
|
||
|
||
[trans]
|
||
#### 概述
|
||
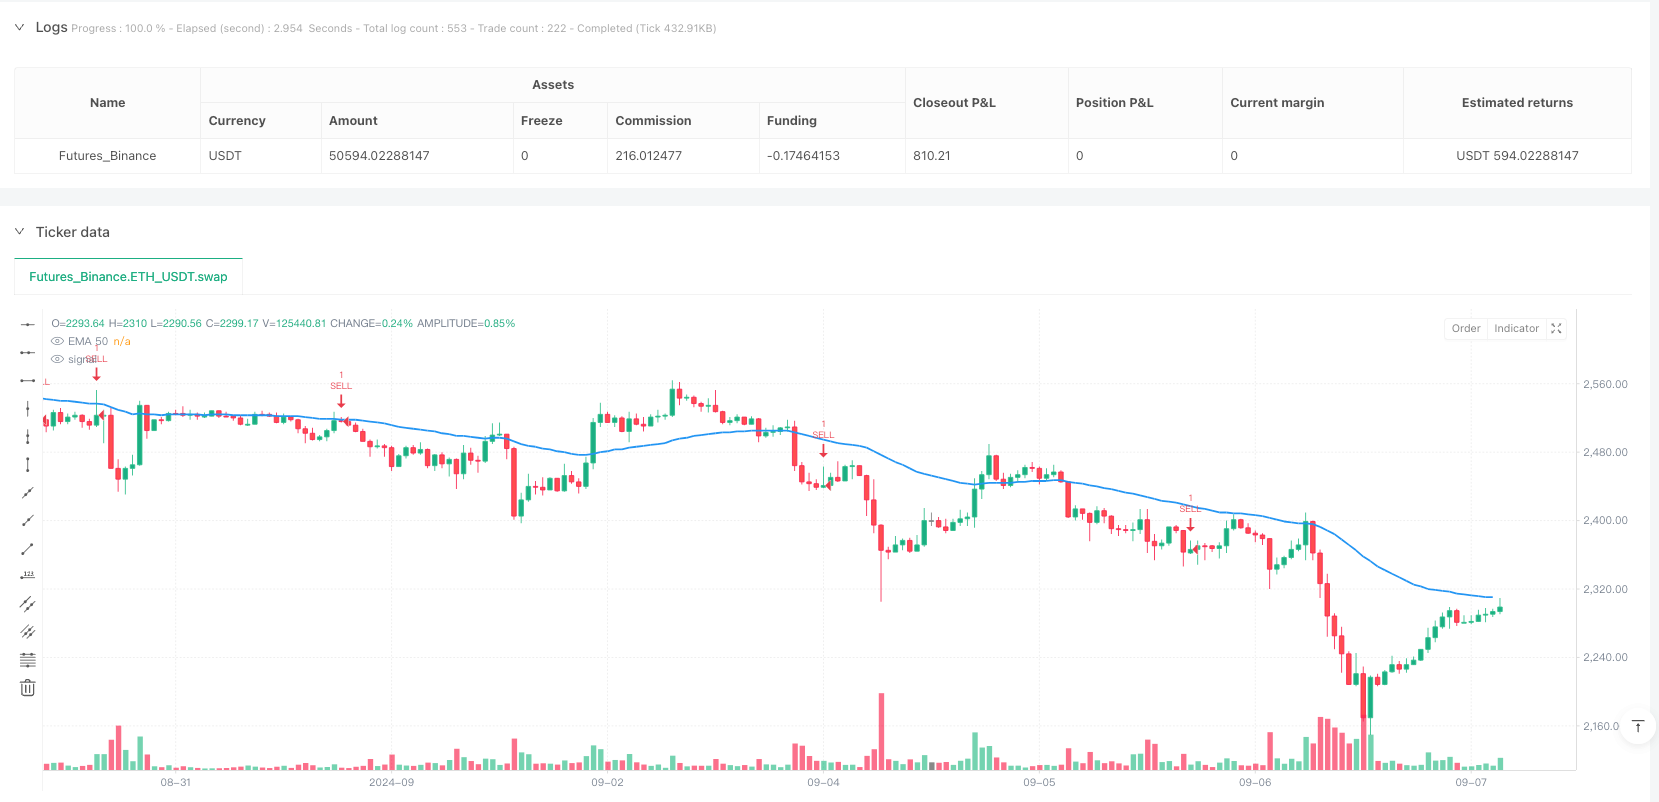
多重确认动态止盈止损交易策略是一种综合性量化交易系统,它通过多重技术指标和市场结构分析来识别高概率交易机会。该策略结合了趋势过滤(50周期EMA)、蜡烛形态识别(吞没形态与针形态)、动量确认(RSI与MACD)以及基于ATR的动态风险管理系统,以形成一个全面的交易决策框架。这种多层次的确认机制有助于过滤掉低质量信号,同时通过动态调整的止盈止损水平来优化风险回报比,使策略在不同市场条件下都能保持稳定性能。
|
||
|
||
#### 策略原理
|
||
该策略的核心原理是基于多重确认机制,只有当所有条件都满足时才会触发交易信号。具体执行逻辑如下:
|
||
|
||
1. **趋势确认**:使用50周期EMA作为趋势过滤器。只有当价格位于EMA之上时,才考虑买入信号;当价格位于EMA之下时,才考虑卖出信号。
|
||
|
||
2. **蜡烛形态识别**:
|
||
- **看涨吞没形态**:前一蜡烛为阴线,当前蜡烛为阳线,且当前蜡烛完全"吞没"前一蜡烛(开盘价低于前一蜡烛的收盘价,收盘价高于前一蜡烛的开盘价),同时蜡烛实体大小至少为前一蜡烛的1.5倍且大于5周期平均实体。
|
||
- **看跌吞没形态**:前一蜡烛为阳线,当前蜡烛为阴线,且当前蜡烛完全"吞没"前一蜡烛,同时符合相同的大小条件。
|
||
- **看涨针形态**:下影线至少占蜡烛总长的66%,上影线小于总长的33%,且下影线长度至少为实体的2.5倍。
|
||
- **看跌针形态**:上影线至少占蜡烛总长的66%,下影线小于总长的33%,且上影线长度至少为实体的2.5倍。
|
||
|
||
3. **动量确认**:
|
||
- **RSI过滤**:买入信号要求RSI值低于70(避免超买区域);卖出信号要求RSI值高于30(避免超卖区域)。
|
||
- **MACD确认**:买入信号要求MACD线位于信号线之上;卖出信号要求MACD线位于信号线之下。
|
||
|
||
4. **风险管理**:
|
||
- 基于14周期ATR值动态设置止盈止损水平。
|
||
- 止盈和止损距离均设置为ATR值的1.5倍,确保风险回报比为1:1。
|
||
|
||
策略只有在趋势方向正确、蜡烛形态有效、RSI未处于极端区域且MACD方向一致的情况下才会生成信号,这种严格的多重确认机制可以有效减少假信号。
|
||
|
||
#### 策略优势
|
||
1. **多重确认机制**:通过结合多个技术指标和市场结构分析,显著提高了交易信号的质量和可靠性。每个组件都解决了特定的市场分析需求:EMA确定趋势方向,蜡烛形态识别价格行为转变点,RSI和MACD确认动量一致性。
|
||
|
||
2. **自适应性强**:策略中的动态止盈止损机制基于ATR计算,能够根据市场波动性自动调整,使其在高波动和低波动环境中都能适应市场条件变化。
|
||
|
||
3. **风险管理完善**:内置的止盈止损机制确保每笔交易都有预定义的退出点,这有助于控制单笔交易的最大损失并锁定利润。
|
||
|
||
4. **可视化与提醒功能**:策略包含EMA趋势线显示和交易信号提醒功能,便于交易者实时监控市场和执行交易决策。
|
||
|
||
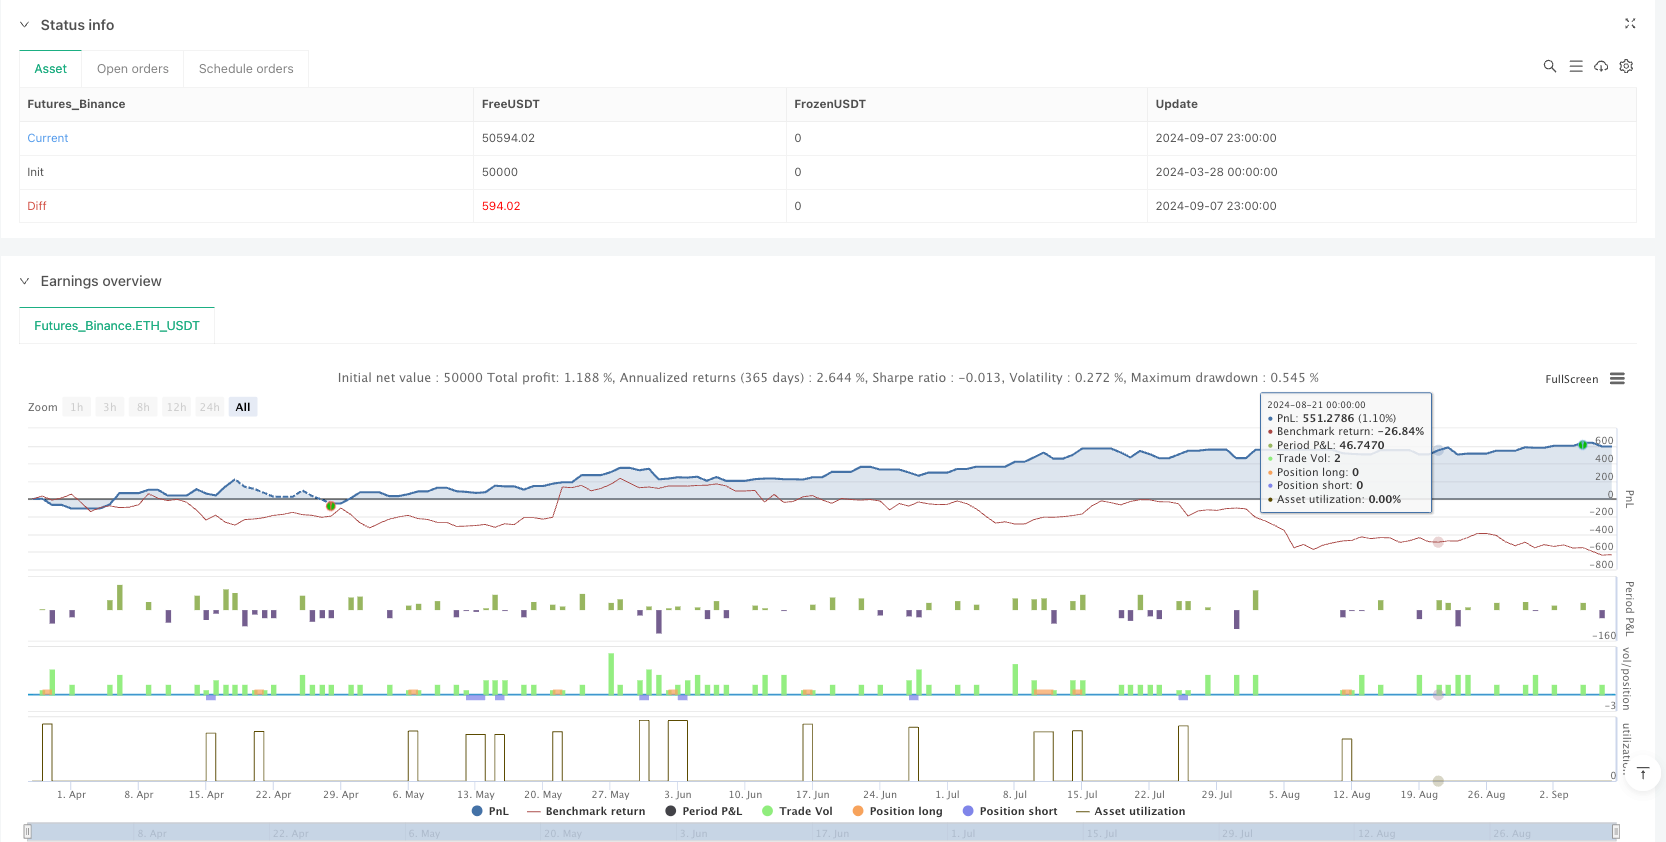
5. **灵活适应多种时间周期**:根据回测结果,该策略在4小时、1小时和15分钟时间周期都表现良好,使其适用于不同交易风格(摇摆交易、日内交易和短线交易)。
|
||
|
||
6. **明确的蜡烛形态定义**:策略对蜡烛形态有严格的数学定义,减少了主观判断,增强了策略的一致性和可重复性。
|
||
|
||
#### 策略风险
|
||
1. **过度过滤风险**:多重确认机制虽然提高了信号质量,但也可能导致错过一些有利可图的交易机会。在快速变化的市场中,等待所有条件同时满足可能让交易者错过重要的入场点。
|
||
|
||
2. **参数敏感性**:该策略使用多个参数(EMA长度、RSI阈值、MACD参数、ATR乘数等),这些参数的微小变化可能对策略性能产生重大影响。在不同市场或时间框架上,可能需要重新优化这些参数。
|
||
|
||
3. **趋势反转延迟**:基于EMA的趋势过滤器是滞后指标,可能导致在趋势反转初期错过交易机会或在错误的时间保持头寸。
|
||
|
||
4. **回撤风险**:尽管设置了止损,但在极端市场条件下(如跳空或闪崩),实际损失可能超过预期的ATR倍数。
|
||
|
||
5. **横盘市场表现欠佳**:当市场在狭窄范围内横盘整理时,策略的效果可能不佳,因为它主要设计用于捕捉趋势性动作。
|
||
|
||
6. **虚假突破风险**:特别是在短时间周期中,可能会出现虚假的蜡烛形态信号,导致不必要的交易。
|
||
|
||
为减轻这些风险,交易者可以考虑:(1)在不同市场环境中调整参数;(2)结合更多过滤条件,如波动率阈值或趋势强度指标;(3)仅在强趋势市场中使用此策略;(4)考虑增加部分止损位置以减少最大回撤。
|
||
|
||
#### 策略优化方向
|
||
1. **增加波动率过滤器**:现有策略已使用ATR进行风险管理,但可以进一步利用波动率指标(如布林带宽度或ATR百分比)来避免在波动过小的市场中交易,或在高波动性期间调整头寸规模。
|
||
|
||
2. **整合交易量分析**:当前策略完全基于价格数据,引入交易量确认可以提高信号质量。例如,要求蜡烛形态出现时伴随交易量增加,或使用OBV(累积交易量平衡)来确认价格趋势。
|
||
|
||
3. **动态调整止盈止损比例**:目前策略使用固定的1.5倍ATR作为止盈止损距离。可以考虑根据市场状况动态调整这一乘数,例如在高波动性环境中增加止损距离,在强趋势中设置更远的止盈目标。
|
||
|
||
4. **加入时间过滤器**:某些市场在特定时间段表现更好(如开盘时段或高流动性时期)。可以添加时间过滤器,只在最有利的交易时段产生信号。
|
||
|
||
5. **实现部分止盈策略**:目前策略使用固定的全仓止盈点。可以实现分段止盈,允许部分头寸在较近的目标获利,而让剩余头寸追踪更大的趋势移动。
|
||
|
||
6. **趋势强度过滤**:除了简单的EMA趋势方向外,增加趋势强度指标(如ADX或趋势内的蜡烛连续性)可以帮助区分强趋势和弱趋势,并相应地调整交易决策。
|
||
|
||
7. **添加市场状态分类**:开发一个分类系统来识别市场处于趋势期还是整理期,并针对不同市场状态使用不同的交易逻辑或参数集。
|
||
|
||
8. **机器学习优化**:使用机器学习算法自动优化各种参数组合,或者通过历史数据训练模型来预测哪些条件下策略最可能成功。
|
||
|
||
#### 总结
|
||
多重确认动态止盈止损交易策略是一个全面、系统化的交易系统,它通过多层次的技术分析来识别高概率交易机会。通过结合EMA趋势过滤、精确定义的蜡烛形态、RSI和MACD动量确认以及基于ATR的风险管理,该策略提供了一个结构化的方法来执行交易决策,同时控制风险。
|
||
|
||
虽然该策略在趋势性市场中表现优异,但在横盘和高波动环境中可能面临挑战。为了进一步提高性能,可以考虑增加交易量分析、波动率过滤器和趋势强度指标,或实施更复杂的部分止盈和动态风险管理策略。
|
||
|
||
这一策略的主要优势在于其严格的多重确认机制和自适应的风险管理系统,这使得它在保持稳定的风险回报比的同时,能够适应各种市场条件。对于想要采用系统化、规则导向型交易方法的交易者来说,这是一个强大的起点,可以根据个人交易风格和风险偏好进行进一步定制。
|
||
|
||
||
|
||
|
||
#### Overview
|
||
The Multi-Confirmation Dynamic TP/SL Trading Strategy is a comprehensive quantitative trading system that identifies high-probability trading opportunities through multiple technical indicators and market structure analysis. This strategy combines trend filtering (50-period EMA), candlestick pattern recognition (Engulfing and Pin Bar patterns), momentum confirmation (RSI and MACD), and an ATR-based dynamic risk management system to form a comprehensive trading decision framework. This multi-layered confirmation mechanism helps filter out low-quality signals while optimizing risk-reward ratios through dynamically adjusted take-profit and stop-loss levels, allowing the strategy to maintain consistent performance across different market conditions.
|
||
|
||
#### Strategy Principles
|
||
The core principle of this strategy is based on a multi-confirmation mechanism, triggering trade signals only when all conditions are satisfied. The specific execution logic is as follows:
|
||
|
||
1. **Trend Confirmation**: Uses a 50-period EMA as a trend filter. Buy signals are considered only when price is above the EMA; sell signals are considered only when price is below the EMA.
|
||
|
||
2. **Candlestick Pattern Recognition**:
|
||
- **Bullish Engulfing Pattern**: Previous candle is bearish, current candle is bullish and completely "engulfs" the previous candle (open price lower than previous candle's close, close price higher than previous candle's open), with the candle body size at least 1.5 times larger than the previous candle and greater than the 5-period average body.
|
||
- **Bearish Engulfing Pattern**: Previous candle is bullish, current candle is bearish and completely "engulfs" the previous candle, meeting the same size requirements.
|
||
- **Bullish Pin Bar**: Lower shadow constitutes at least 66% of the total candle length, upper shadow less than 33% of total length, and the lower shadow length is at least 2.5 times the body.
|
||
- **Bearish Pin Bar**: Upper shadow constitutes at least 66% of the total candle length, lower shadow less than 33% of total length, and the upper shadow length is at least 2.5 times the body.
|
||
|
||
3. **Momentum Confirmation**:
|
||
- **RSI Filter**: Buy signals require RSI values below 70 (avoiding overbought regions); sell signals require RSI values above 30 (avoiding oversold regions).
|
||
- **MACD Confirmation**: Buy signals require the MACD line to be above the signal line; sell signals require the MACD line to be below the signal line.
|
||
|
||
4. **Risk Management**:
|
||
- Dynamically sets take-profit and stop-loss levels based on the 14-period ATR value.
|
||
- Both take-profit and stop-loss distances are set at 1.5 times the ATR value, ensuring a 1:1 risk-reward ratio.
|
||
|
||
The strategy generates signals only when the trend direction is correct, the candlestick pattern is valid, RSI is not in extreme regions, and MACD direction is consistent. This strict multi-confirmation mechanism effectively reduces false signals.
|
||
|
||
#### Strategy Advantages
|
||
1. **Multi-Confirmation Mechanism**: By combining multiple technical indicators and market structure analysis, the quality and reliability of trading signals are significantly improved. Each component addresses a specific market analysis need: EMA determines trend direction, candlestick patterns identify price action turning points, RSI and MACD confirm momentum consistency.
|
||
|
||
2. **Strong Adaptability**: The dynamic take-profit and stop-loss mechanism based on ATR calculation automatically adjusts according to market volatility, making it adaptable to market condition changes in both high and low volatility environments.
|
||
|
||
3. **Comprehensive Risk Management**: The built-in take-profit and stop-loss mechanism ensures each trade has predefined exit points, helping to control the maximum loss per trade and lock in profits.
|
||
|
||
4. **Visualization and Alert Functions**: The strategy includes EMA trend line display and trade signal alerts, facilitating real-time market monitoring and trade decision execution.
|
||
|
||
5. **Flexibility Across Multiple Timeframes**: According to backtesting results, the strategy performs well on 4-hour, 1-hour, and 15-minute timeframes, making it suitable for different trading styles (swing trading, day trading, and scalping).
|
||
|
||
6. **Clear Candlestick Pattern Definitions**: The strategy has strict mathematical definitions for candlestick patterns, reducing subjective judgment and enhancing strategy consistency and reproducibility.
|
||
|
||
#### Strategy Risks
|
||
1. **Over-Filtering Risk**: While the multi-confirmation mechanism improves signal quality, it may also cause traders to miss some profitable opportunities. In rapidly changing markets, waiting for all conditions to be simultaneously met may cause traders to miss important entry points.
|
||
|
||
2. **Parameter Sensitivity**: The strategy uses multiple parameters (EMA length, RSI thresholds, MACD parameters, ATR multiplier, etc.), and small changes to these parameters may significantly impact strategy performance. These parameters may need to be re-optimized for different markets or timeframes.
|
||
|
||
3. **Trend Reversal Delay**: The EMA-based trend filter is a lagging indicator, which may cause traders to miss opportunities during early trend reversals or maintain positions at incorrect times.
|
||
|
||
4. **Drawdown Risk**: Despite setting stop-losses, actual losses may exceed expected ATR multiples under extreme market conditions (such as gaps or flash crashes).
|
||
|
||
5. **Poor Performance in Range-Bound Markets**: The strategy's effectiveness may be reduced when markets consolidate within narrow ranges, as it is primarily designed to capture trending moves.
|
||
|
||
6. **False Breakout Risk**: Especially in shorter timeframes, false candlestick pattern signals may appear, leading to unnecessary trades.
|
||
|
||
To mitigate these risks, traders can consider: (1) adjusting parameters for different market environments; (2) incorporating additional filtering conditions such as volatility thresholds or trend strength indicators; (3) using this strategy only in strong trending markets; (4) considering additional stop-loss placements to reduce maximum drawdown.
|
||
|
||
#### Strategy Optimization Directions
|
||
1. **Add Volatility Filters**: The existing strategy already uses ATR for risk management but could further utilize volatility indicators (such as Bollinger Band width or ATR percentage) to avoid trading in low-volatility markets or adjust position sizes during high-volatility periods.
|
||
|
||
2. **Integrate Volume Analysis**: The current strategy is entirely based on price data; introducing volume confirmation can improve signal quality. For example, requiring candlestick patterns to be accompanied by increased volume, or using OBV (On-Balance Volume) to confirm price trends.
|
||
|
||
3. **Dynamically Adjust Take-Profit and Stop-Loss Ratios**: The strategy currently uses a fixed 1.5x ATR for take-profit and stop-loss distances. Consider dynamically adjusting this multiplier based on market conditions, such as increasing stop-loss distances in high-volatility environments and setting farther take-profit targets in strong trends.
|
||
|
||
4. **Add Time Filters**: Some markets perform better during specific time periods (such as opening sessions or high-liquidity periods). Time filters can be added to generate signals only during the most favorable trading sessions.
|
||
|
||
5. **Implement Partial Take-Profit Strategy**: The current strategy uses a fixed full-position take-profit point. Implementing a staged take-profit approach would allow portions of the position to profit at closer targets while letting the remainder ride larger trend moves.
|
||
|
||
6. **Trend Strength Filtering**: Beyond simple EMA trend direction, adding trend strength indicators (such as ADX or candle continuity within trends) can help differentiate between strong and weak trends and adjust trading decisions accordingly.
|
||
|
||
7. **Add Market State Classification**: Develop a classification system to identify whether the market is in a trending or consolidating phase, and use different trading logic or parameter sets for different market states.
|
||
|
||
8. **Machine Learning Optimization**: Use machine learning algorithms to automatically optimize various parameter combinations, or train models on historical data to predict under which conditions the strategy is most likely to succeed.
|
||
|
||
#### Summary
|
||
The Multi-Confirmation Dynamic TP/SL Trading Strategy is a comprehensive, systematic trading system that identifies high-probability trading opportunities through multi-layered technical analysis. By combining EMA trend filtering, precisely defined candlestick patterns, RSI and MACD momentum confirmation, and ATR-based risk management, the strategy provides a structured approach to executing trading decisions while controlling risk.
|
||
|
||
While the strategy excels in trending markets, it may face challenges in range-bound and high-volatility environments. To further improve performance, consider adding volume analysis, volatility filters, and trend strength indicators, or implementing more sophisticated partial take-profit and dynamic risk management strategies.
|
||
|
||
The main advantage of this strategy lies in its strict multi-confirmation mechanism and adaptive risk management system, which allows it to adapt to various market conditions while maintaining a consistent risk-reward ratio. For traders looking to adopt a systematic, rule-driven trading approach, this is a powerful starting point that can be further customized according to individual trading styles and risk preferences.
|
||
[/trans]
|
||
|
||
|
||
|
||
> Source (PineScript)
|
||
|
||
``` pinescript
|
||
/*backtest
|
||
start: 2024-03-28 00:00:00
|
||
end: 2024-09-08 00:00:00
|
||
period: 1h
|
||
basePeriod: 1h
|
||
exchanges: [{"eid":"Futures_Binance","currency":"ETH_USDT"}]
|
||
*/
|
||
|
||
//@version=5
|
||
strategy("Enhanced Trading Strategy with RSI, MACD, TP/SL", overlay=true)
|
||
|
||
// === EMA Settings ===
|
||
emaLength = 50
|
||
emaFilter = ta.ema(close, emaLength)
|
||
|
||
// === RSI Settings ===
|
||
rsiLength = 14
|
||
rsi = ta.rsi(close, rsiLength)
|
||
|
||
// === MACD Settings ===
|
||
[macdLine, signalLine, _] = ta.macd(close, 12, 26, 9)
|
||
|
||
// === Engulfing Detection ===
|
||
avgBody = ta.sma(math.abs(close - open), 5)
|
||
bodySize = math.abs(close - open)
|
||
prevBodySize = math.abs(close[1] - open[1])
|
||
|
||
bullishEngulfing = close[1] < open[1] and close > open and close > open[1] and open < close[1] and bodySize > prevBodySize * 1.5 and bodySize > avgBody and close > emaFilter
|
||
bearishEngulfing = close[1] > open[1] and close < open and close < open[1] and open > close[1] and bodySize > prevBodySize * 1.5 and bodySize > avgBody and close < emaFilter
|
||
|
||
// === Pin Bar Detection ===
|
||
candleSize = high - low
|
||
upperShadow = high - math.max(open, close)
|
||
lowerShadow = math.min(open, close) - low
|
||
shadowRatio = 2.5
|
||
|
||
bullishPinBar = lowerShadow > (candleSize * 0.66) and upperShadow < (candleSize * 0.33) and lowerShadow > bodySize * shadowRatio and close > emaFilter
|
||
bearishPinBar = upperShadow > (candleSize * 0.66) and lowerShadow < (candleSize * 0.33) and upperShadow > bodySize * shadowRatio and close < emaFilter
|
||
|
||
// === RSI & MACD Filtering ===
|
||
rsiFilterBuy = rsi < 70
|
||
rsiFilterSell = rsi > 30
|
||
macdFilterBuy = macdLine > signalLine
|
||
macdFilterSell = macdLine < signalLine
|
||
|
||
// === Buy/Sell Conditions ===
|
||
buySignal = (bullishEngulfing or bullishPinBar) and rsiFilterBuy and macdFilterBuy
|
||
sellSignal = (bearishEngulfing or bearishPinBar) and rsiFilterSell and macdFilterSell
|
||
|
||
// === ATR-based Take Profit & Stop Loss ===
|
||
atrMult = 1.5
|
||
atrValue = ta.atr(14)
|
||
tpLevel = atrValue * atrMult
|
||
slLevel = atrValue * atrMult
|
||
|
||
// === Strategy Execution ===
|
||
if buySignal
|
||
strategy.entry("BUY", strategy.long)
|
||
strategy.exit("TP/SL", from_entry="BUY", limit=close + tpLevel, stop=close - slLevel)
|
||
|
||
if sellSignal
|
||
strategy.entry("SELL", strategy.short)
|
||
strategy.exit("TP/SL", from_entry="SELL", limit=close - tpLevel, stop=close + slLevel)
|
||
|
||
// === Plot EMA ===
|
||
plot(emaFilter, title="EMA 50", color=color.blue, linewidth=2)
|
||
|
||
// === Plot Buy/Sell Signals ===
|
||
// plotshape(series=buySignal, location=location.belowbar, color=color.green, style=shape.labelup, size=size.small, title="BUY Signal", text="BUY")
|
||
// plotshape(series=sellSignal, location=location.abovebar, color=color.red, style=shape.labeldown, size=size.small, title="SELL Signal", text="SELL")
|
||
|
||
// === Alert Conditions ===
|
||
alertcondition(buySignal, title="BUY Alert", message="Buy Signal Detected!")
|
||
alertcondition(sellSignal, title="SELL Alert", message="Sell Signal Detected!")
|
||
|
||
```
|
||
|
||
> Detail
|
||
|
||
https://www.fmz.com/strategy/488521
|
||
|
||
> Last Modified
|
||
|
||
2025-03-28 15:37:01
|