
166 lines
7.8 KiB
Markdown
166 lines
7.8 KiB
Markdown
|
|
> Name
|
|
|
|
多重波浪趋势交叉风险管理量化策略-Multi-Wave-Trend-Crossing-Risk-Management-Quantitative-Strategy
|
|
|
|
> Author
|
|
|
|
ChaoZhang
|
|
|
|
> Strategy Description
|
|
|
|
|
|
|
|
[trans]
|
|
#### 概述
|
|
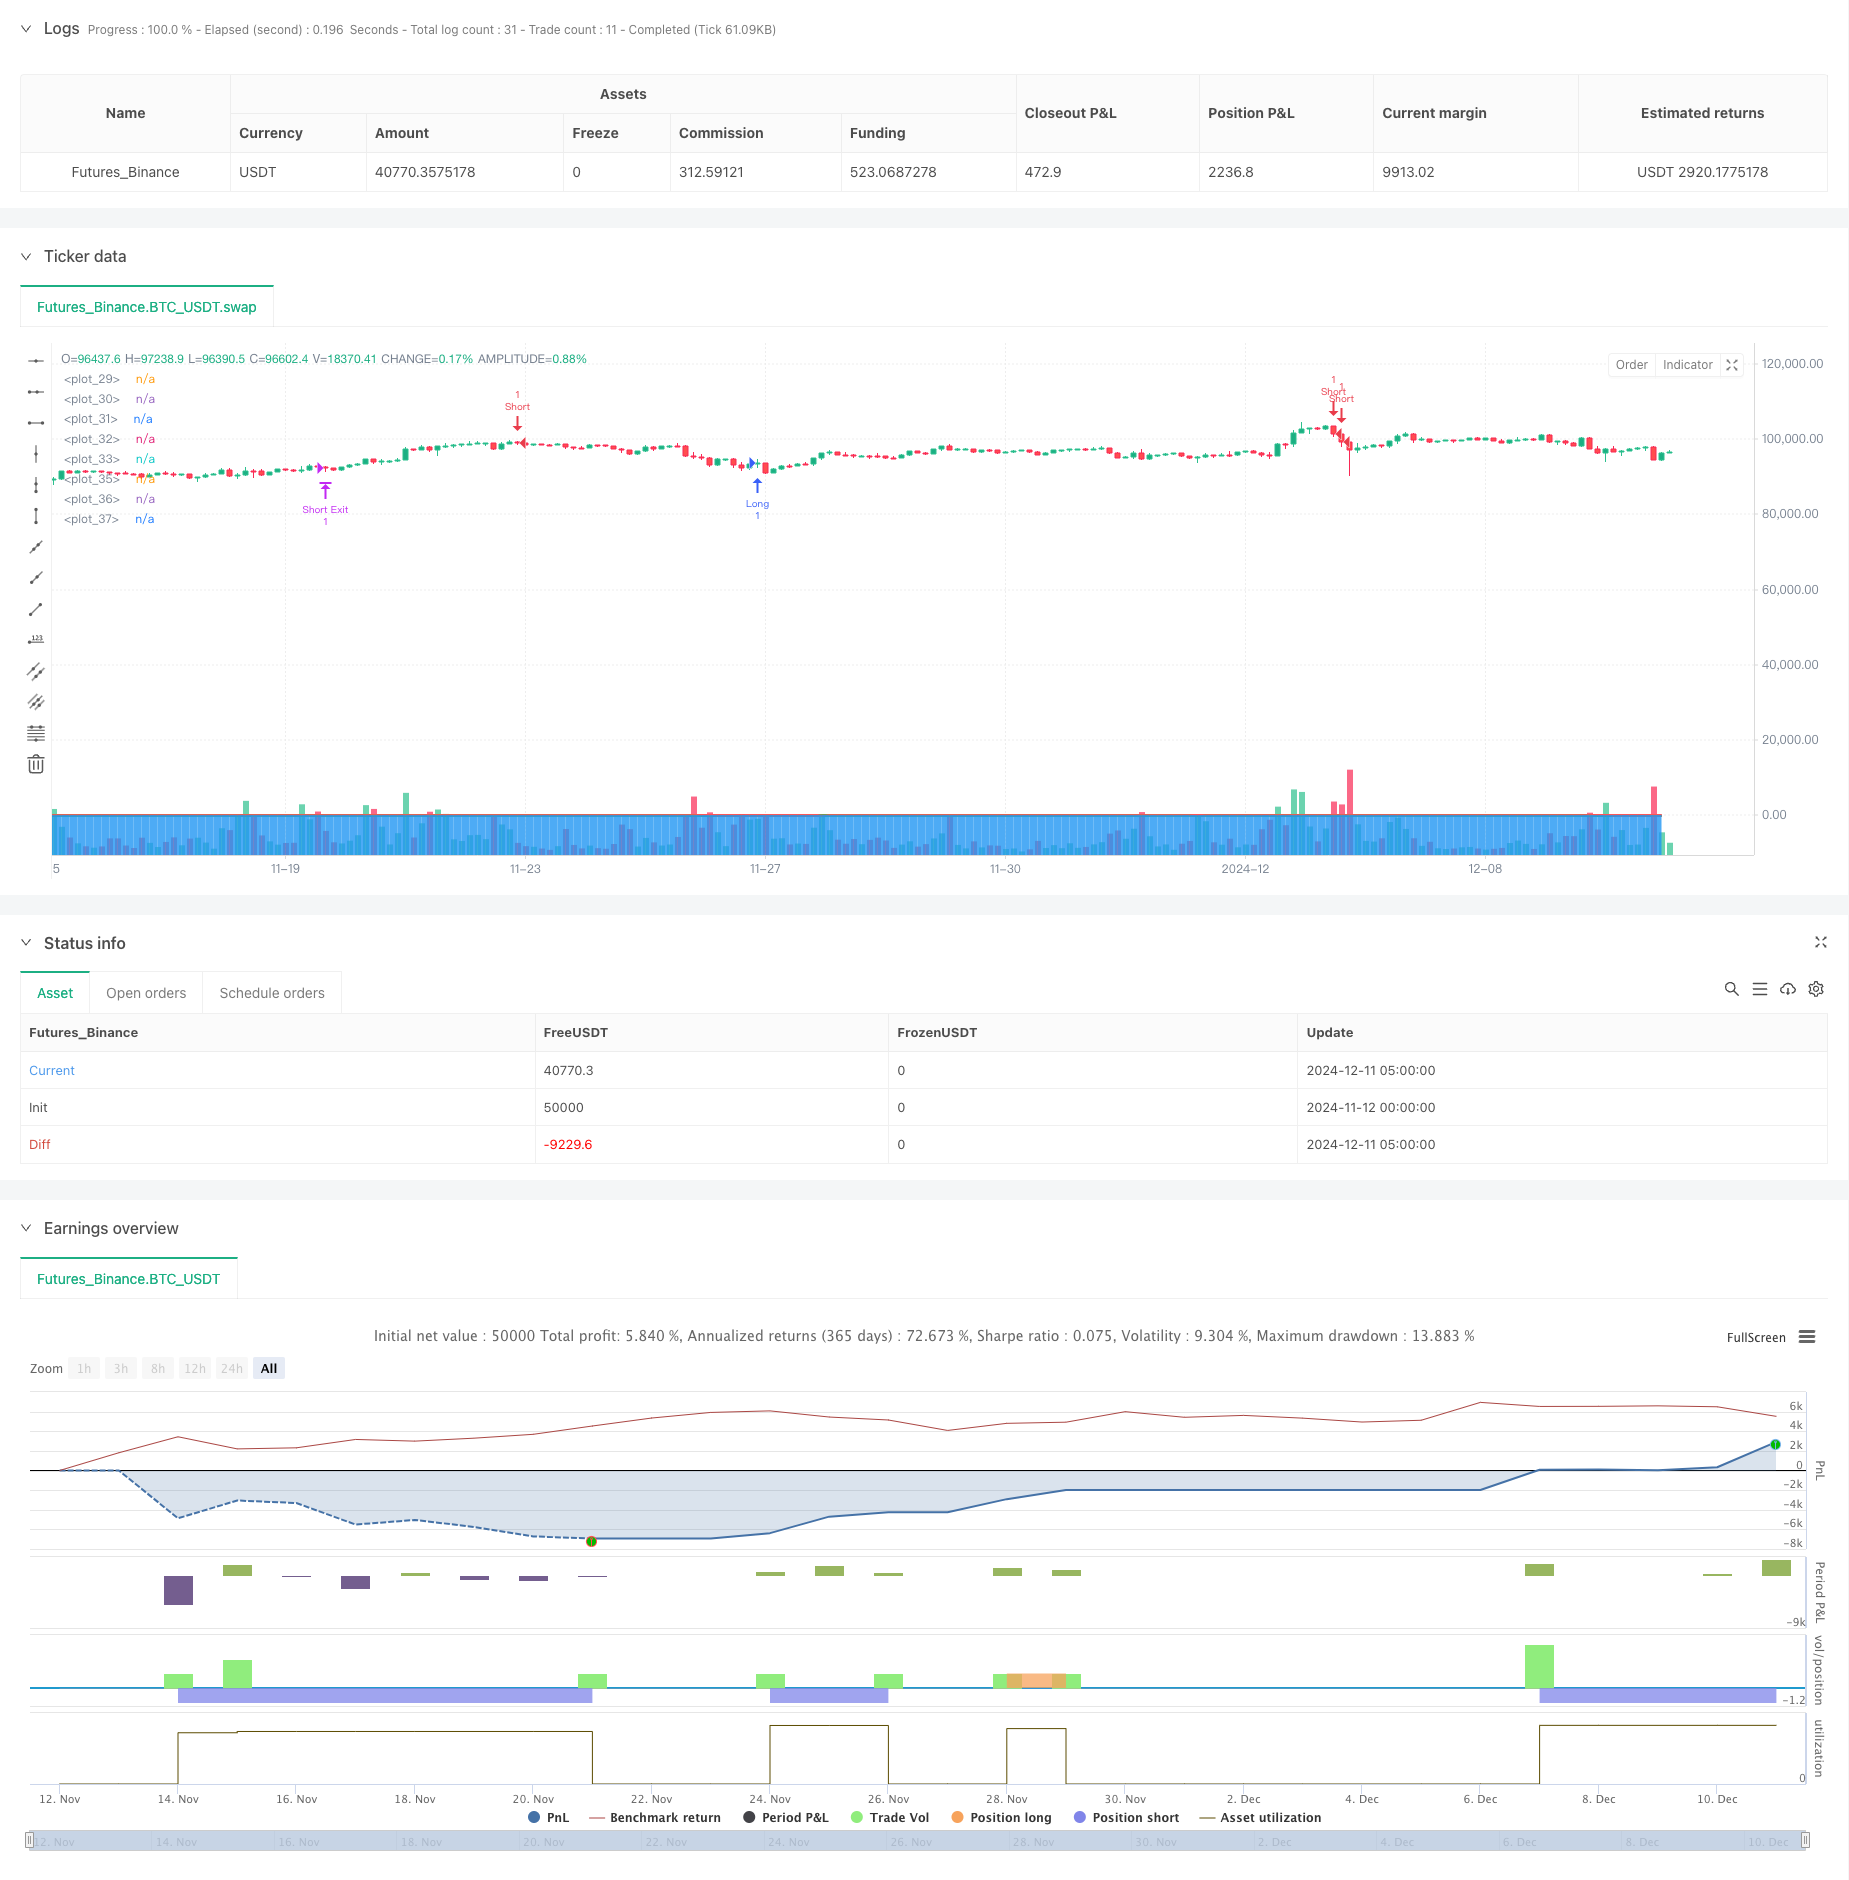
该策略是一个基于WaveTrend指标的量化交易系统,结合了动态风险管理机制。策略通过计算价格波动的趋势强度,在超买超卖区域进行信号过滤,同时应用了止损、止盈和追踪止损等风险控制手段,实现了全方位的交易管理。
|
|
|
|
#### 策略原理
|
|
策略的核心是通过HLC3价格计算WaveTrend指标。首先计算n1周期的指数移动平均线(EMA)作为基准线,然后计算价格与基准线的偏差,并使用0.015作为系数进行归一化处理。最终得到两条波浪线wt1和wt2,分别代表快线和慢线。交易信号基于这两条线与超买超卖水平的交叉产生,同时结合了多层次的风险控制系统。
|
|
|
|
#### 策略优势
|
|
1. 信号系统具有良好的趋势跟踪能力,通过双重超买超卖水平提高了信号的可靠性
|
|
2. 完整的风险管理体系,包含固定止损、固定止盈和动态追踪止损
|
|
3. 参数可调节性强,便于根据不同市场情况进行优化
|
|
4. 结合了波动率自适应机制,提高了策略的适应性
|
|
5. 通过分层设计的信号系统,有效降低了虚假信号的影响
|
|
|
|
#### 策略风险
|
|
1. 在剧烈波动市场中可能出现止损频繁的情况
|
|
2. 参数设置不当可能导致交易成本过高
|
|
3. 在横盘市场中可能产生过多假信号
|
|
4. 需要合理设置止损和止盈比例,避免风险收益比失衡
|
|
5. 追踪止损可能在快速反转行情中导致较大回撤
|
|
|
|
#### 策略优化方向
|
|
1. 引入成交量指标进行信号确认,提高交易的可靠性
|
|
2. 优化追踪止损参数,使其更好地适应不同的市场环境
|
|
3. 增加趋势强度过滤器,减少横盘市场的交易频率
|
|
4. 考虑加入动态止损机制,根据市场波动率自动调整止损位置
|
|
5. 引入时间过滤器,避免在不利的交易时段开仓
|
|
|
|
#### 总结
|
|
该策略通过结合WaveTrend指标和完善的风险管理系统,实现了一个较为全面的量化交易策略。策略的核心优势在于其适应性强且风险可控,但仍需要交易者根据实际市场情况进行参数优化和策略改进。通过持续优化和完善,该策略有望在实际交易中取得稳定的收益。
|
|
|
|
||
|
|
|
|
#### Overview
|
|
This strategy is a quantitative trading system based on the WaveTrend indicator, incorporating dynamic risk management mechanisms. The strategy calculates trend strength through price fluctuations, filters signals in overbought and oversold regions, and applies risk control measures including stop-loss, take-profit, and trailing stop mechanisms.
|
|
|
|
#### Strategy Principles
|
|
The core of the strategy lies in calculating the WaveTrend indicator using HLC3 prices. It first computes an n1-period exponential moving average (EMA) as a baseline, then calculates price deviations from this baseline, normalizing them with a 0.015 coefficient. This results in two wave lines, wt1 and wt2, representing fast and slow lines respectively. Trading signals are generated based on these lines crossing overbought and oversold levels, combined with a multi-layered risk control system.
|
|
|
|
#### Strategy Advantages
|
|
1. The signal system demonstrates excellent trend-following capabilities with enhanced reliability through dual overbought/oversold levels
|
|
2. Comprehensive risk management system including fixed stop-loss, take-profit, and dynamic trailing stop
|
|
3. Highly adjustable parameters for optimization across different market conditions
|
|
4. Incorporates volatility-adaptive mechanisms for improved adaptability
|
|
5. Layered signal system design effectively reduces the impact of false signals
|
|
|
|
#### Strategy Risks
|
|
1. Frequent stop-losses may occur in highly volatile markets
|
|
2. Improper parameter settings can lead to excessive trading costs
|
|
3. May generate excessive false signals in ranging markets
|
|
4. Requires careful calibration of stop-loss and take-profit ratios to maintain risk-reward balance
|
|
5. Trailing stops might result in significant drawdowns during quick market reversals
|
|
|
|
#### Optimization Directions
|
|
1. Incorporate volume indicators for signal confirmation to enhance trading reliability
|
|
2. Optimize trailing stop parameters for better adaptation to various market conditions
|
|
3. Add trend strength filters to reduce trading frequency in ranging markets
|
|
4. Consider implementing dynamic stop-loss mechanisms that automatically adjust based on market volatility
|
|
5. Introduce time filters to avoid entering positions during unfavorable trading periods
|
|
|
|
#### Summary
|
|
This strategy achieves a comprehensive quantitative trading approach by combining the WaveTrend indicator with a robust risk management system. Its core strengths lie in its adaptability and controlled risk exposure, though traders need to optimize parameters and improve the strategy based on actual market conditions. Through continuous optimization and refinement, this strategy shows promise for achieving stable returns in real trading environments.
|
|
[/trans]
|
|
|
|
|
|
|
|
> Source (PineScript)
|
|
|
|
``` pinescript
|
|
/*backtest
|
|
start: 2024-11-12 00:00:00
|
|
end: 2024-12-11 08:00:00
|
|
period: 3h
|
|
basePeriod: 3h
|
|
exchanges: [{"eid":"Futures_Binance","currency":"BTC_USDT"}]
|
|
*/
|
|
|
|
//@version=5
|
|
strategy(title="WaveTrend [LazyBear] with Risk Management", shorttitle="WT_LB_RM", overlay=true)
|
|
|
|
// Input Parameters
|
|
n1 = input.int(10, "Channel Length")
|
|
n2 = input.int(21, "Average Length")
|
|
obLevel1 = input.int(60, "Over Bought Level 1")
|
|
obLevel2 = input.int(53, "Over Bought Level 2")
|
|
osLevel1 = input.int(-60, "Over Sold Level 1")
|
|
osLevel2 = input.int(-53, "Over Sold Level 2")
|
|
|
|
// Risk Management Inputs
|
|
stopLossPercent = input.float(50.0, "Stop Loss (%)", minval=0.1, maxval=100)
|
|
takeProfitPercent = input.float(5.0, "Take Profit (%)", minval=0.1, maxval=100)
|
|
trailingStopPercent = input.float(3.0, "Trailing Stop (%)", minval=0.1, maxval=100)
|
|
trailingStepPercent = input.float(2.0, "Trailing Stop Step (%)", minval=0.1, maxval=100)
|
|
|
|
// WaveTrend Calculation
|
|
ap = hlc3
|
|
esa = ta.ema(ap, n1)
|
|
d = ta.ema(math.abs(ap - esa), n1)
|
|
ci = (ap - esa) / (0.015 * d)
|
|
tci = ta.ema(ci, n2)
|
|
|
|
wt1 = tci
|
|
wt2 = ta.sma(wt1, 4)
|
|
|
|
// Plotting Original Indicators
|
|
plot(0, color=color.gray)
|
|
plot(obLevel1, color=color.red)
|
|
plot(osLevel1, color=color.green)
|
|
plot(obLevel2, color=color.red, style=plot.style_line)
|
|
plot(osLevel2, color=color.green, style=plot.style_line)
|
|
|
|
plot(wt1, color=color.green)
|
|
plot(wt2, color=color.red, style=plot.style_line)
|
|
plot(wt1-wt2, color=color.blue, style=plot.style_area, transp=80)
|
|
|
|
// Buy and Sell Signals with Risk Management
|
|
longCondition = ta.crossover(wt1, osLevel1) or ta.crossover(wt1, osLevel2)
|
|
shortCondition = ta.crossunder(wt1, obLevel1) or ta.crossunder(wt1, obLevel2)
|
|
|
|
// Strategy Entry with Risk Management
|
|
if (longCondition)
|
|
entryPrice = close
|
|
stopLossPrice = entryPrice * (1 - stopLossPercent/100)
|
|
takeProfitPrice = entryPrice * (1 + takeProfitPercent/100)
|
|
|
|
strategy.entry("Long", strategy.long)
|
|
strategy.exit("Long Exit", "Long",
|
|
stop=stopLossPrice,
|
|
limit=takeProfitPrice,
|
|
trail_price=close * (1 + trailingStopPercent/100),
|
|
trail_offset=close * (trailingStepPercent/100))
|
|
|
|
if (shortCondition)
|
|
entryPrice = close
|
|
stopLossPrice = entryPrice * (1 + stopLossPercent/100)
|
|
takeProfitPrice = entryPrice * (1 - takeProfitPercent/100)
|
|
|
|
strategy.entry("Short", strategy.short)
|
|
strategy.exit("Short Exit", "Short",
|
|
stop=stopLossPrice,
|
|
limit=takeProfitPrice,
|
|
trail_price=close * (1 - trailingStopPercent/100),
|
|
trail_offset=close * (trailingStepPercent/100))
|
|
```
|
|
|
|
> Detail
|
|
|
|
https://www.fmz.com/strategy/474965
|
|
|
|
> Last Modified
|
|
|
|
2024-12-13 10:51:31
|