
173 lines
8.6 KiB
Markdown
173 lines
8.6 KiB
Markdown
|
|
> Name
|
|
|
|
多重均线趋势跟踪交易策略-Multi-EMA-Trend-Following-Trading-Strategy
|
|
|
|
> Author
|
|
|
|
ChaoZhang
|
|
|
|
> Strategy Description
|
|
|
|
|
|
|
|
[trans]
|
|
#### 概述
|
|
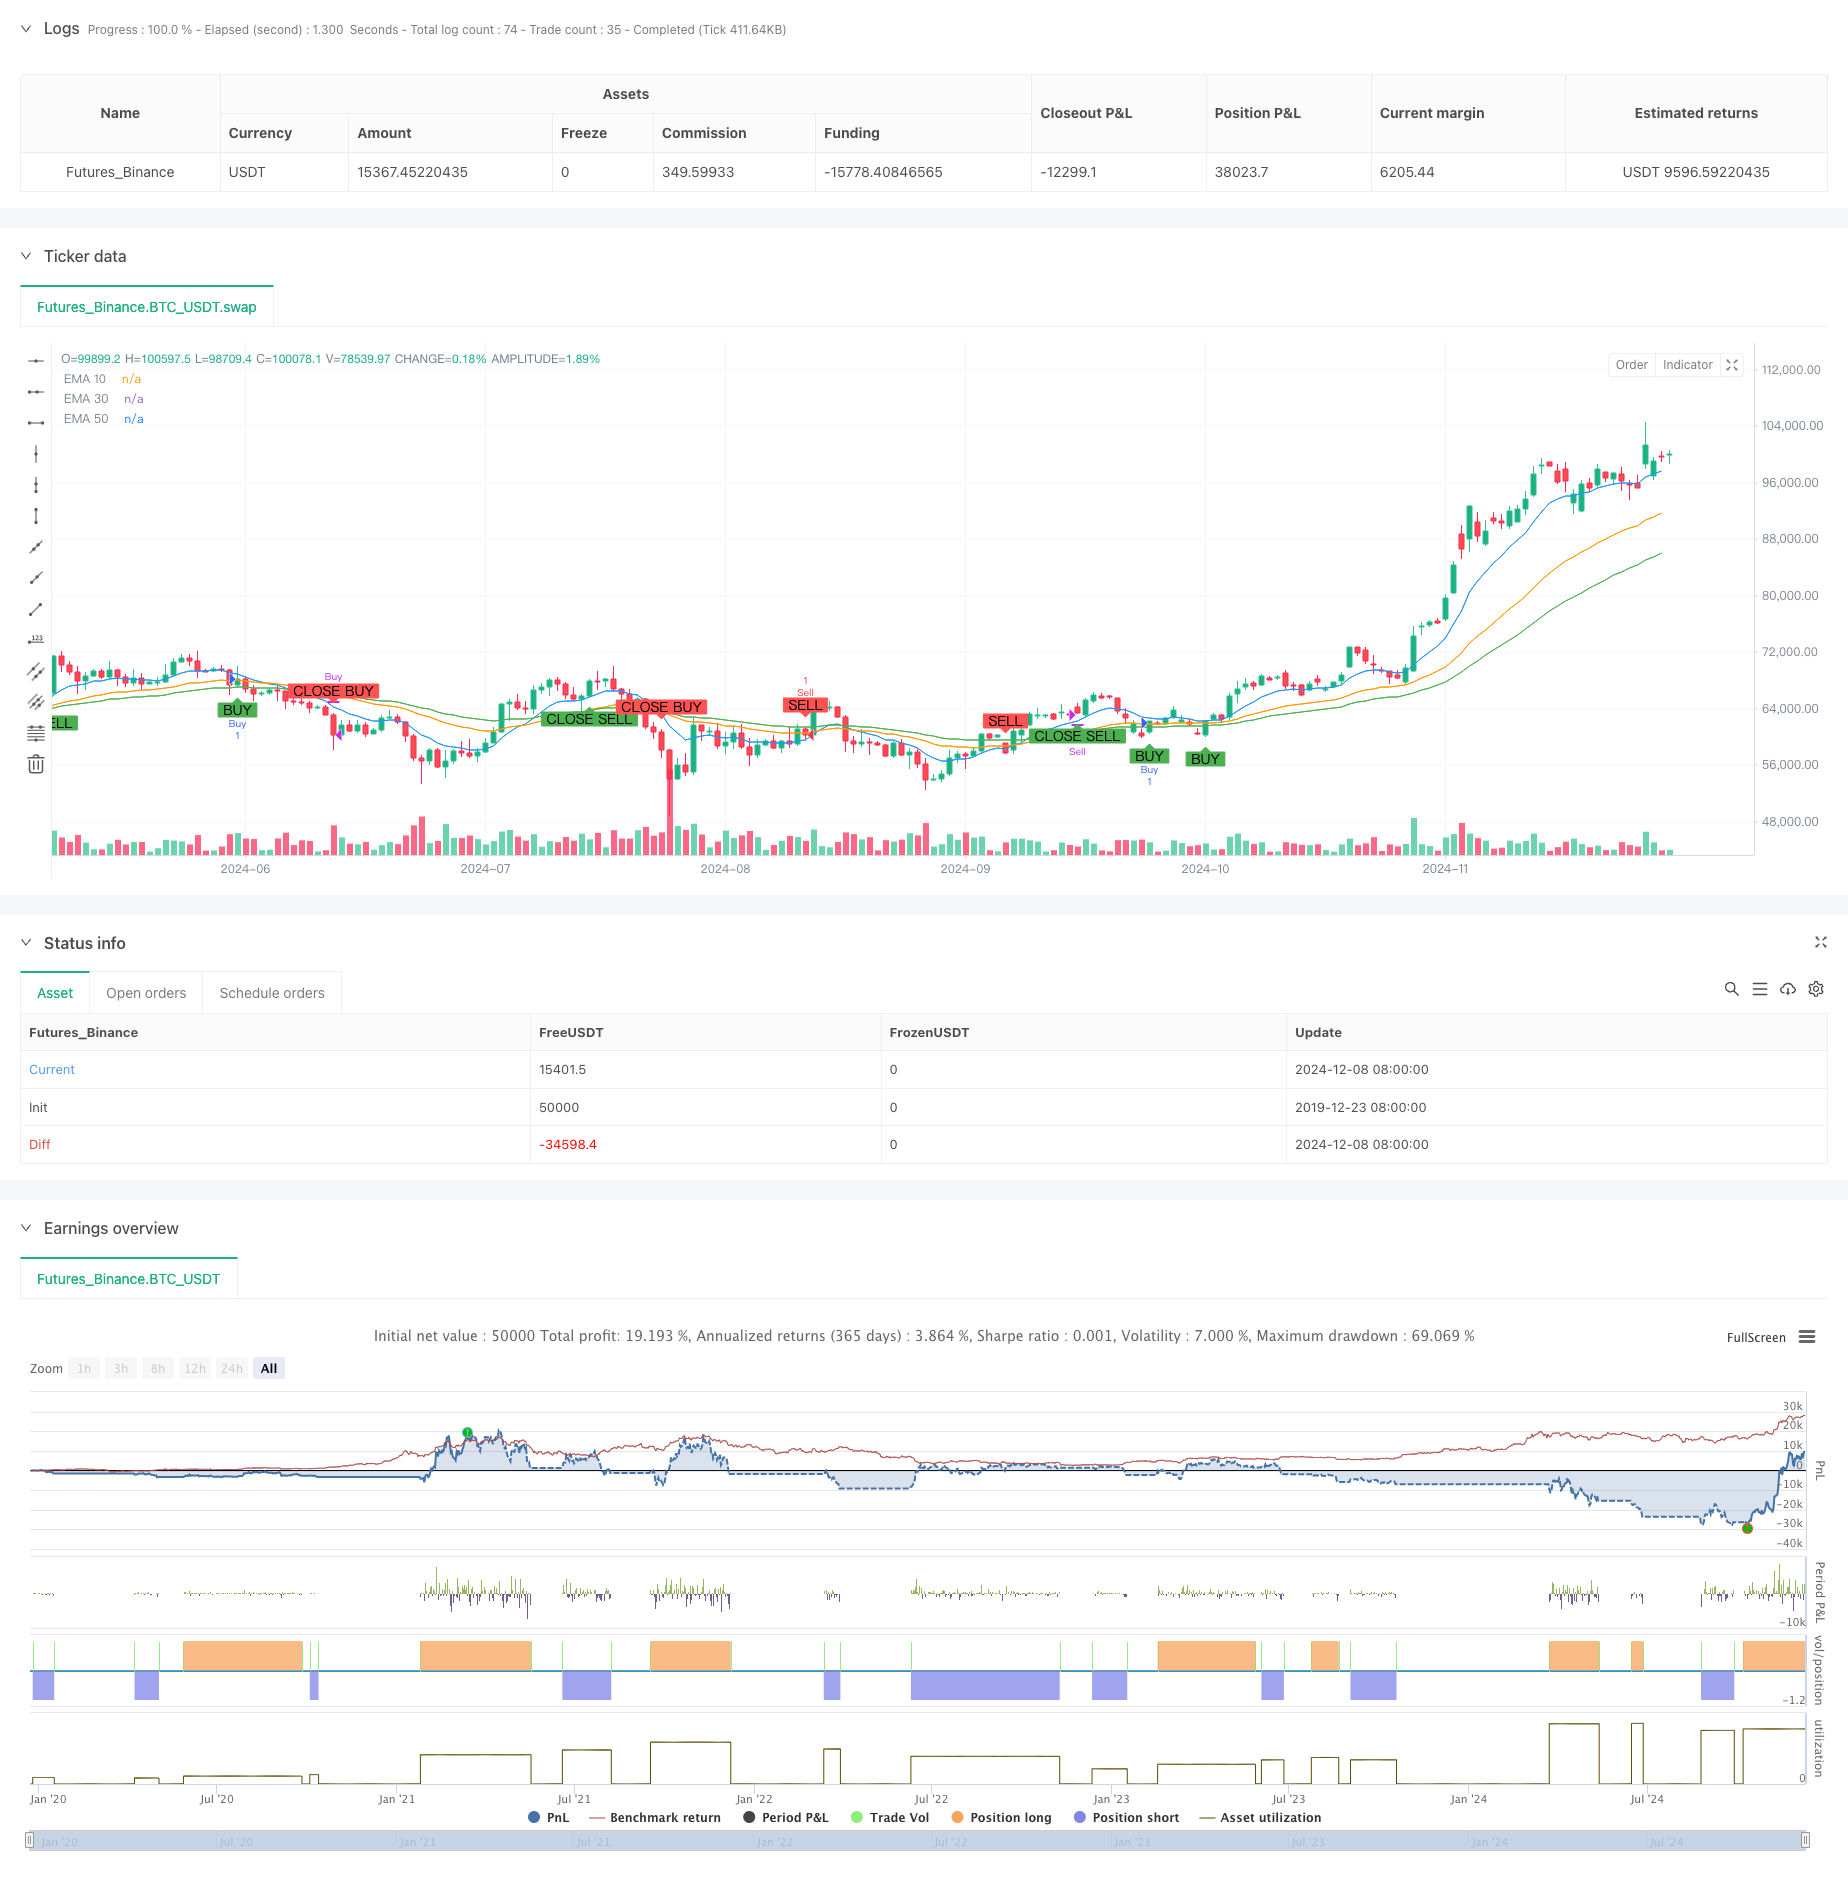
该策略是一个基于多重指数移动平均线(EMA)的趋势跟踪交易系统。通过运用三条不同周期(10、30、50)的EMA线,结合价格穿越和趋势方向判断,构建了一个完整的买卖信号系统。策略设计充分考虑了趋势的形成、确认和转折,能够有效捕捉市场中的主要趋势性机会。
|
|
|
|
#### 策略原理
|
|
策略采用了层级式的判断机制来确定交易信号:
|
|
1. 趋势判断层:使用三条EMA(10/30/50)的位置关系判断趋势方向。当EMA10 > EMA30 > EMA50时判定为上升趋势;当EMA50 > EMA30 > EMA10时判定为下降趋势。
|
|
2. 信号触发层:在趋势确立的基础上,通过价格与EMA30的交叉来触发具体的交易信号。向上穿越EMA30触发买入,向下穿越触发卖出。
|
|
3. 平仓管理层:当EMA30与EMA50发生反向交叉时,触发对应方向的平仓信号。这提供了一个系统性的退出机制。
|
|
|
|
#### 策略优势
|
|
1. 多重确认机制:通过多条均线的排列和交叉提供多重确认,降低假信号干扰。
|
|
2. 趋势跟踪性强:能够较好地把握主要趋势,有效过滤短期波动。
|
|
3. 系统性强:入场和出场条件明确,不受主观判断影响。
|
|
4. 适应性好:可以通过调整EMA参数来适应不同市场环境。
|
|
5. 风险控制合理:通过趋势转折信号及时止损,控制风险。
|
|
|
|
#### 策略风险
|
|
1. 横盘风险:在市场震荡时可能产生频繁假信号,导致连续亏损。
|
|
2. 滞后性风险:均线系统具有一定滞后性,可能错过趋势初期的重要价格机会。
|
|
3. 跳空风险:可能在剧烈波动时遭遇较大跳空缺口,影响策略表现。
|
|
4. 参数敏感性:不同参数组合可能导致策略表现差异较大。
|
|
|
|
#### 策略优化方向
|
|
1. 引入波动率指标:建议加入ATR等波动率指标来动态调整仓位大小,提高资金使用效率。
|
|
2. 优化信号过滤:可以增加成交量、动量等辅助指标来过滤假信号。
|
|
3. 完善止损机制:建议增加跟踪止损功能,更好地保护已有利润。
|
|
4. 增加时间过滤:可以添加交易时间段限制,避开波动较大的时间段。
|
|
5. 参数自适应:考虑引入自适应机制,根据市场状态动态调整EMA参数。
|
|
|
|
#### 总结
|
|
这是一个设计合理、逻辑清晰的趋势跟踪策略。通过多重均线的配合使用,既保证了策略的稳定性,又提供了清晰的交易信号。虽然存在一定的滞后性风险,但通过合理的优化和风险控制措施,策略整体表现出较好的实用价值。特别适合追求稳定收益、风险可控的交易者使用。 ||
|
|
|
|
#### Overview
|
|
This strategy is a trend following trading system based on multiple Exponential Moving Averages (EMAs). By utilizing three EMAs with different periods (10, 30, 50), combined with price crossovers and trend direction analysis, it constructs a complete buy and sell signal system. The strategy thoroughly considers trend formation, confirmation, and reversal, effectively capturing major trending opportunities in the market.
|
|
|
|
#### Strategy Principle
|
|
The strategy employs a hierarchical judgment mechanism to determine trading signals:
|
|
1. Trend Determination Layer: Uses the relative positions of three EMAs (10/30/50) to judge trend direction. An uptrend is identified when EMA10 > EMA30 > EMA50; a downtrend when EMA50 > EMA30 > EMA10.
|
|
2. Signal Trigger Layer: Once a trend is established, trading signals are triggered by price crossovers with EMA30. Upward crosses trigger buy signals, downward crosses trigger sell signals.
|
|
3. Position Management Layer: When EMA30 crosses EMA50 in the opposite direction, it triggers corresponding position closing signals, providing a systematic exit mechanism.
|
|
|
|
#### Strategy Advantages
|
|
1. Multiple Confirmation Mechanism: Multiple line arrangements and crossovers provide multiple confirmations, reducing false signal interference.
|
|
2. Strong Trend Following: Effectively captures major trends while filtering short-term fluctuations.
|
|
3. Systematic Approach: Clear entry and exit conditions, minimizing subjective judgment.
|
|
4. Good Adaptability: Can adapt to different market environments through EMA parameter adjustments.
|
|
5. Reasonable Risk Control: Timely stop-loss through trend reversal signals.
|
|
|
|
#### Strategy Risks
|
|
1. Sideways Market Risk: May generate frequent false signals during market consolidation, leading to consecutive losses.
|
|
2. Lag Risk: EMA systems have inherent lag, potentially missing important price opportunities at trend beginnings.
|
|
3. Gap Risk: May encounter significant price gaps during volatile periods, affecting strategy performance.
|
|
4. Parameter Sensitivity: Different parameter combinations may lead to significant performance variations.
|
|
|
|
#### Strategy Optimization Directions
|
|
1. Incorporate Volatility Indicators: Suggest adding ATR or similar indicators for dynamic position sizing and improved capital efficiency.
|
|
2. Optimize Signal Filtering: Can add volume, momentum, or other auxiliary indicators to filter false signals.
|
|
3. Improve Stop-Loss Mechanism: Recommend adding trailing stop-loss functionality for better profit protection.
|
|
4. Add Time Filters: Consider adding trading time restrictions to avoid highly volatile periods.
|
|
5. Parameter Adaptation: Consider introducing adaptive mechanisms for dynamic EMA parameter adjustment based on market conditions.
|
|
|
|
#### Summary
|
|
This is a well-designed trend following strategy with clear logic. The combination of multiple EMAs ensures both strategy stability and clear trading signals. While there are some inherent lag risks, the strategy demonstrates good practical value through reasonable optimization and risk control measures. It is particularly suitable for traders seeking stable returns with controlled risk.[/trans]
|
|
|
|
|
|
|
|
> Source (PineScript)
|
|
|
|
``` pinescript
|
|
/*backtest
|
|
start: 2019-12-23 08:00:00
|
|
end: 2024-12-09 08:00:00
|
|
period: 1d
|
|
basePeriod: 1d
|
|
exchanges: [{"eid":"Futures_Binance","currency":"BTC_USDT"}]
|
|
*/
|
|
|
|
// This Pine Script™ code is subject to the terms of the Mozilla Public License 2.0 at https://mozilla.org/MPL/2.0/
|
|
// © banyat6913
|
|
|
|
//@version=5
|
|
strategy("EMA Trend Strategy", overlay=true)
|
|
|
|
// Input Parameters
|
|
ema_short_length = input.int(10, title="EMA Short Length", minval=1)
|
|
ema_mid_length = input.int(30, title="EMA Mid Length", minval=1)
|
|
ema_long_length = input.int(50, title="EMA Long Length", minval=1)
|
|
|
|
// Calculate EMA
|
|
ema_short = ta.ema(close, ema_short_length)
|
|
ema_mid = ta.ema(close, ema_mid_length)
|
|
ema_long = ta.ema(close, ema_long_length)
|
|
|
|
// **TREND UP**
|
|
// 1. EMA 10 > EMA 30 > EMA 50
|
|
uptrend_condition = ema_short > ema_mid and ema_mid > ema_long
|
|
|
|
// 2. Bullish Candle Crossing Up EMA 30
|
|
bullish_candle = close > open
|
|
cross_up_ema_mid = ta.crossover(close, ema_mid)
|
|
|
|
// 3. If EMA 30 crosses down EMA 50 -> Close Buy Order
|
|
ema_30_cross_down_50 = ta.crossunder(ema_mid, ema_long)
|
|
|
|
// Buy Signal
|
|
buy_signal = uptrend_condition and cross_up_ema_mid
|
|
|
|
// Sell Signal for closing Buy Order
|
|
close_buy_signal = ema_30_cross_down_50
|
|
|
|
// **TREND DOWN**
|
|
// 1. EMA 50 > EMA 30 > EMA 10
|
|
downtrend_condition = ema_long > ema_mid and ema_mid > ema_short
|
|
|
|
// 2. Bearish Candle Crossing Down EMA 30
|
|
bearish_candle = close < open
|
|
cross_down_ema_mid = ta.crossunder(close, ema_mid)
|
|
|
|
// 3. If EMA 30 crosses up EMA 50 -> Close Sell Order
|
|
ema_30_cross_up_50 = ta.crossover(ema_mid, ema_long)
|
|
|
|
// Sell Signal
|
|
sell_signal = downtrend_condition and cross_down_ema_mid
|
|
|
|
// Buy Signal for closing Sell Order
|
|
close_sell_signal = ema_30_cross_up_50
|
|
|
|
// Backtesting Logic
|
|
if (buy_signal)
|
|
strategy.entry("Buy", strategy.long)
|
|
if (close_buy_signal)
|
|
strategy.close("Buy")
|
|
|
|
if (sell_signal)
|
|
strategy.entry("Sell", strategy.short)
|
|
if (close_sell_signal)
|
|
strategy.close("Sell")
|
|
|
|
// Plot EMA Lines
|
|
plot(ema_short, color=color.blue, title="EMA 10")
|
|
plot(ema_mid, color=color.orange, title="EMA 30")
|
|
plot(ema_long, color=color.green, title="EMA 50")
|
|
|
|
// Plot Buy and Sell Signals on Chart
|
|
plotshape(buy_signal, style=shape.labelup, location=location.belowbar, color=color.new(color.green, 0), text="BUY", title="Buy Signal")
|
|
plotshape(close_buy_signal, style=shape.labeldown, location=location.abovebar, color=color.new(color.red, 0), text="CLOSE BUY", title="Close Buy Signal")
|
|
plotshape(sell_signal, style=shape.labeldown, location=location.abovebar, color=color.new(color.red, 0), text="SELL", title="Sell Signal")
|
|
plotshape(close_sell_signal, style=shape.labelup, location=location.belowbar, color=color.new(color.green, 0), text="CLOSE SELL", title="Close Sell Signal")
|
|
|
|
```
|
|
|
|
> Detail
|
|
|
|
https://www.fmz.com/strategy/474683
|
|
|
|
> Last Modified
|
|
|
|
2024-12-11 15:44:14
|