
157 lines
7.3 KiB
Markdown
157 lines
7.3 KiB
Markdown
|
|
> Name
|
|
|
|
多重均线协同趋势波动交易策略基于ATR动态风控-Multi-EMA-Trend-Following-Swing-Trading-Strategy-with-ATR-Based-Risk-Management
|
|
|
|
> Author
|
|
|
|
ChaoZhang
|
|
|
|
> Strategy Description
|
|
|
|
|
|
|
|
[trans]
|
|
#### 概述
|
|
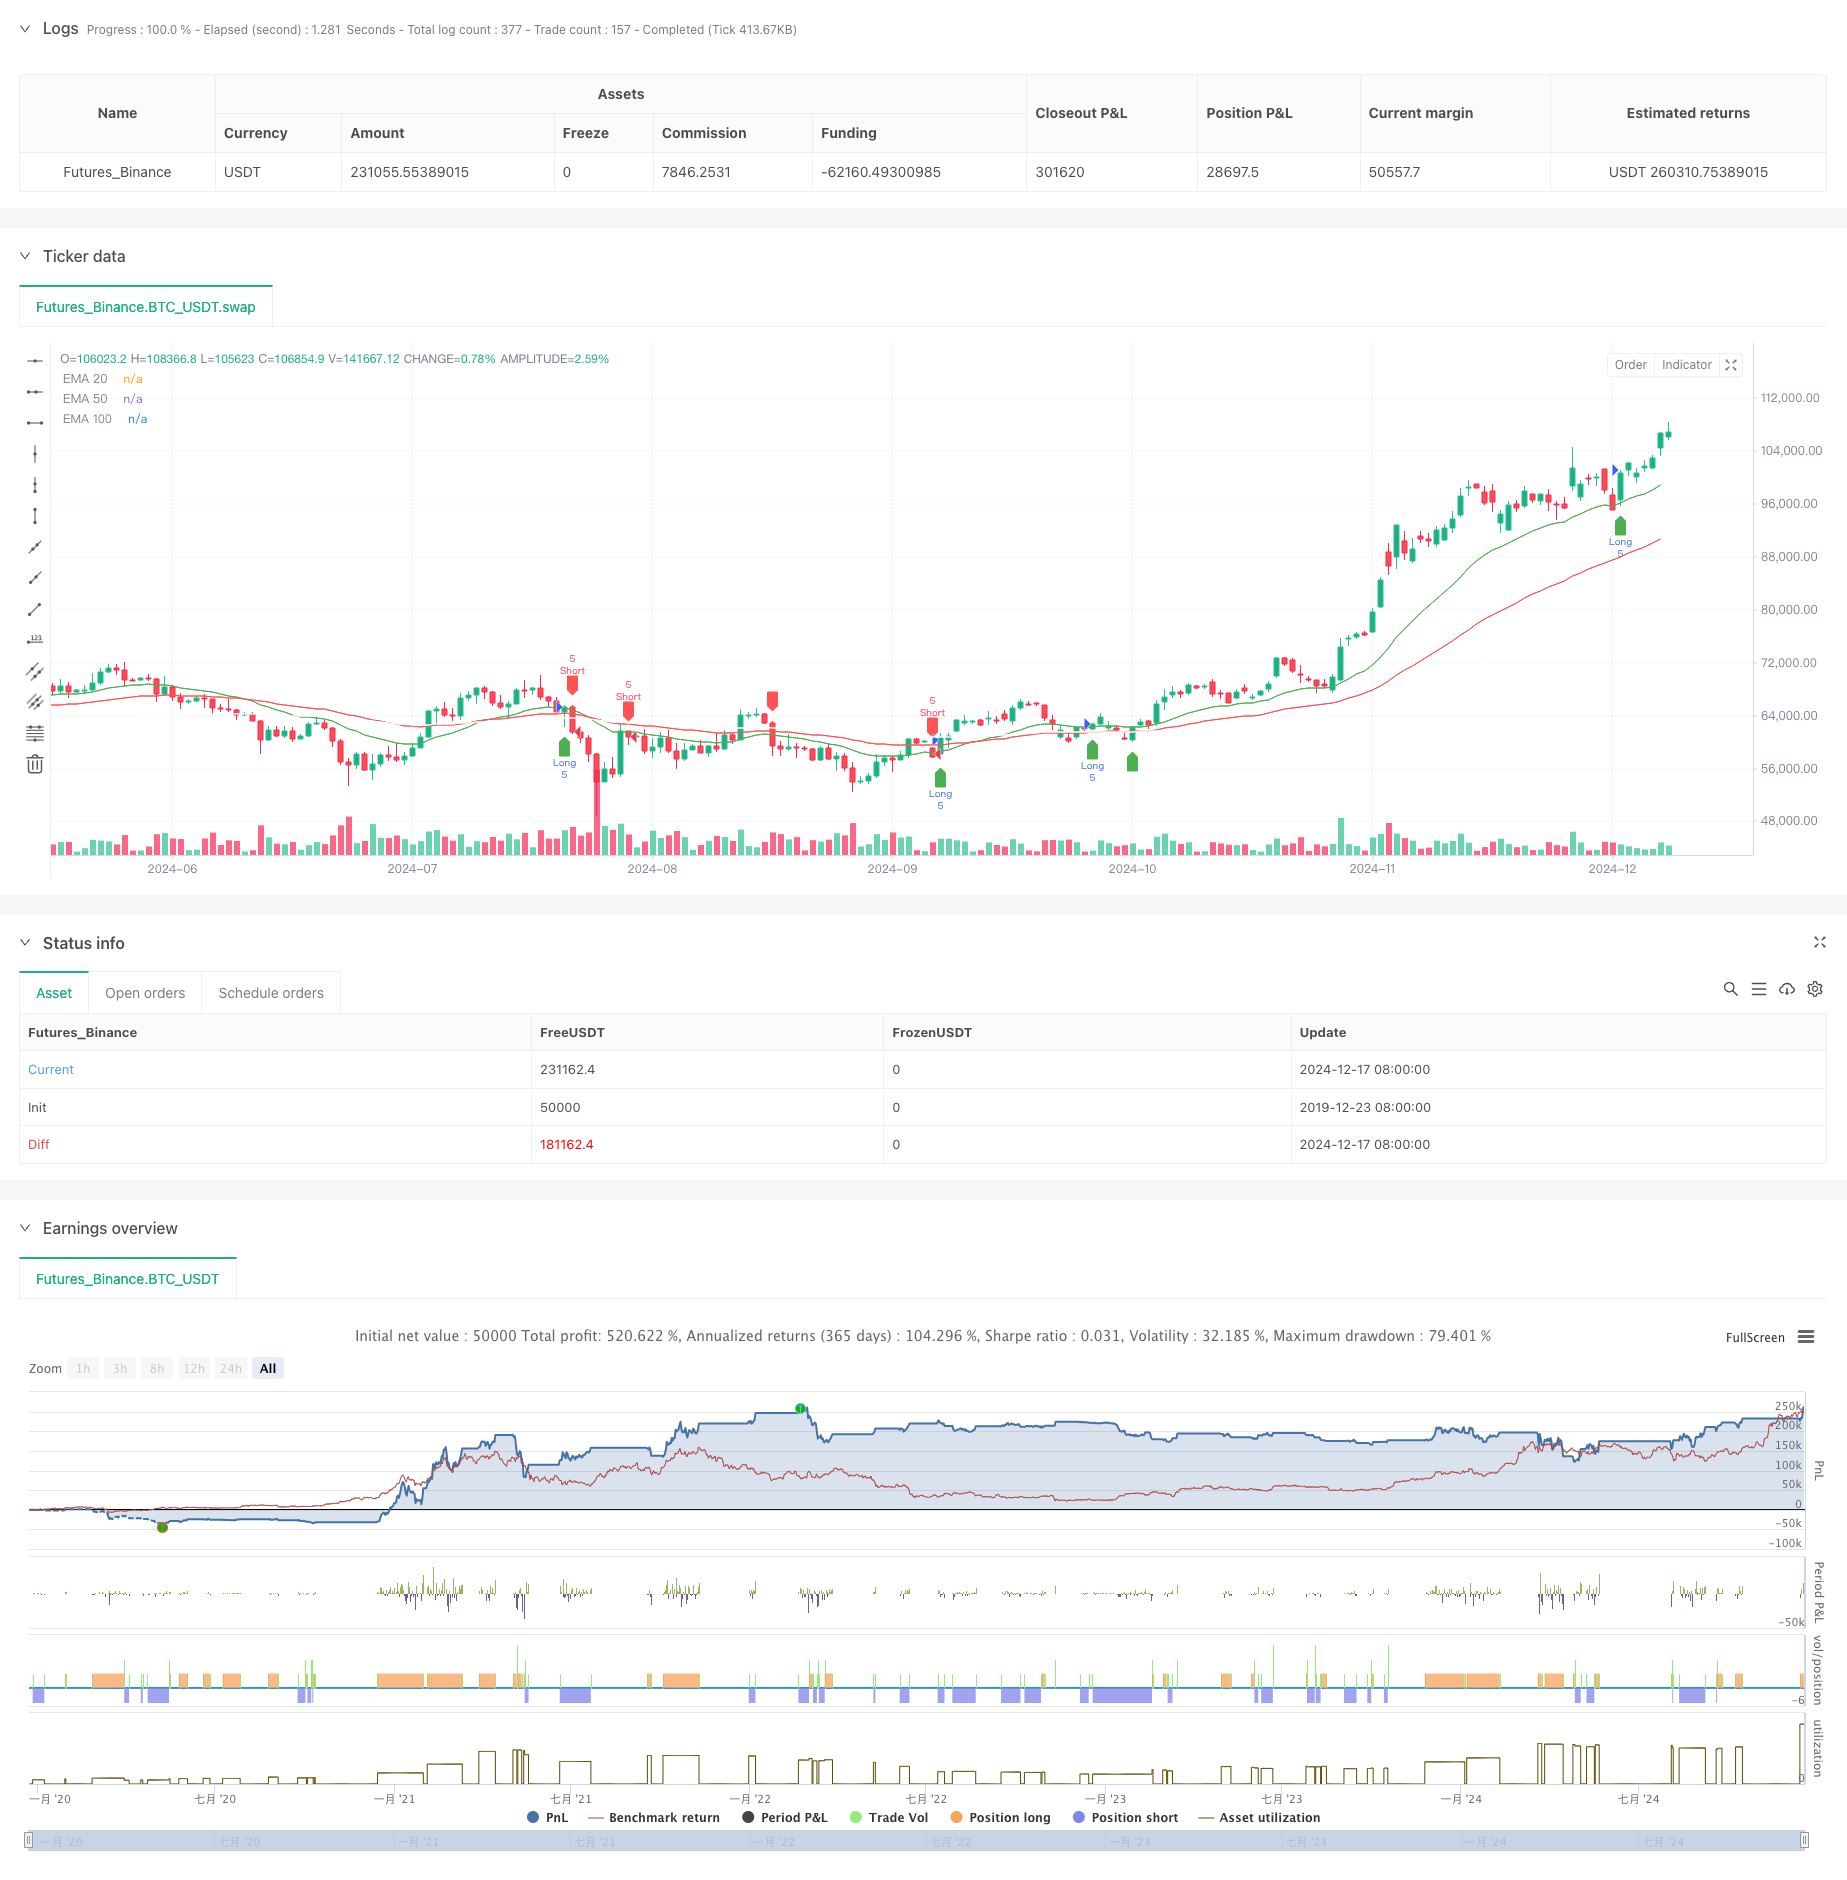
该策略是一个基于多重指数移动平均线(EMA)和真实波动幅度(ATR)的趋势跟踪交易系统。策略通过20周期、50周期和100周期三条EMA的协同配合来捕捉市场趋势,并利用ATR进行动态的风险管理和利润目标设定。这种方法既保证了交易的系统性,又实现了风险的动态控制。
|
|
|
|
#### 策略原理
|
|
策略的核心逻辑建立在价格与多重EMA之间的互动关系上。具体来说:
|
|
1. 入场信号基于价格与20周期EMA的交叉,同时结合50周期EMA作为趋势过滤器
|
|
2. 多头入场条件:价格上穿20周期EMA且位于50周期EMA之上
|
|
3. 空头入场条件:价格下穿20周期EMA且位于50周期EMA之下
|
|
4. 止损设置:基于14周期ATR动态计算,确保止损点位能够适应市场波动
|
|
5. 获利目标:采用1.5倍的风险收益比,即盈利目标为止损距离的1.5倍
|
|
|
|
#### 策略优势
|
|
1. 多重时间周期验证:通过20/50/100三重EMA的配合,有效降低虚假信号
|
|
2. 动态风险管理:基于ATR的止损设置,使风险控制更具市场适应性
|
|
3. 明确的风险收益比:固定1.5倍的风险收益比设置,有利于长期稳定获利
|
|
4. 趋势跟踪与振荡把握相结合:既能把握大趋势,又不错过短期波段机会
|
|
5. 可视化交易信号:策略提供清晰的图形界面,便于交易者理解和执行
|
|
|
|
#### 策略风险
|
|
1. 震荡市场风险:在横盘整理阶段可能产生频繁的假突破信号
|
|
2. 滑点风险:在市场快速波动时,实际成交价格可能与信号价格存在偏差
|
|
3. 趋势反转风险:强趋势突然反转时可能造成较大损失
|
|
4. 参数优化风险:过度优化可能导致策略在实盘中表现不佳
|
|
|
|
#### 策略优化方向
|
|
1. 引入成交量指标:可以通过成交量确认价格突破的有效性
|
|
2. 添加趋势强度过滤:考虑引入ADX等趋势强度指标,提高入场质量
|
|
3. 优化止损方式:可以考虑采用追踪止损,更好地锁定利润
|
|
4. 市场环境分类:根据不同的市场环境调整策略参数
|
|
5. 引入波动率过滤:在过度波动的市场环境下暂停交易
|
|
|
|
#### 总结
|
|
该策略通过多重均线系统和ATR动态风控的结合,构建了一个兼具趋势跟踪和波段操作特点的交易系统。策略的优势在于系统性强、风险可控,但在实际应用中需要注意市场环境的适应性,并根据实际情况进行针对性优化。通过合理的参数设置和严格的风险控制,该策略有望在大多数市场环境下取得稳定的交易效果。
|
|
|
|
||
|
|
|
|
#### Overview
|
|
This strategy is a trend-following trading system based on multiple Exponential Moving Averages (EMAs) and Average True Range (ATR). It uses three EMAs (20, 50, and 100 periods) in conjunction with ATR for dynamic risk management and profit targeting. This approach ensures systematic trading while maintaining dynamic risk control.
|
|
|
|
#### Strategy Principles
|
|
The core logic is built on the interaction between price and multiple EMAs:
|
|
1. Entry signals are based on price crossovers with the 20-period EMA, filtered by the 50-period EMA
|
|
2. Long entry conditions: price crosses above 20 EMA and is above 50 EMA
|
|
3. Short entry conditions: price crosses below 20 EMA and is below 50 EMA
|
|
4. Stop-loss: dynamically calculated using 14-period ATR to adapt to market volatility
|
|
5. Profit target: uses a 1.5 risk-reward ratio, setting profit targets at 1.5 times the stop-loss distance
|
|
|
|
#### Strategy Advantages
|
|
1. Multiple timeframe validation: Uses 20/50/100 EMAs to reduce false signals
|
|
2. Dynamic risk management: ATR-based stops provide market-adaptive risk control
|
|
3. Clear risk-reward ratio: Fixed 1.5 R/R setting promotes long-term profitability
|
|
4. Combines trend-following with swing trading: Captures both major trends and short-term opportunities
|
|
5. Visualized trading signals: Provides clear graphical interface for better understanding and execution
|
|
|
|
#### Strategy Risks
|
|
1. Choppy market risk: May generate frequent false breakout signals during consolidation
|
|
2. Slippage risk: Actual execution prices may differ from signal prices during rapid market movements
|
|
3. Trend reversal risk: Sudden trend reversals may result in significant losses
|
|
4. Parameter optimization risk: Over-optimization may lead to poor real-world performance
|
|
|
|
#### Optimization Directions
|
|
1. Incorporate volume indicators: Use volume to confirm price breakout validity
|
|
2. Add trend strength filters: Consider ADX or similar indicators to improve entry quality
|
|
3. Optimize stop-loss method: Consider implementing trailing stops for better profit protection
|
|
4. Market environment classification: Adjust parameters based on different market conditions
|
|
5. Add volatility filters: Suspend trading during excessive market volatility
|
|
|
|
#### Summary
|
|
This strategy combines multiple EMAs and ATR-based dynamic risk control to create a trading system that features both trend-following and swing trading characteristics. Its strengths lie in systematic approach and controllable risk, but practical application requires attention to market adaptability and specific optimizations based on actual conditions. Through proper parameter settings and strict risk control, the strategy has the potential to achieve stable trading results across most market environments.[/trans]
|
|
|
|
|
|
|
|
> Source (PineScript)
|
|
|
|
``` pinescript
|
|
/*backtest
|
|
start: 2019-12-23 08:00:00
|
|
end: 2024-12-18 08:00:00
|
|
period: 1d
|
|
basePeriod: 1d
|
|
exchanges: [{"eid":"Futures_Binance","currency":"BTC_USDT"}]
|
|
*/
|
|
|
|
//@version=6
|
|
strategy("EMA Swing Strategy with ATR", overlay=true)
|
|
|
|
// Inputs
|
|
emaShort = input.int(20, "Short EMA")
|
|
emaMid = input.int(50, "Mid EMA")
|
|
emaLong = input.int(100, "Long EMA")
|
|
rrRatio = input.float(1.5, "Risk-Reward Ratio")
|
|
contracts = input.int(5, "Number of Contracts")
|
|
|
|
// Calculations
|
|
ema20 = ta.ema(close, emaShort)
|
|
ema50 = ta.ema(close, emaMid)
|
|
ema100 = ta.ema(close, emaLong)
|
|
|
|
atr = ta.atr(14)
|
|
|
|
// Conditions
|
|
longCondition = ta.crossover(close, ema20) and close > ema50
|
|
shortCondition = ta.crossunder(close, ema20) and close < ema50
|
|
|
|
// Variables for trades
|
|
var float entryPrice = na
|
|
var float stopLoss = na
|
|
var float takeProfit = na
|
|
|
|
// Long Trades
|
|
if (longCondition)
|
|
entryPrice := close
|
|
stopLoss := close - atr
|
|
takeProfit := close + atr * rrRatio
|
|
strategy.entry("Long", strategy.long, contracts)
|
|
strategy.exit("Exit Long", from_entry="Long", stop=stopLoss, limit=takeProfit)
|
|
|
|
// Short Trades
|
|
if (shortCondition)
|
|
entryPrice := close
|
|
stopLoss := close + atr
|
|
takeProfit := close - atr * rrRatio
|
|
strategy.entry("Short", strategy.short, contracts)
|
|
strategy.exit("Exit Short", from_entry="Short", stop=stopLoss, limit=takeProfit)
|
|
|
|
// Plot EMAs
|
|
plot(ema20, color=color.green, title="EMA 20")
|
|
plot(ema50, color=color.red, title="EMA 50")
|
|
plot(ema100, color=color.white, title="EMA 100")
|
|
|
|
// Visualization for Entries
|
|
plotshape(series=longCondition, style=shape.labelup, color=color.green, location=location.belowbar, title="Long Entry")
|
|
plotshape(series=shortCondition, style=shape.labeldown, color=color.red, location=location.abovebar, title="Short Entry")
|
|
```
|
|
|
|
> Detail
|
|
|
|
https://www.fmz.com/strategy/475637
|
|
|
|
> Last Modified
|
|
|
|
2024-12-20 17:06:20
|