
206 lines
7.5 KiB
Markdown
206 lines
7.5 KiB
Markdown
|
|
> Name
|
|
|
|
多重均线交叉趋势跟踪策略-Multi-Moving-Average-Crossover-Trend-Following-Strategy
|
|
|
|
> Author
|
|
|
|
ChaoZhang
|
|
|
|
> Strategy Description
|
|
|
|
|
|
|
|
[trans]
|
|
#### 概述
|
|
|
|
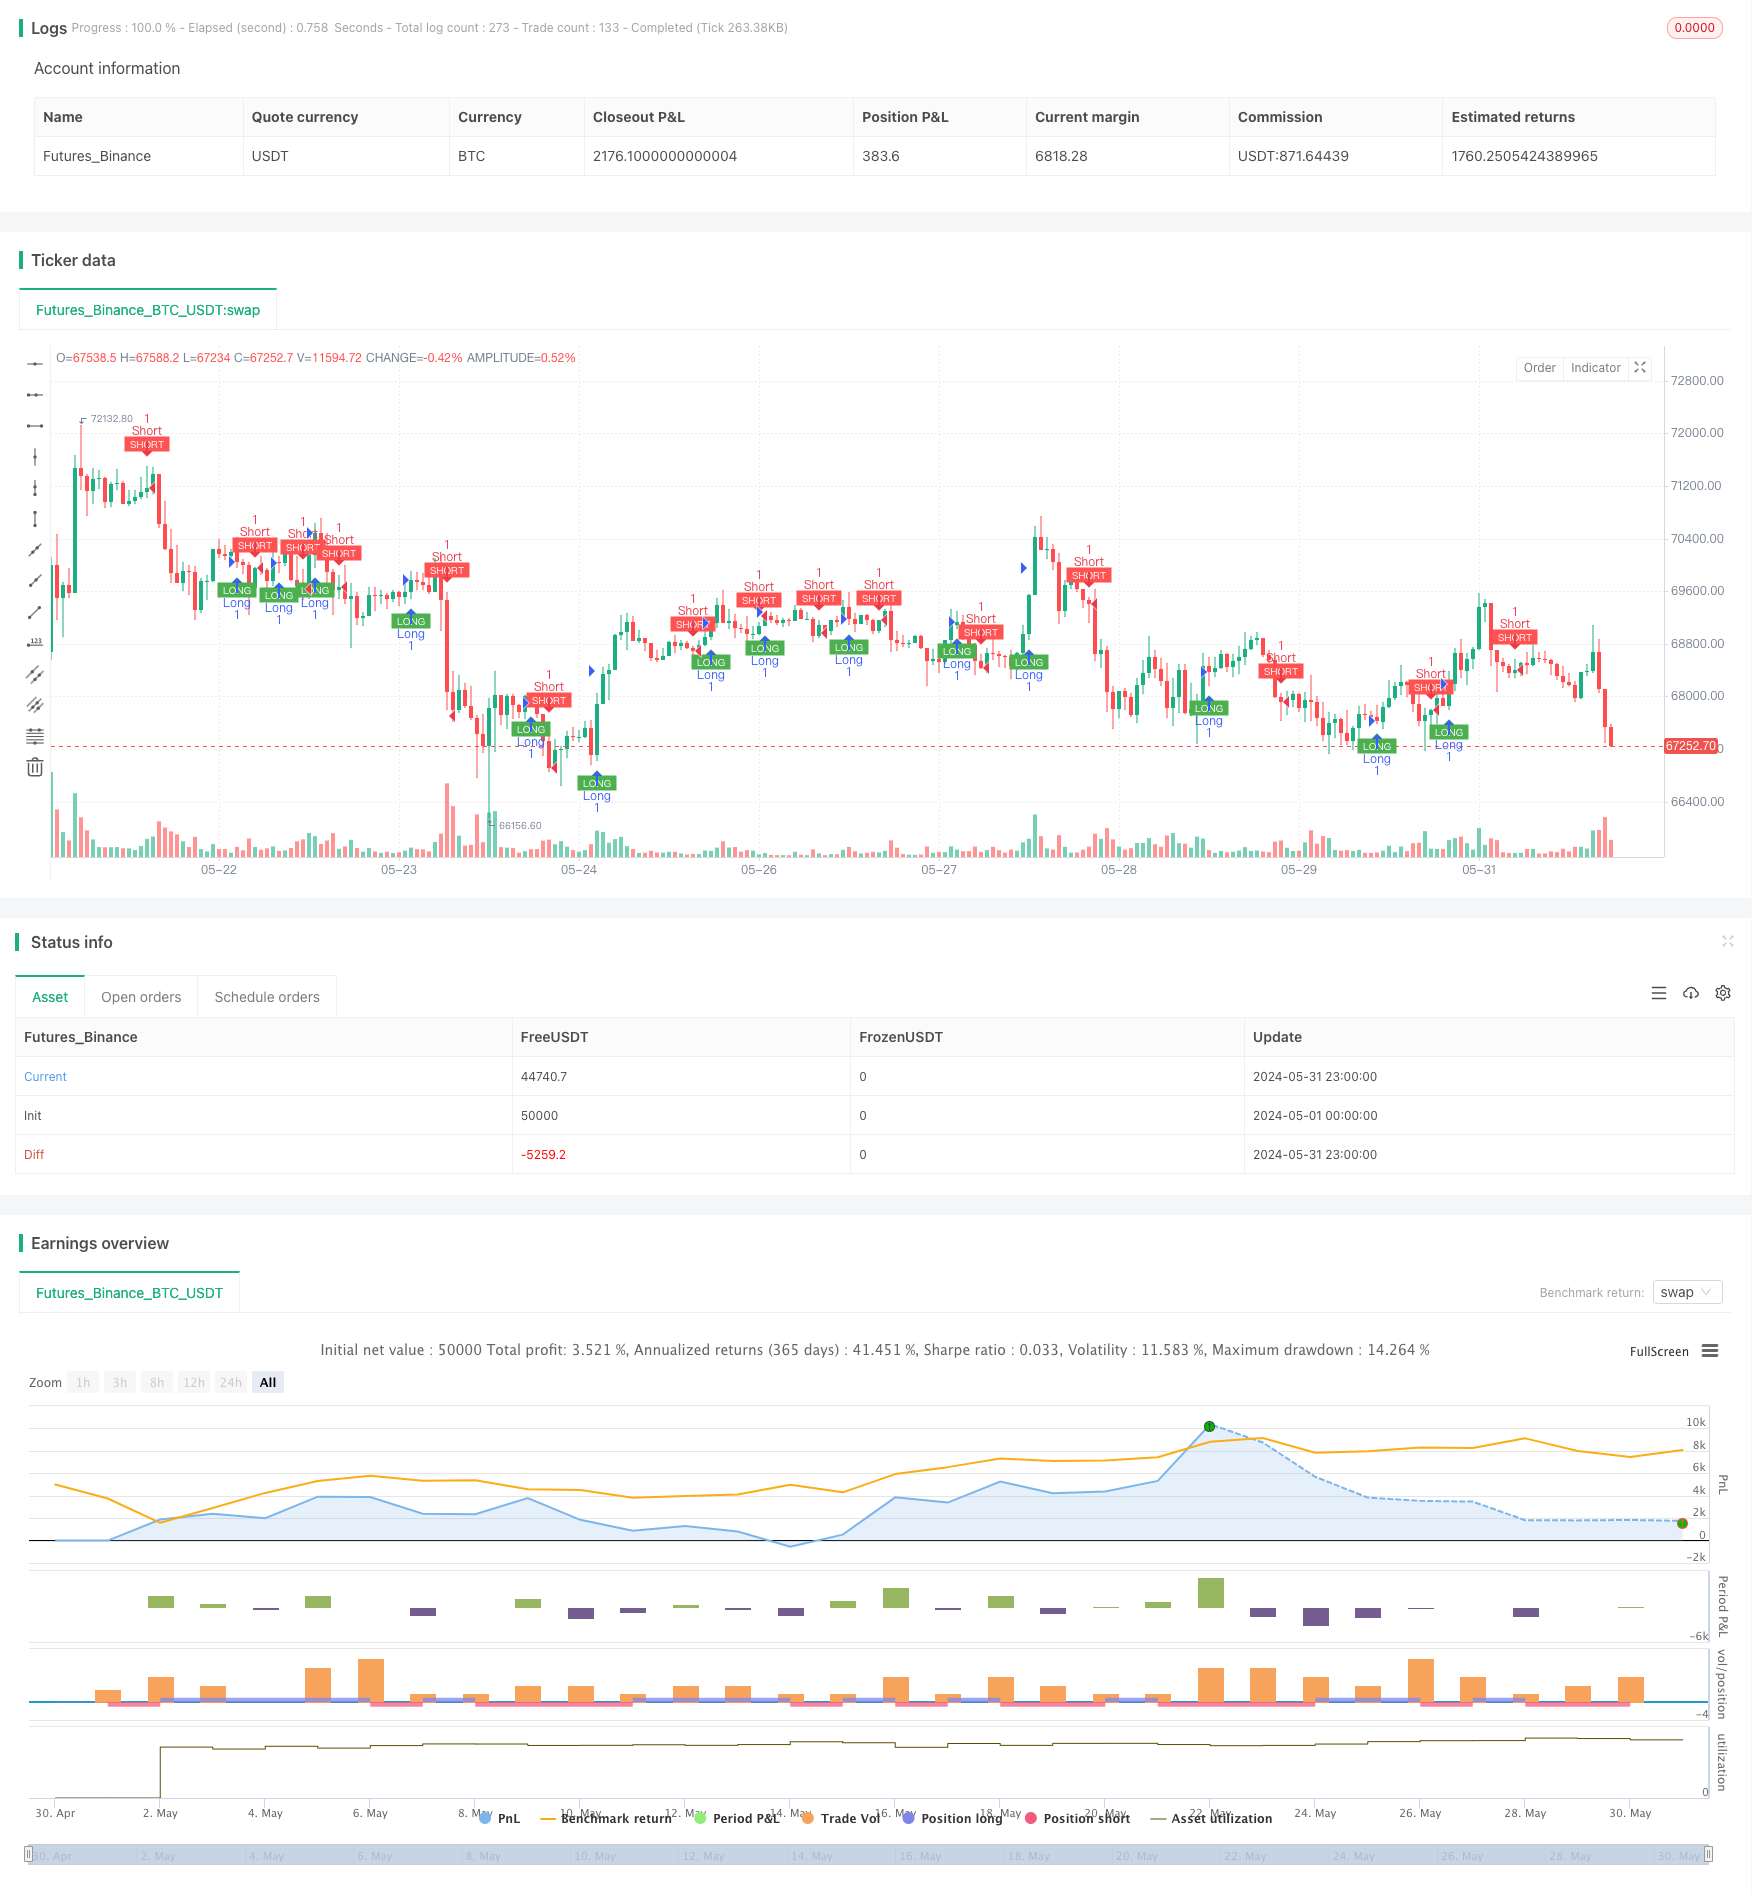
本策略是一个基于Tillson T3指标的趋势跟踪交易系统。它利用多重指数移动平均线(EMA)的交叉来生成买卖信号,并在TradingView平台上进行回测。该策略的核心思想是通过Tillson T3指标捕捉市场趋势,在上升趋势中开多仓,下降趋势中开空仓,以实现盈利。
|
|
|
|
#### 策略原理
|
|
|
|
1. Tillson T3指标计算:
|
|
- 首先计算(高+低+2*收盘)/4的EMA
|
|
- 然后连续计算5次EMA,得到e1到e6
|
|
- 最后根据特定系数计算T3值
|
|
|
|
2. 信号生成:
|
|
- 多头信号:当T3值上穿其前一个值时
|
|
- 空头信号:当T3值下穿其前一个值时
|
|
|
|
3. 交易执行:
|
|
- 出现多头信号时,开多仓
|
|
- 出现空头信号时,开空仓
|
|
|
|
4. 可视化:
|
|
- 多头信号:图表下方绿色向上箭头
|
|
- 空头信号:图表上方红色向下箭头
|
|
|
|
#### 策略优势
|
|
|
|
1. 趋势跟踪:Tillson T3指标能有效捕捉市场趋势,减少假突破。
|
|
|
|
2. 灵活性:通过调整长度和成交量因子,可适应不同市场环境。
|
|
|
|
3. 视觉反馈:清晰的图形信号有助于交易决策。
|
|
|
|
4. 自动化:可在TradingView平台上实现自动交易。
|
|
|
|
5. 风险管理:使用资金百分比进行头寸管理。
|
|
|
|
#### 策略风险
|
|
|
|
1. 趋势反转:在震荡市场可能产生频繁假信号。
|
|
|
|
2. 滞后性:作为滞后指标,可能错过趋势初期机会。
|
|
|
|
3. 过度交易:频繁信号可能导致过度交易,增加成本。
|
|
|
|
4. 参数敏感:性能高度依赖于参数设置。
|
|
|
|
5. 单一指标:仅依赖Tillson T3可能忽视其他重要市场信息。
|
|
|
|
#### 策略优化方向
|
|
|
|
1. 多指标结合:引入RSI、MACD等指标进行信号确认。
|
|
|
|
2. 止损优化:加入动态止损,如跟踪止损,提高风险管理能力。
|
|
|
|
3. 时间框架分析:结合多个时间框架分析,提高信号可靠性。
|
|
|
|
4. 波动率调整:根据市场波动调整仓位大小,优化风险收益比。
|
|
|
|
5. 市场状态识别:加入市场状态判断逻辑,在不同市场环境下采用不同策略。
|
|
|
|
#### 总结
|
|
|
|
多重均线交叉趋势跟踪策略是一个基于Tillson T3指标的自动化交易系统。它通过捕捉市场趋势来生成交易信号,具有趋势跟踪能力强、操作简单明确的优势。然而,该策略也面临着震荡市场假信号频繁、信号滞后等风险。通过多指标结合、优化止损策略、引入多时间框架分析等方式,可以进一步提升策略的稳定性和盈利能力。总的来说,这是一个具有良好基础的策略框架,通过持续优化和实盘测试,有望成为一个可靠的自动化交易系统。
|
|
|
|
||
|
|
|
|
#### Overview
|
|
|
|
This strategy is a trend-following trading system based on the Tillson T3 indicator. It uses multiple exponential moving average (EMA) crossovers to generate buy and sell signals, and is backtested on the TradingView platform. The core idea of the strategy is to capture market trends through the Tillson T3 indicator, opening long positions in uptrends and short positions in downtrends to achieve profits.
|
|
|
|
#### Strategy Principles
|
|
|
|
1. Tillson T3 Indicator Calculation:
|
|
- First, calculate the EMA of (High + Low + 2 * Close) / 4
|
|
- Then calculate EMA 5 consecutive times to get e1 to e6
|
|
- Finally, calculate T3 value based on specific coefficients
|
|
|
|
2. Signal Generation:
|
|
- Long signal: When T3 value crosses above its previous value
|
|
- Short signal: When T3 value crosses below its previous value
|
|
|
|
3. Trade Execution:
|
|
- Open a long position when a long signal appears
|
|
- Open a short position when a short signal appears
|
|
|
|
4. Visualization:
|
|
- Long signal: Green up arrow below the chart
|
|
- Short signal: Red down arrow above the chart
|
|
|
|
#### Strategy Advantages
|
|
|
|
1. Trend Following: The Tillson T3 indicator effectively captures market trends, reducing false breakouts.
|
|
|
|
2. Flexibility: Can adapt to different market environments by adjusting length and volume factor.
|
|
|
|
3. Visual Feedback: Clear graphical signals aid in trading decisions.
|
|
|
|
4. Automation: Can be implemented for automated trading on the TradingView platform.
|
|
|
|
5. Risk Management: Uses percentage of equity for position sizing.
|
|
|
|
#### Strategy Risks
|
|
|
|
1. Trend Reversal: May produce frequent false signals in choppy markets.
|
|
|
|
2. Lag: As a lagging indicator, may miss opportunities at the beginning of trends.
|
|
|
|
3. Overtrading: Frequent signals may lead to overtrading, increasing costs.
|
|
|
|
4. Parameter Sensitivity: Performance highly depends on parameter settings.
|
|
|
|
5. Single Indicator: Relying solely on Tillson T3 may overlook other important market information.
|
|
|
|
#### Strategy Optimization Directions
|
|
|
|
1. Multi-Indicator Combination: Introduce indicators like RSI, MACD for signal confirmation.
|
|
|
|
2. Stop Loss Optimization: Add dynamic stop loss, such as trailing stops, to improve risk management.
|
|
|
|
3. Timeframe Analysis: Combine multiple timeframe analysis to improve signal reliability.
|
|
|
|
4. Volatility Adjustment: Adjust position size based on market volatility to optimize risk-reward ratio.
|
|
|
|
5. Market State Recognition: Add market state judgment logic to adopt different strategies in different market environments.
|
|
|
|
#### Conclusion
|
|
|
|
The Multi-Moving Average Crossover Trend Following Strategy is an automated trading system based on the Tillson T3 indicator. It generates trading signals by capturing market trends, with strong trend-following capabilities and clear operational simplicity as its advantages. However, the strategy also faces risks such as frequent false signals in choppy markets and signal lag. By combining multiple indicators, optimizing stop-loss strategies, introducing multi-timeframe analysis, and other methods, the stability and profitability of the strategy can be further improved. Overall, this is a strategy framework with a good foundation, which through continuous optimization and live testing, has the potential to become a reliable automated trading system.
|
|
|
|
[/trans]
|
|
|
|
|
|
|
|
> Source (PineScript)
|
|
|
|
``` pinescript
|
|
/*backtest
|
|
start: 2024-05-01 00:00:00
|
|
end: 2024-05-31 23:59:59
|
|
period: 1h
|
|
basePeriod: 15m
|
|
exchanges: [{"eid":"Futures_Binance","currency":"BTC_USDT"}]
|
|
*/
|
|
|
|
//@version=4
|
|
strategy("Hashtag Signals and Backtest", overlay=true)
|
|
|
|
// Input parameters for indicators
|
|
length1 = input(8, "T3 Length")
|
|
a1 = input(0.7, "Volume Factor")
|
|
|
|
// Tillson T3 Calculation
|
|
e1 = ema((high + low + 2 * close) / 4, length1)
|
|
e2 = ema(e1, length1)
|
|
e3 = ema(e2, length1)
|
|
e4 = ema(e3, length1)
|
|
e5 = ema(e4, length1)
|
|
e6 = ema(e5, length1)
|
|
c1 = -a1 * a1 * a1
|
|
c2 = 3 * a1 * a1 + 3 * a1 * a1 * a1
|
|
c3 = -6 * a1 * a1 - 3 * a1 - 3 * a1 * a1 * a1
|
|
c4 = 1 + 3 * a1 + a1 * a1 * a1 + 3 * a1 * a1
|
|
T3 = c1 * e6 + c2 * e5 + c3 * e4 + c4 * e3
|
|
|
|
// Signal conditions
|
|
longSignal = crossover(T3, T3[1])
|
|
shortSignal = crossunder(T3, T3[1])
|
|
|
|
// Plotting signals
|
|
plotshape(series=longSignal, title="Long Signal", location=location.belowbar, color=color.green, style=shape.labelup, text="LONG", textcolor=color.white, size=size.tiny)
|
|
plotshape(series=shortSignal, title="Short Signal", location=location.abovebar, color=color.red, style=shape.labeldown, text="SHORT", textcolor=color.white, size=size.tiny)
|
|
|
|
// Strategy Entries for Backtest
|
|
if (longSignal)
|
|
strategy.entry("Long", strategy.long)
|
|
|
|
if (shortSignal)
|
|
strategy.entry("Short", strategy.short)
|
|
|
|
// Alerts
|
|
alertcondition(longSignal, title="BUY", message="BUY!")
|
|
alertcondition(shortSignal, title="SELL", message="SELL!")
|
|
|
|
```
|
|
|
|
> Detail
|
|
|
|
https://www.fmz.com/strategy/455359
|
|
|
|
> Last Modified
|
|
|
|
2024-06-28 15:10:58
|