
274 lines
13 KiB
Markdown
274 lines
13 KiB
Markdown
|
|
> Name
|
|
|
|
多重动量线性回归交叉策略-Multi-Momentum-Linear-Regression-Crossover-Strategy
|
|
|
|
> Author
|
|
|
|
ChaoZhang
|
|
|
|
> Strategy Description
|
|
|
|
|
|
|
|
[trans]
|
|
#### 概述
|
|
|
|
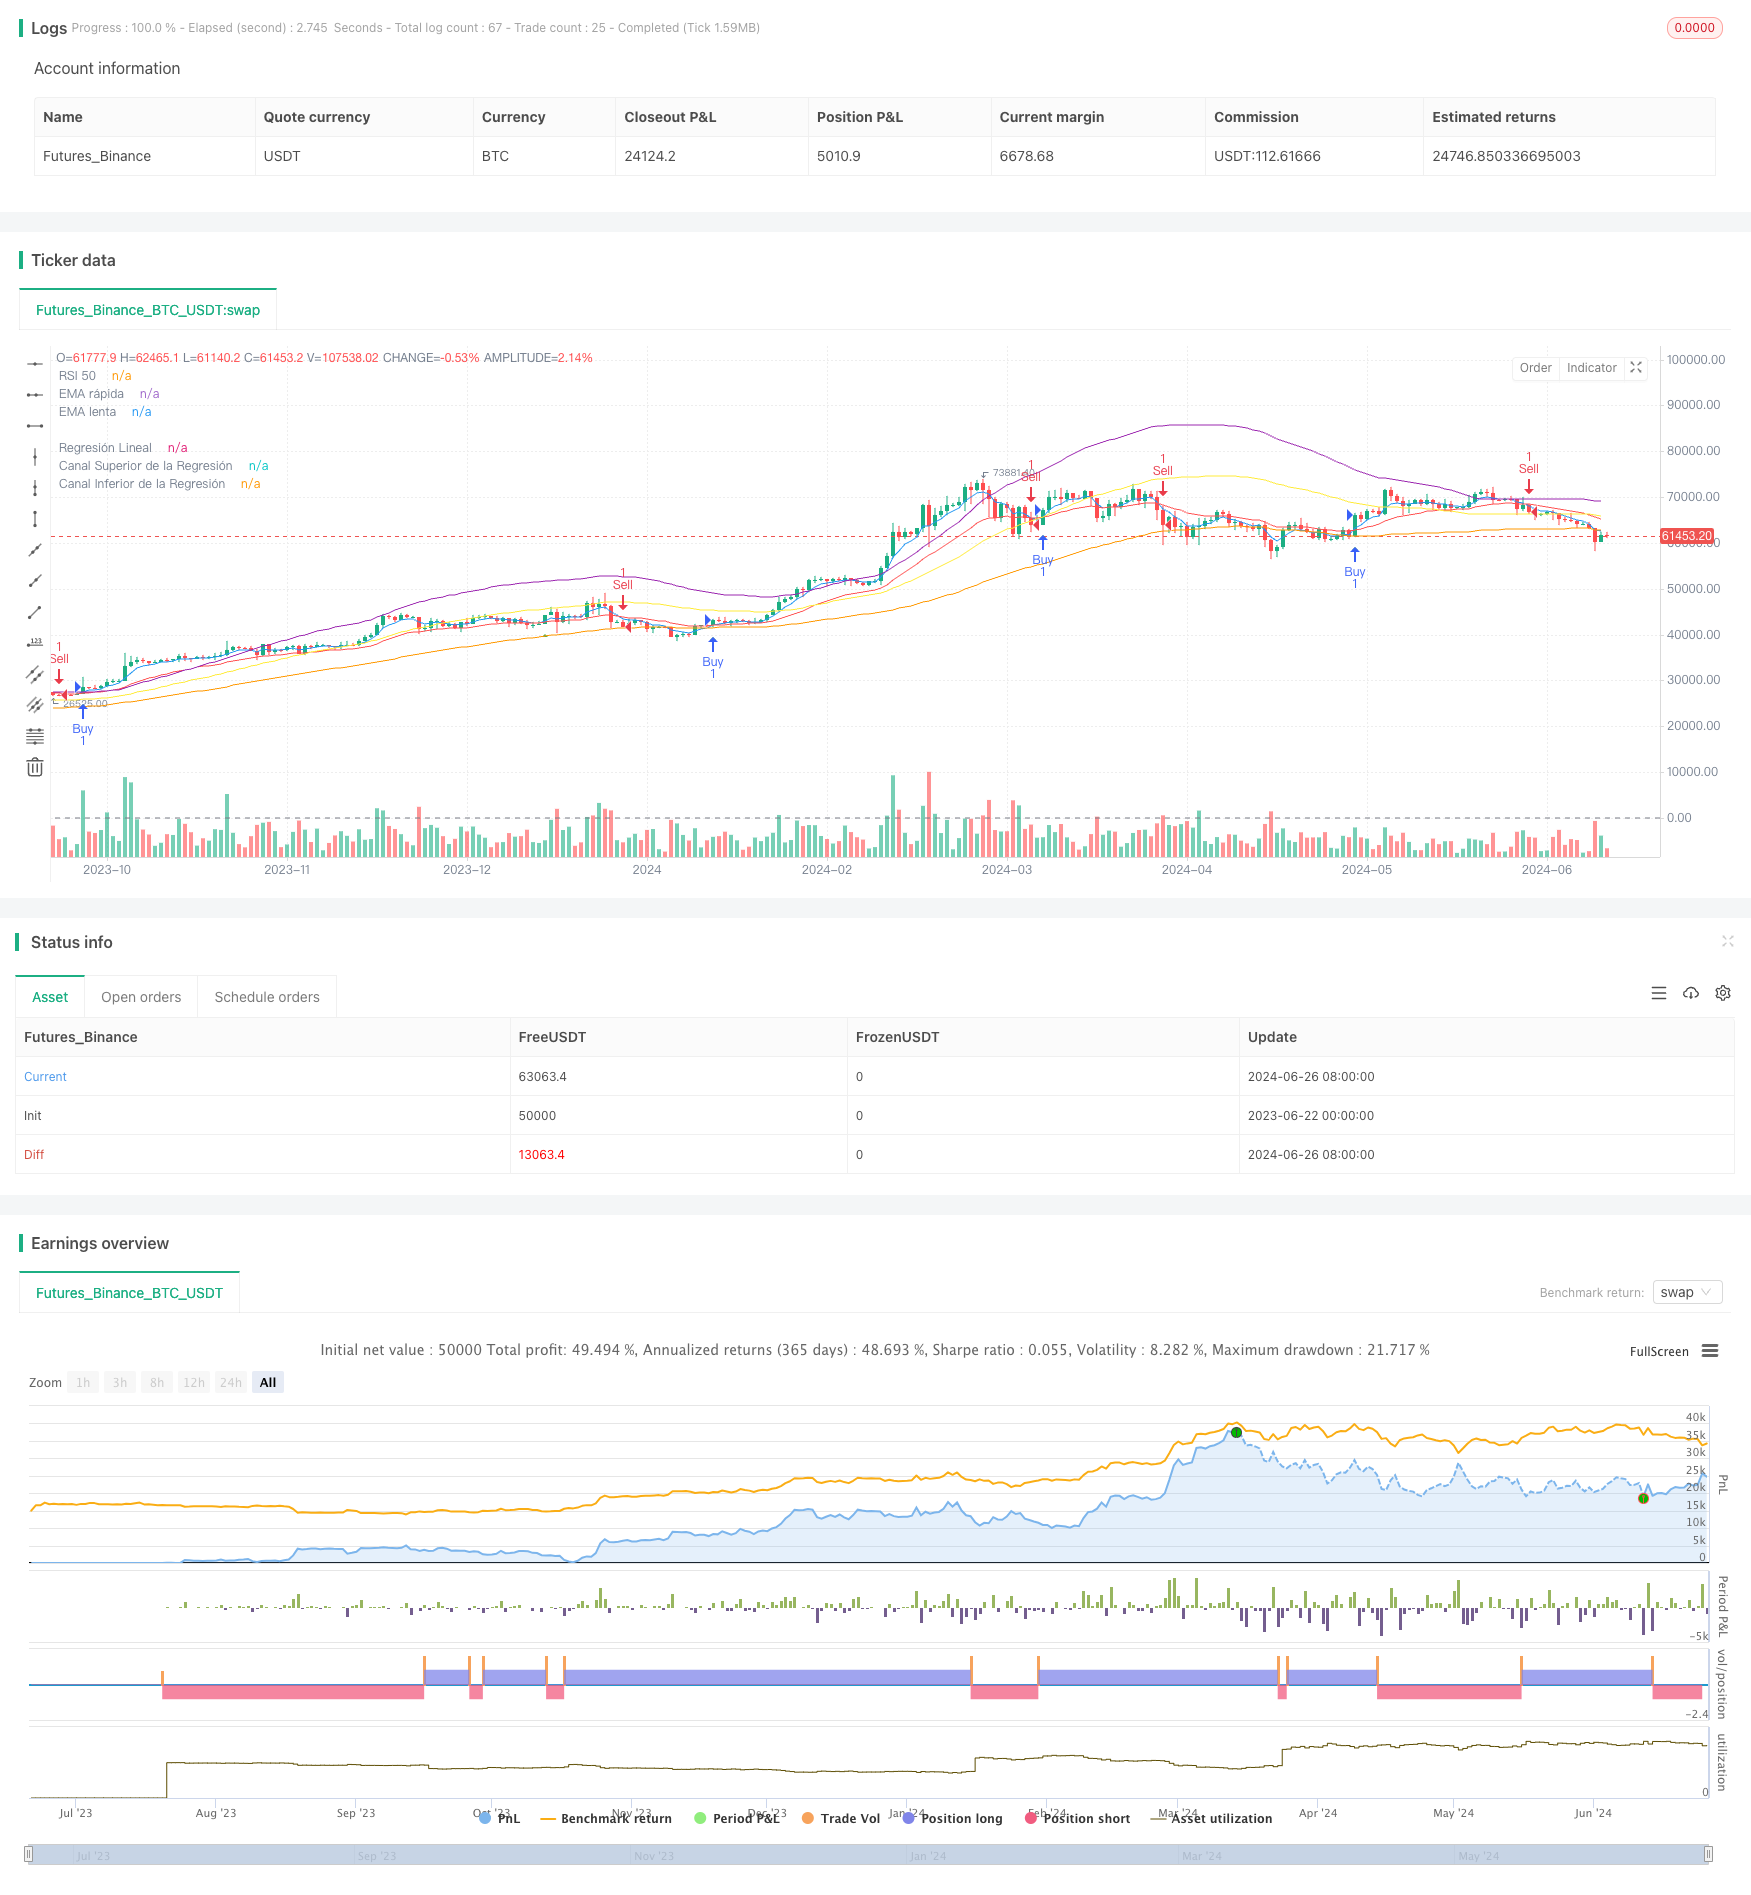
多重动量线性回归交叉策略是一种结合了动量指标、移动平均线和线性回归的量化交易策略。该策略利用快速和慢速指数移动平均线(EMA)的交叉、相对强弱指数(RSI)的超买超卖水平以及线性回归通道来识别潜在的交易机会。通过整合多个技术指标,该策略旨在捕捉市场趋势的变化并在趋势反转时发出交易信号。
|
|
|
|
#### 策略原理
|
|
|
|
1. 动量指标:
|
|
- 使用14周期RSI作为动量指标。RSI大于50被视为上涨动量,小于50则视为下跌动量。
|
|
- 采用5周期EMA作为快速移动平均线,20周期EMA作为慢速移动平均线。
|
|
|
|
2. 线性回归:
|
|
- 计算100周期的线性回归线及其标准差。
|
|
- 构建上下回归通道,分别为线性回归线加减一个标准差。
|
|
|
|
3. 入场条件:
|
|
- 多头入场:快速EMA上穿慢速EMA且RSI大于50。
|
|
- 空头入场:快速EMA下穿慢速EMA且RSI小于50。
|
|
|
|
4. 可视化:
|
|
- 在图表上绘制线性回归线及其上下通道。
|
|
- 标记EMA交叉点和入场信号。
|
|
|
|
5. 交易执行:
|
|
- 满足入场条件时,策略自动执行买入或卖出操作。
|
|
|
|
6. 风险管理:
|
|
- 虽然代码中未明确设置止损和止盈,但可以通过调整参数或添加额外的退出条件来实现风险管理。
|
|
|
|
#### 策略优势
|
|
|
|
1. 多指标融合:结合RSI、EMA和线性回归,提供更全面的市场分析视角。
|
|
|
|
2. 趋势跟踪与反转:能够捕捉趋势的延续和潜在的反转点。
|
|
|
|
3. 视觉直观:通过图表可视化各项指标,便于交易者快速判断市场状况。
|
|
|
|
4. 自动化交易:设置了自动执行交易的功能,减少人为干预。
|
|
|
|
5. 灵活性:参数可调整,适应不同市场环境和交易风格。
|
|
|
|
6. 动态适应:线性回归通道能够动态适应价格变化,提供更准确的支撑和阻力水平。
|
|
|
|
7. 多维度确认:入场信号需要同时满足EMA交叉和RSI条件,降低虚假信号的可能性。
|
|
|
|
#### 策略风险
|
|
|
|
1. 滞后性:移动平均线和RSI都是滞后指标,可能导致入场时机略有延迟。
|
|
|
|
2. 振荡市场:在横盘市场中,频繁的EMA交叉可能导致过多的交易信号和假突破。
|
|
|
|
3. 过度依赖技术指标:忽视基本面因素可能导致在重大新闻或事件面前表现不佳。
|
|
|
|
4. 参数敏感性:策略性能可能对参数设置高度敏感,需要频繁优化。
|
|
|
|
5. 缺乏止损机制:当前策略未设置明确的止损条件,可能面临较大的下行风险。
|
|
|
|
6. 市场条件变化:在剧烈波动或趋势突变的市场中,策略可能反应不及时。
|
|
|
|
7. 过度交易:频繁的交叉信号可能导致过度交易,增加交易成本。
|
|
|
|
#### 策略优化方向
|
|
|
|
1. 引入止损和止盈:设置基于ATR或固定百分比的止损和止盈条件,控制风险和锁定利润。
|
|
|
|
2. 增加过滤器:添加趋势强度指标(如ADX)或成交量确认,减少假信号。
|
|
|
|
3. 动态参数调整:根据市场波动性自动调整EMA和RSI的周期,提高策略适应性。
|
|
|
|
4. 多时间框架分析:结合更长期的趋势判断,只在主趋势方向上开仓。
|
|
|
|
5. 加入波动率考量:在高波动期间调整仓位大小或暂停交易,控制风险。
|
|
|
|
6. 优化入场时机:考虑在线性回归通道边缘附近入场,potentially提高胜率。
|
|
|
|
7. 引入机器学习:使用机器学习算法动态优化参数或预测趋势变化。
|
|
|
|
8. 加入基本面分析:整合经济日历或新闻分析,在重要事件前调整策略。
|
|
|
|
9. 实现部分仓位管理:允许分批进出场,优化资金管理。
|
|
|
|
10. 回测与优化:进行广泛的历史回测,找出最优参数组合和适用的市场条件。
|
|
|
|
#### 总结
|
|
|
|
多重动量线性回归交叉策略是一个综合性的技术分析交易系统,通过结合RSI、EMA和线性回归等多个指标,旨在捕捉市场趋势的变化并在适当时机进行交易。该策略的主要优势在于其多维度的市场分析方法和自动化交易能力,但也面临着滞后性和参数敏感性等挑战。
|
|
|
|
为了进一步提升策略的可靠性和盈利能力,建议引入止损止盈机制、增加过滤器以减少假信号、实现动态参数调整以适应不同市场环境,并考虑整合多时间框架分析和波动率管理。此外,利用机器学习技术优化参数选择,以及加入基本面分析元素,都有助于增强策略的整体表现。
|
|
|
|
通过不断的回测、优化和实盘验证,该策略有潜力成为一个稳健的量化交易工具。然而,交易者在使用此策略时仍需谨慎,密切关注市场变化,并根据个人风险承受能力和投资目标进行适当的资金管理。
|
|
|
|
||
|
|
|
|
#### Overview
|
|
|
|
The Multi-Momentum Linear Regression Crossover Strategy is a quantitative trading approach that combines momentum indicators, moving averages, and linear regression. This strategy utilizes the crossover of fast and slow Exponential Moving Averages (EMAs), overbought and oversold levels of the Relative Strength Index (RSI), and linear regression channels to identify potential trading opportunities. By integrating multiple technical indicators, the strategy aims to capture market trend changes and generate trading signals at trend reversals.
|
|
|
|
#### Strategy Principles
|
|
|
|
1. Momentum Indicators:
|
|
- Uses 14-period RSI as a momentum indicator. RSI above 50 is considered bullish momentum, below 50 is bearish.
|
|
- Employs a 5-period EMA as the fast moving average and a 20-period EMA as the slow moving average.
|
|
|
|
2. Linear Regression:
|
|
- Calculates a 100-period linear regression line and its standard deviation.
|
|
- Constructs upper and lower regression channels by adding and subtracting one standard deviation from the linear regression line.
|
|
|
|
3. Entry Conditions:
|
|
- Long entry: Fast EMA crosses above slow EMA and RSI is above 50.
|
|
- Short entry: Fast EMA crosses below slow EMA and RSI is below 50.
|
|
|
|
4. Visualization:
|
|
- Plots the linear regression line and its upper and lower channels on the chart.
|
|
- Marks EMA crossover points and entry signals.
|
|
|
|
5. Trade Execution:
|
|
- Automatically executes buy or sell operations when entry conditions are met.
|
|
|
|
6. Risk Management:
|
|
- While not explicitly set in the code, risk management can be implemented by adjusting parameters or adding additional exit conditions.
|
|
|
|
#### Strategy Advantages
|
|
|
|
1. Multi-indicator Integration: Combines RSI, EMA, and linear regression for a more comprehensive market analysis perspective.
|
|
|
|
2. Trend Following and Reversal: Capable of capturing trend continuations and potential reversal points.
|
|
|
|
3. Visual Intuitiveness: Visualizes various indicators on the chart, allowing traders to quickly assess market conditions.
|
|
|
|
4. Automated Trading: Features automatic trade execution functionality, reducing human intervention.
|
|
|
|
5. Flexibility: Parameters can be adjusted to adapt to different market environments and trading styles.
|
|
|
|
6. Dynamic Adaptation: Linear regression channels dynamically adapt to price changes, providing more accurate support and resistance levels.
|
|
|
|
7. Multi-dimensional Confirmation: Entry signals require simultaneous satisfaction of EMA crossover and RSI conditions, reducing the likelihood of false signals.
|
|
|
|
#### Strategy Risks
|
|
|
|
1. Lagging Nature: Moving averages and RSI are lagging indicators, potentially leading to slightly delayed entry timing.
|
|
|
|
2. Oscillating Markets: In range-bound markets, frequent EMA crossovers may result in excessive trading signals and false breakouts.
|
|
|
|
3. Over-reliance on Technical Indicators: Neglecting fundamental factors may lead to poor performance in the face of significant news or events.
|
|
|
|
4. Parameter Sensitivity: Strategy performance may be highly sensitive to parameter settings, requiring frequent optimization.
|
|
|
|
5. Lack of Stop-Loss Mechanism: The current strategy does not set explicit stop-loss conditions, potentially exposing to significant downside risk.
|
|
|
|
6. Changing Market Conditions: The strategy may not react timely in markets with severe volatility or sudden trend changes.
|
|
|
|
7. Overtrading: Frequent crossover signals may lead to excessive trading, increasing transaction costs.
|
|
|
|
#### Strategy Optimization Directions
|
|
|
|
1. Introduce Stop-Loss and Take-Profit: Set stop-loss and take-profit conditions based on ATR or fixed percentages to control risk and lock in profits.
|
|
|
|
2. Add Filters: Incorporate trend strength indicators (such as ADX) or volume confirmation to reduce false signals.
|
|
|
|
3. Dynamic Parameter Adjustment: Automatically adjust EMA and RSI periods based on market volatility to improve strategy adaptability.
|
|
|
|
4. Multi-Timeframe Analysis: Combine longer-term trend judgments, only opening positions in the direction of the main trend.
|
|
|
|
5. Incorporate Volatility Considerations: Adjust position sizes or pause trading during high volatility periods to control risk.
|
|
|
|
6. Optimize Entry Timing: Consider entering near the edges of linear regression channels to potentially improve win rates.
|
|
|
|
7. Introduce Machine Learning: Use machine learning algorithms to dynamically optimize parameters or predict trend changes.
|
|
|
|
8. Incorporate Fundamental Analysis: Integrate economic calendars or news analysis to adjust the strategy before important events.
|
|
|
|
9. Implement Partial Position Management: Allow for partial entries and exits to optimize capital management.
|
|
|
|
10. Backtesting and Optimization: Conduct extensive historical backtests to find optimal parameter combinations and suitable market conditions.
|
|
|
|
#### Conclusion
|
|
|
|
The Multi-Momentum Linear Regression Crossover Strategy is a comprehensive technical analysis trading system that aims to capture market trend changes and execute trades at appropriate times by combining multiple indicators such as RSI, EMA, and linear regression. The strategy's main advantages lie in its multidimensional market analysis approach and automated trading capabilities, but it also faces challenges such as lagging nature and parameter sensitivity.
|
|
|
|
To further enhance the strategy's reliability and profitability, it is recommended to introduce stop-loss and take-profit mechanisms, add filters to reduce false signals, implement dynamic parameter adjustments to adapt to different market environments, and consider integrating multi-timeframe analysis and volatility management. Additionally, utilizing machine learning techniques to optimize parameter selection and incorporating fundamental analysis elements can help improve the strategy's overall performance.
|
|
|
|
Through continuous backtesting, optimization, and real-world validation, this strategy has the potential to become a robust quantitative trading tool. However, traders should remain cautious when using this strategy, closely monitor market changes, and practice appropriate money management according to their risk tolerance and investment objectives.
|
|
|
|
[/trans]
|
|
|
|
|
|
|
|
> Source (PineScript)
|
|
|
|
``` pinescript
|
|
/*backtest
|
|
start: 2023-06-22 00:00:00
|
|
end: 2024-06-27 00:00:00
|
|
period: 1d
|
|
basePeriod: 1h
|
|
exchanges: [{"eid":"Futures_Binance","currency":"BTC_USDT"}]
|
|
*/
|
|
|
|
// This Pine Script™ code is subject to the terms of the Mozilla Public License 2.0 at https://mozilla.org/MPL/2.0/
|
|
// © ivoelio
|
|
|
|
//@version=5
|
|
strategy("Estrategia de Momentum", overlay=true)
|
|
|
|
// Indicadores de momentum
|
|
rsi = ta.rsi(close, 14)
|
|
ema_fast = ta.ema(close, 5)
|
|
ema_slow = ta.ema(close, 20)
|
|
|
|
// Parámetros de la regresión lineal
|
|
reg_length = input(100, title="Longitud de la Regresión Lineal")
|
|
offset = input(0, title="Desplazamiento de la Regresión Lineal")
|
|
|
|
// Cálculo de la regresión lineal
|
|
linreg = ta.linreg(close, reg_length, offset)
|
|
linreg_std = ta.stdev(close, reg_length)
|
|
|
|
// Plot de la regresión lineal
|
|
plot(linreg, color=color.yellow, title="Regresión Lineal")
|
|
plot(linreg + linreg_std, color=color.purple, title="Canal Superior de la Regresión")
|
|
plot(linreg - linreg_std, color=color.orange, title="Canal Inferior de la Regresión")
|
|
|
|
// Condiciones de entrada
|
|
longCondition = ta.crossover(ema_fast, ema_slow) and rsi > 50
|
|
shortCondition = ta.crossunder(ema_fast, ema_slow) and rsi < 50
|
|
|
|
// Gestión de operaciones
|
|
if (longCondition)
|
|
strategy.entry("Buy", strategy.long)
|
|
|
|
if (shortCondition)
|
|
strategy.entry("Sell", strategy.short)
|
|
|
|
// Plot de indicadores para visualización
|
|
plot(ema_fast, color=color.blue, title="EMA rápida")
|
|
plot(ema_slow, color=color.red, title="EMA lenta")
|
|
hline(50, "RSI 50", color=color.gray)
|
|
|
|
// Señales visuales de compra y venta
|
|
plotshape(series=longCondition, title="Buy Signal", location=location.belowbar, color=color.green, style=shape.triangleup, size=size.small)
|
|
plotshape(series=shortCondition, title="Sell Signal", location=location.abovebar, color=color.red, style=shape.triangledown, size=size.small)
|
|
|
|
// Alertas de TradingView
|
|
alertcondition(longCondition, title='Alerta de Compra', message='{"action": "BUY", "symbol": "BTCUSDT", "percentage": 75}')
|
|
alertcondition(shortCondition, title='Alerta de Venta', message='{"action": "SELL", "symbol": "BTCUSDT", "percentage": 75}')
|
|
|
|
if (longCondition)
|
|
alert('{"action": "BUY", "symbol": "BTCUSDT", "percentage": 75}')
|
|
|
|
if (shortCondition)
|
|
alert('{"action": "SELL", "symbol": "BTCUSDT", "percentage": 75}')
|
|
```
|
|
|
|
> Detail
|
|
|
|
https://www.fmz.com/strategy/455361
|
|
|
|
> Last Modified
|
|
|
|
2024-06-28 15:21:38
|