
241 lines
14 KiB
Markdown
241 lines
14 KiB
Markdown
|
|
> Name
|
|
|
|
多时间框架EMA-RSI-AO-PSAR动态止盈止损策略-Multi-Timeframe-EMA-RSI-AO-PSAR-Dynamic-Stop-Loss-and-Take-Profit-Strategy
|
|
|
|
> Author
|
|
|
|
ianzeng123
|
|
|
|
> Strategy Description
|
|
|
|
|
|
|
|
|
|
|
|
[trans]
|
|
|
|
## 概述
|
|
|
|
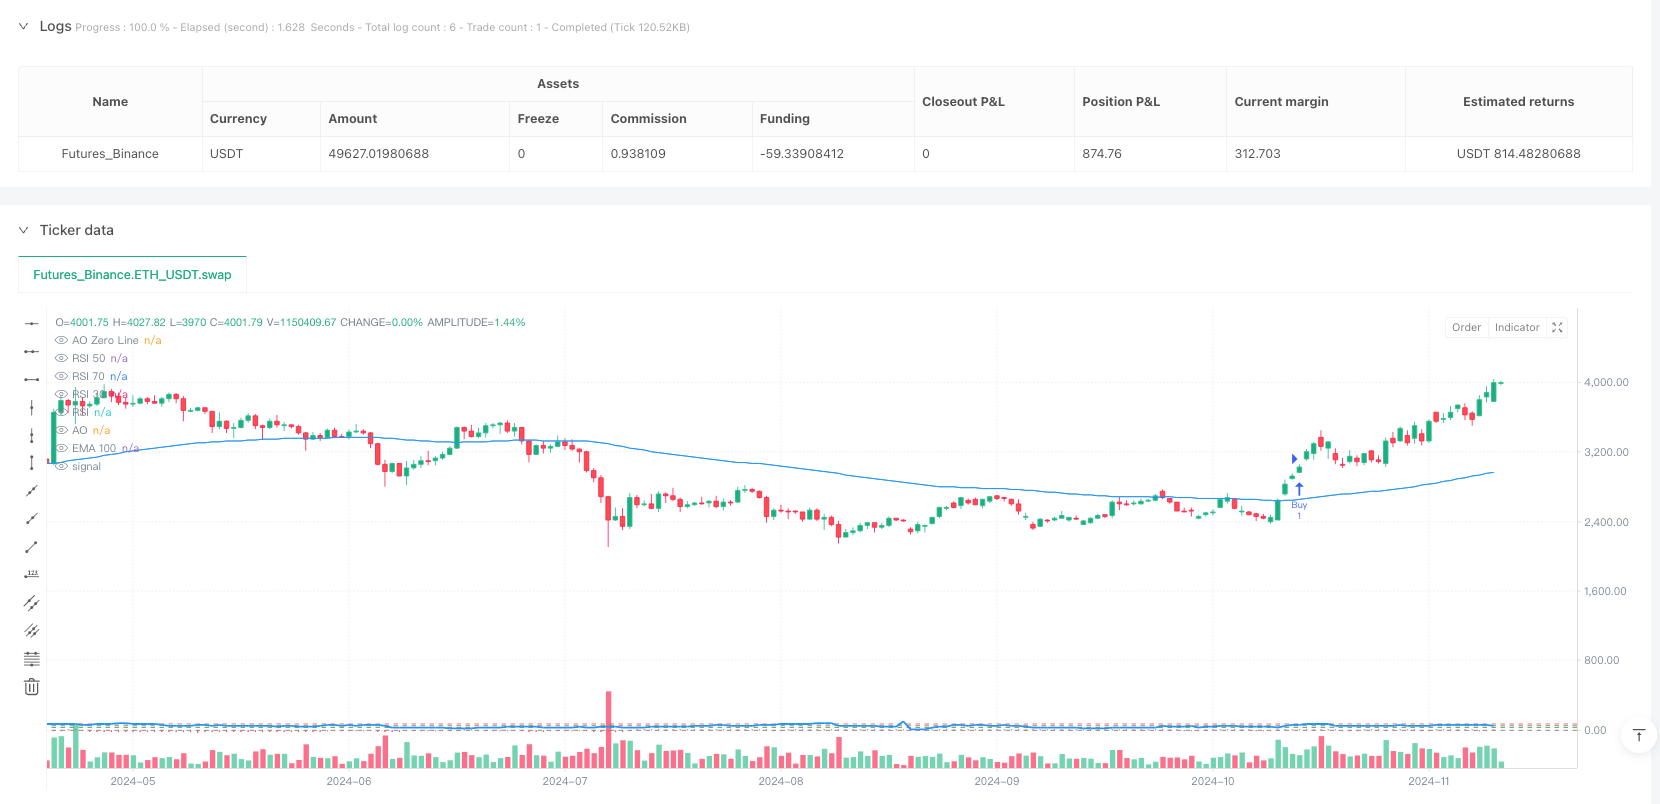
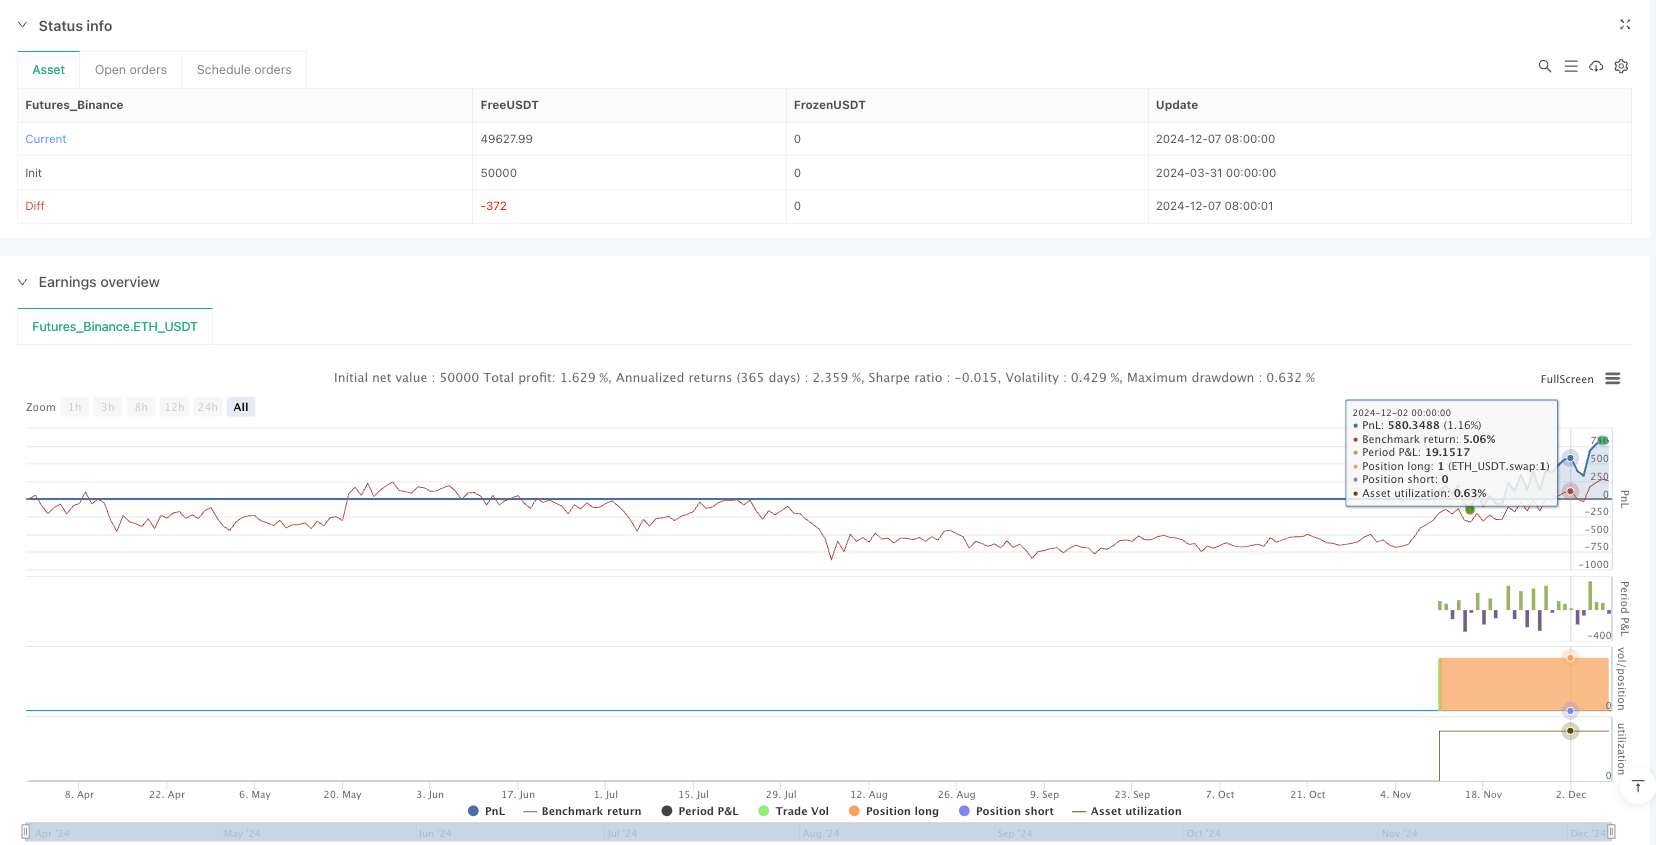
多时间框架EMA-RSI-AO-PSAR动态止盈止损策略是一个结合了多个技术指标和多时间框架分析的量化交易系统。该策略主要利用不同时间周期的Awesome Oscillator(AO)、指数移动平均线(EMA)、相对强弱指数(RSI)和抛物线转向指标(PSAR)来确定市场趋势方向,并设置动态的止损和止盈水平。策略设计为2:1的盈亏比,即止盈水平是止损距离的两倍,这有利于长期盈利能力的提升。
|
|
|
|
## 策略原理
|
|
|
|
该策略的核心原理是通过多时间框架的指标组合来确认趋势方向,并在趋势初始阶段进场,同时使用PSAR作为动态止损点。具体来说:
|
|
|
|
1. **多时间框架分析**: 策略使用不同的时间周期来观察不同指标,包括5分钟AO、60分钟EMA、15分钟RSI和60分钟PSAR,这种多时间框架方法能够减少虚假信号。
|
|
|
|
2. **买入条件**:
|
|
- AO指标在前一根K线上穿零轴(ta.crossover(ao[1], 0))
|
|
- 当前AO值大于0(ao > 0)
|
|
- 价格位于100周期EMA之上(close > ema100)
|
|
- RSI值大于或等于50(rsi >= 50)
|
|
|
|
3. **卖出条件**:
|
|
- AO指标在前一根K线下穿零轴(ta.crossunder(ao[1], 0))
|
|
- 当前AO值小于0(ao < 0)
|
|
- 价格位于100周期EMA之下(close < ema100)
|
|
- RSI值小于或等于50(rsi <= 50)
|
|
|
|
4. **风险管理**:
|
|
- 止损位设置在PSAR指标位置(stopLossLevel = psar)
|
|
- 止盈位设置为入场价格与止损之间距离的2倍(takeProfitLevel = close + 2 * (close - stopLossLevel))
|
|
|
|
## 策略优势
|
|
|
|
1. **多重确认系统**: 策略利用多个指标和不同时间周期的数据来确认交易信号,减少误报率。
|
|
|
|
2. **趋势跟踪优势**: 通过EMA和RSI的配合,确保只在明确的趋势方向上交易,避免逆势操作。
|
|
|
|
3. **动态止损机制**: 使用PSAR作为动态止损点,这种方法比固定止损更能适应市场波动,在保护利润的同时给予价格足够的呼吸空间。
|
|
|
|
4. **优化的风险回报比**: 2:1的盈亏比设置意味着即使胜率只有40%,策略也可能长期盈利。
|
|
|
|
5. **适应性强**: 策略参数可根据不同市场环境和交易品种进行调整,提高适应性。
|
|
|
|
6. **清晰的进出场规则**: 策略规则明确,减少了主观判断,有助于保持交易纪律。
|
|
|
|
## 策略风险
|
|
|
|
1. **多指标依赖风险**: 当多个指标给出不一致信号时,可能导致策略表现不佳,特别是在震荡市场中。
|
|
|
|
2. **时间滞后风险**: 由于使用了EMA等滞后指标,可能会错过一些快速市场转折点,导致入场或出场晚于最佳时机。
|
|
|
|
3. **参数敏感性**: 策略性能高度依赖于所选参数,不同市场条件下可能需要不同的参数设置。当前策略采用34周期AO、100周期EMA等固定参数,可能不适合所有市场环境。
|
|
|
|
4. **止损跳空风险**: 在重大市场事件或隔夜跳空的情况下,PSAR止损可能无法有效执行,实际止损点可能远低于预期。
|
|
|
|
5. **暴力波动风险**: 在市场剧烈波动时,PSAR止损可能会被快速触及,导致过早退出潜在的良好交易。
|
|
|
|
## 策略优化方向
|
|
|
|
1. **自适应参数设置**: 可以引入波动率指标(如ATR),根据市场波动性自动调整EMA周期、RSI阈值和PSAR参数,使策略更具适应性。
|
|
|
|
2. **加入成交量确认**: 在信号生成时增加成交量确认条件,例如要求AO上穿零轴时成交量同步放大,这可以提高信号质量。
|
|
|
|
3. **优化入场时机**: 可以添加价格形态确认,例如在AO上穿零轴后,等待小幅回调再入场,提高入场价格质量。
|
|
|
|
4. **动态盈亏比调整**: 根据市场波动性或者趋势强度动态调整盈亏比,在强趋势中使用更大的盈亏比(如3:1),在弱趋势中使用更保守的盈亏比(如1.5:1)。
|
|
|
|
5. **添加过滤器**: 引入市场环境过滤器,如ADX指标,只在趋势明确(如ADX>25)的情况下交易,避免震荡市场的虚假信号。
|
|
|
|
6. **优化资金管理**: 引入动态仓位管理,根据信号强度、市场波动性和账户净值变化调整每笔交易的仓位大小。
|
|
|
|
## 总结
|
|
|
|
多时间框架EMA-RSI-AO-PSAR动态止盈止损策略是一个综合利用多种技术指标和多时间框架分析的量化交易系统。通过AO、EMA、RSI和PSAR的协同作用,该策略能够有效识别市场趋势并设置合理的动态止损止盈水平。策略的2:1盈亏比设计也为长期盈利提供了良好基础。
|
|
|
|
然而,策略也存在多指标依赖、时间滞后和参数敏感性等风险。未来可通过引入自适应参数、成交量确认、动态盈亏比和市场环境过滤等方式进一步优化策略性能。最终,该策略的有效应用需要交易者理解其核心原理,根据具体市场环境灵活调整参数,并始终保持严格的风险管理。 ||
|
|
|
|
## Overview
|
|
|
|
The Multi-Timeframe EMA-RSI-AO-PSAR Dynamic Stop-Loss and Take-Profit Strategy is a quantitative trading system that combines multiple technical indicators across different timeframes. This strategy primarily utilizes the Awesome Oscillator (AO), Exponential Moving Average (EMA), Relative Strength Index (RSI), and Parabolic SAR (PSAR) from various time periods to determine market trend direction and set dynamic stop-loss and take-profit levels. The strategy is designed with a 2:1 reward-to-risk ratio, meaning the take-profit level is twice the distance of the stop-loss, which contributes to long-term profitability.
|
|
|
|
## Strategy Principles
|
|
|
|
The core principle of this strategy is to confirm trend direction through a combination of indicators across multiple timeframes, enter at the early stages of a trend, and use PSAR as a dynamic stop-loss point. Specifically:
|
|
|
|
1. **Multi-Timeframe Analysis**: The strategy employs different time periods to observe various indicators, including 5-minute AO, 60-minute EMA, 15-minute RSI, and 60-minute PSAR. This multi-timeframe approach helps reduce false signals.
|
|
|
|
2. **Buy Conditions**:
|
|
- AO indicator crosses above the zero line on the previous candle (ta.crossover(ao[1], 0))
|
|
- Current AO value is greater than 0 (ao > 0)
|
|
- Price is above the 100-period EMA (close > ema100)
|
|
- RSI value is greater than or equal to 50 (rsi >= 50)
|
|
|
|
3. **Sell Conditions**:
|
|
- AO indicator crosses below the zero line on the previous candle (ta.crossunder(ao[1], 0))
|
|
- Current AO value is less than 0 (ao < 0)
|
|
- Price is below the 100-period EMA (close < ema100)
|
|
- RSI value is less than or equal to 50 (rsi <= 50)
|
|
|
|
4. **Risk Management**:
|
|
- Stop-loss is set at the PSAR indicator level (stopLossLevel = psar)
|
|
- Take-profit is set at twice the distance between entry price and stop-loss (takeProfitLevel = close + 2 * (close - stopLossLevel))
|
|
|
|
## Strategy Advantages
|
|
|
|
1. **Multiple Confirmation System**: The strategy uses multiple indicators and data from different timeframes to confirm trading signals, reducing the false signal rate.
|
|
|
|
2. **Trend Following Advantage**: Through the combination of EMA and RSI, the strategy ensures trading only in clear trend directions, avoiding counter-trend operations.
|
|
|
|
3. **Dynamic Stop-Loss Mechanism**: Using PSAR as a dynamic stop-loss point, this method adapts better to market fluctuations than fixed stop-losses, giving price enough room to breathe while protecting profits.
|
|
|
|
4. **Optimized Risk-Reward Ratio**: The 2:1 reward-to-risk ratio means the strategy can be profitable in the long term even with a win rate as low as 40%.
|
|
|
|
5. **High Adaptability**: Strategy parameters can be adjusted according to different market environments and trading instruments, increasing adaptability.
|
|
|
|
6. **Clear Entry and Exit Rules**: The strategy rules are explicit, reducing subjective judgment and helping maintain trading discipline.
|
|
|
|
## Strategy Risks
|
|
|
|
1. **Multi-Indicator Dependency Risk**: When multiple indicators give inconsistent signals, the strategy may perform poorly, especially in ranging markets.
|
|
|
|
2. **Time Lag Risk**: Due to the use of lagging indicators like EMA, the strategy may miss some rapid market turning points, resulting in entries or exits later than the optimal timing.
|
|
|
|
3. **Parameter Sensitivity**: Strategy performance is highly dependent on selected parameters, and different market conditions may require different parameter settings. The current strategy uses fixed parameters such as 34-period AO and 100-period EMA, which may not be suitable for all market environments.
|
|
|
|
4. **Gap Risk for Stop-Loss**: In cases of significant market events or overnight gaps, the PSAR stop-loss may not execute effectively, and the actual stop-loss point may be far lower than expected.
|
|
|
|
5. **Violent Volatility Risk**: During extreme market volatility, the PSAR stop-loss may be quickly triggered, causing premature exits from potentially good trades.
|
|
|
|
## Strategy Optimization Directions
|
|
|
|
1. **Adaptive Parameter Settings**: Introduce volatility indicators (such as ATR) to automatically adjust EMA periods, RSI thresholds, and PSAR parameters based on market volatility, making the strategy more adaptive.
|
|
|
|
2. **Add Volume Confirmation**: Add volume confirmation conditions when generating signals, such as requiring volume to increase synchronously when AO crosses above the zero line, which can improve signal quality.
|
|
|
|
3. **Optimize Entry Timing**: Add price pattern confirmation, such as waiting for a small pullback after AO crosses above the zero line before entering, improving entry price quality.
|
|
|
|
4. **Dynamic Risk-Reward Ratio Adjustment**: Dynamically adjust the risk-reward ratio based on market volatility or trend strength, using larger ratios (e.g., 3:1) in strong trends and more conservative ratios (e.g., 1.5:1) in weak trends.
|
|
|
|
5. **Add Filters**: Introduce market environment filters, such as the ADX indicator, to trade only when trends are clear (e.g., ADX > 25), avoiding false signals in ranging markets.
|
|
|
|
6. **Optimize Fund Management**: Introduce dynamic position sizing, adjusting the size of each trade based on signal strength, market volatility, and account equity changes.
|
|
|
|
## Summary
|
|
|
|
The Multi-Timeframe EMA-RSI-AO-PSAR Dynamic Stop-Loss and Take-Profit Strategy is a quantitative trading system that comprehensively utilizes multiple technical indicators and multi-timeframe analysis. Through the synergistic effect of AO, EMA, RSI, and PSAR, this strategy can effectively identify market trends and set reasonable dynamic stop-loss and take-profit levels. The strategy's 2:1 reward-to-risk ratio design also provides a good foundation for long-term profitability.
|
|
|
|
However, the strategy also has risks such as multi-indicator dependency, time lag, and parameter sensitivity. Future optimization can be achieved through introducing adaptive parameters, volume confirmation, dynamic risk-reward ratios, and market environment filters. Ultimately, effective application of this strategy requires traders to understand its core principles, flexibly adjust parameters according to specific market environments, and always maintain strict risk management.[/trans]
|
|
|
|
|
|
|
|
> Source (PineScript)
|
|
|
|
``` pinescript
|
|
/*backtest
|
|
start: 2024-03-31 00:00:00
|
|
end: 2024-12-08 00:00:00
|
|
period: 1d
|
|
basePeriod: 1d
|
|
exchanges: [{"eid":"Futures_Binance","currency":"ETH_USDT"}]
|
|
*/
|
|
|
|
//@version=6
|
|
strategy("Buy/Sell Strategy AO EMA RSI PSAR SL/TP", overlay=true)
|
|
|
|
// Input parameters for custom timeframes
|
|
aoTF = input.timeframe("5", title="AO Timeframe")
|
|
emaTF = input.timeframe("60", title="EMA 100 TF")
|
|
rsiTF = input.timeframe("15", title="RSI Timeframe")
|
|
psarTF = input.timeframe("60", title="PSAR Timeframe")
|
|
|
|
// Input parameters for custom periods
|
|
aoPeriod = input.int(34, minval=1, title="AO Period")
|
|
emaPeriod = input.int(100, minval=1, title="EMA Period")
|
|
rsiPeriod = input.int(14, minval=1, title="RSI Period")
|
|
psarStart = input.float(0.02, title="PSAR Start")
|
|
psarInc = input.float(0.02, title="PSAR Increment")
|
|
psarMax = input.float(0.2, title="PSAR Max")
|
|
|
|
// Indicator calculations with custom timeframes and periods
|
|
ao = request.security(syminfo.tickerid, aoTF, ta.sma(close, aoPeriod) - ta.sma(close, aoPeriod * 2))
|
|
ema100 = request.security(syminfo.tickerid, emaTF, ta.ema(close, emaPeriod))
|
|
rsi = request.security(syminfo.tickerid, rsiTF, ta.rsi(close, rsiPeriod))
|
|
psar = request.security(syminfo.tickerid, psarTF, ta.sar(psarStart, psarInc, psarMax))
|
|
|
|
// Buy signal condition: Price must be above EMA, and other conditions must be met
|
|
buyCond = ta.crossover(ao[1], 0) and ao > 0 and close > ema100 and rsi >= 50
|
|
|
|
// Sell signal condition: Price must be below EMA, and other conditions must be met
|
|
sellCond = ta.crossunder(ao[1], 0) and ao < 0 and close < ema100 and rsi <= 50
|
|
|
|
// Calculate stop loss and take profit levels
|
|
stopLossLevel = psar
|
|
takeProfitLevel = close + 2 * (close - stopLossLevel) // Take profit is twice the size of the stop loss
|
|
|
|
// Strategy entries and exits with stop loss and take profit
|
|
if (buyCond)
|
|
strategy.entry("Buy", strategy.long, stop=stopLossLevel, limit=takeProfitLevel)
|
|
|
|
if (sellCond)
|
|
strategy.exit("Sell", from_entry="Buy", stop=stopLossLevel, limit=takeProfitLevel)
|
|
|
|
// Plotting the EMA100 for visual reference
|
|
plot(ema100, title="EMA 100", color=color.blue)
|
|
|
|
// Plot Awesome Oscillator (AO) in its own subplot
|
|
plot(ao, title="AO", color=color.red, linewidth=2, style=plot.style_histogram)
|
|
hline(0, title="AO Zero Line", color=color.gray)
|
|
|
|
// Plot RSI in its own subplot
|
|
plot(rsi, title="RSI", color=color.blue, linewidth=2)
|
|
hline(50, title="RSI 50", color=color.gray)
|
|
hline(70, title="RSI 70", color=color.red)
|
|
hline(30, title="RSI 30", color=color.green)
|
|
|
|
// Plot Parabolic SAR (PSAR) on the main chart
|
|
plot(psar, title="PSAR", color=color.purple, style=plot.style_cross, linewidth=2)
|
|
|
|
|
|
```
|
|
|
|
> Detail
|
|
|
|
https://www.fmz.com/strategy/489057
|
|
|
|
> Last Modified
|
|
|
|
2025-04-01 17:03:22
|