
20 KiB
Name
多时间框架动量突破交易策略结合趋势跟踪与ATR风险管理-Multi-Timeframe-Momentum-Breakout-Trading-Strategy-with-Trend-Following-and-ATR-Risk-Management
Author
ianzeng123
Strategy Description
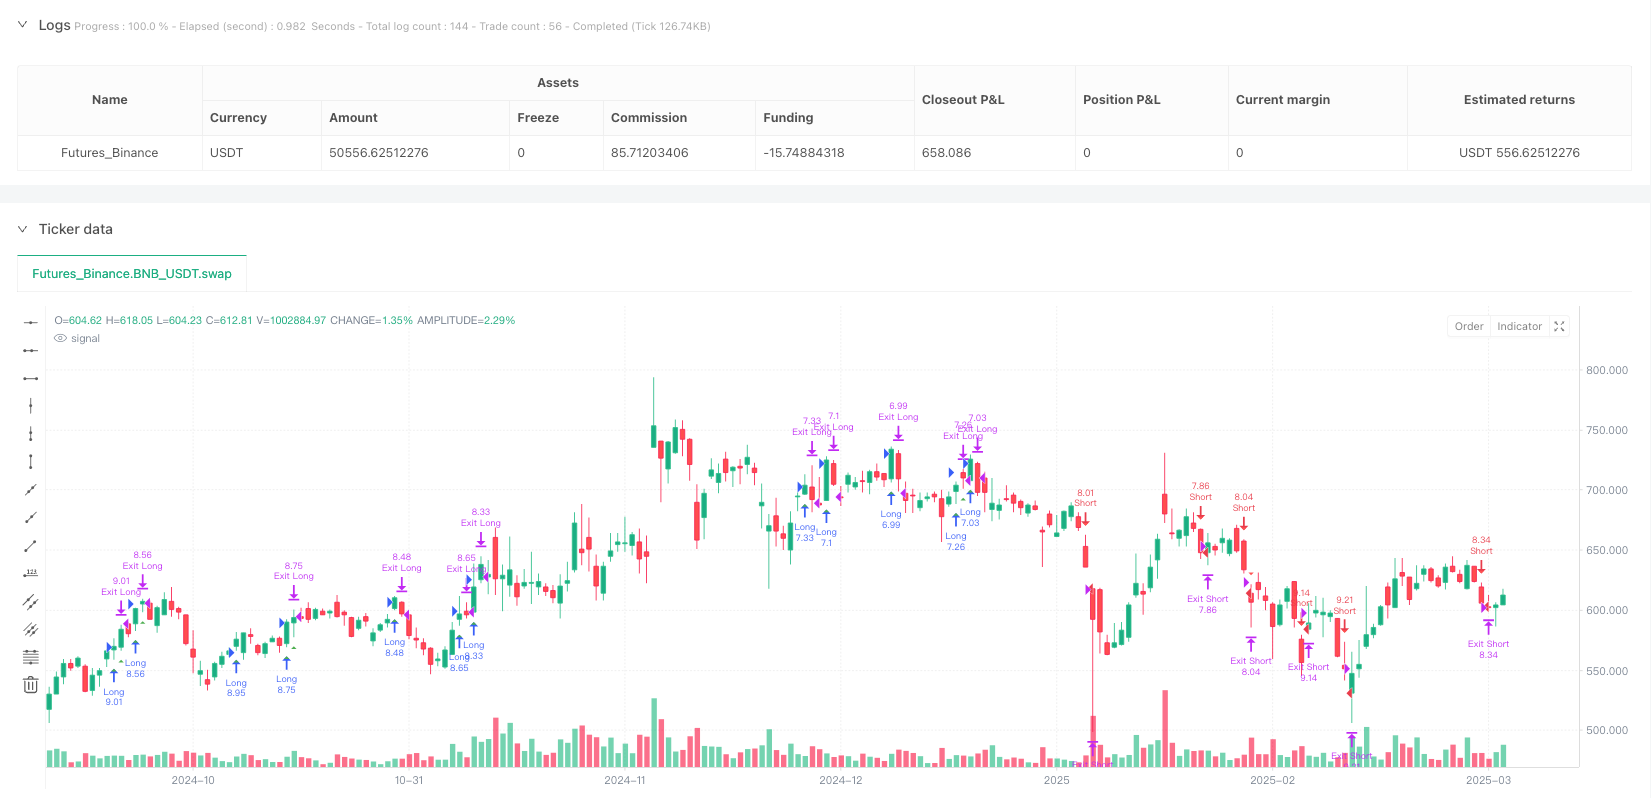
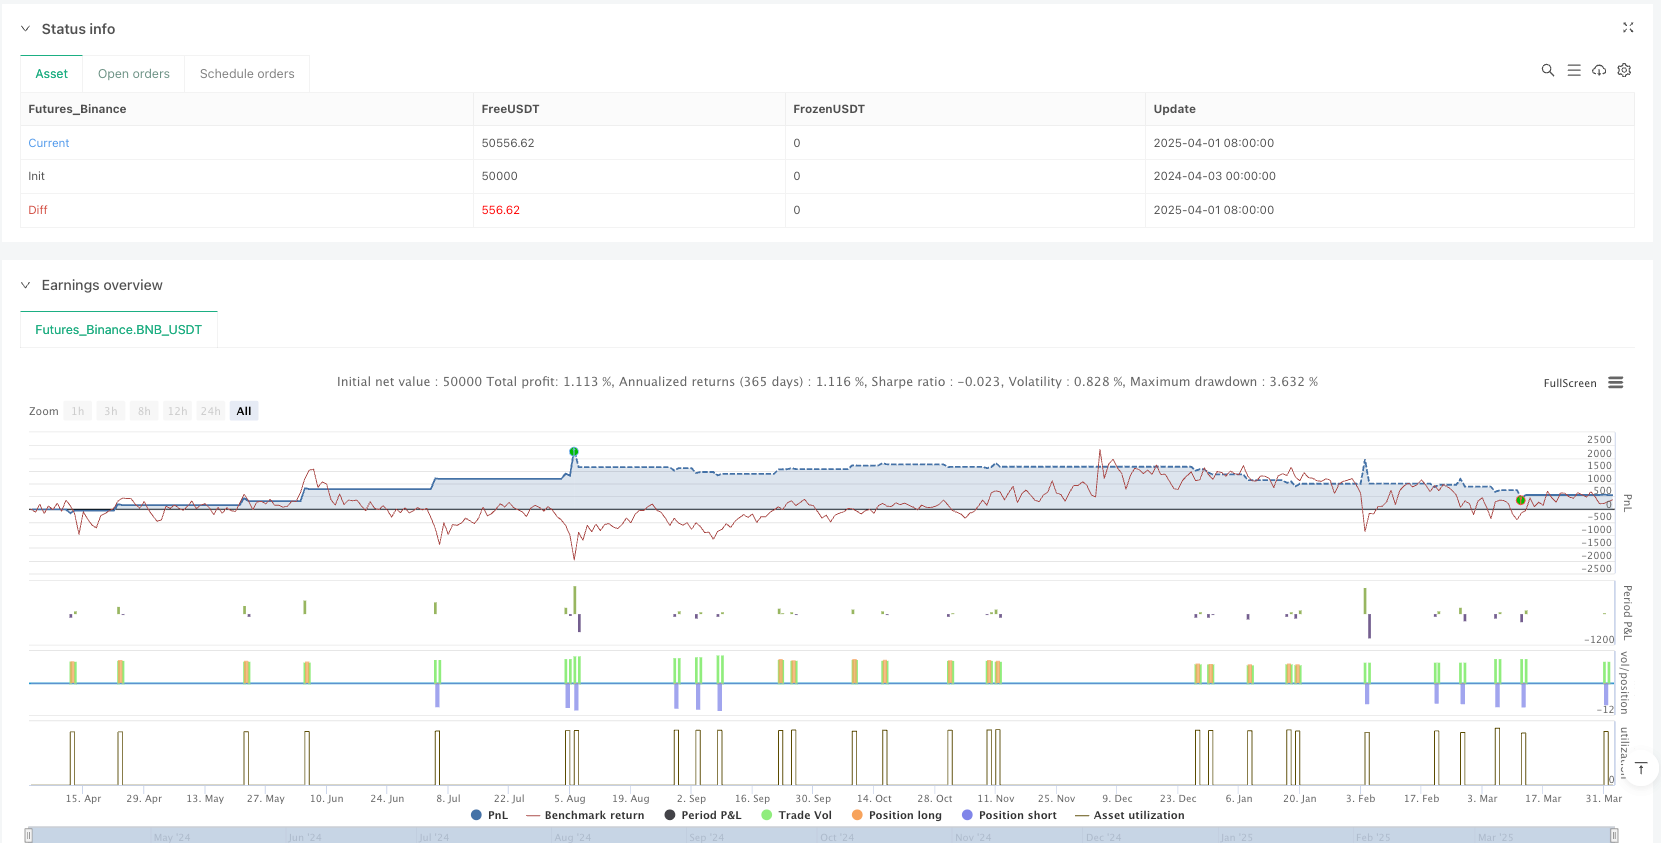
[trans]
策略概述
这个动量突破交易策略是一个技术分析驱动的交易系统,专为捕捉与主导趋势一致的突破行情而设计。该策略巧妙地结合了指数移动平均线(EMA)、相对强弱指标(RSI)和平均真实波幅(ATR),形成了一个全面的交易框架,不仅包含明确的多空入场条件,还具备基于波动率的动态止损机制。
该策略的核心思想是在确认趋势方向后,等待价格突破近期形成的支撑或阻力位,从而捕捉价格的加速运动。同时,RSI指标作为动量过滤器,帮助避免在超买或超卖状态下冒险入场。风险管理方面,策略采用基于ATR的止损和追踪止损,使止损点能够根据市场实际波动性进行动态调整,而非使用固定点位。
策略原理
该策略的运作基于以下几个关键组件:
-
趋势识别:使用两条不同周期的指数移动平均线(EMA)来确定市场方向。快速EMA(默认20周期)和慢速EMA(默认50周期)的相对位置决定了趋势判断。当快速EMA位于慢速EMA之上时,被视为上升趋势;反之则被视为下降趋势。
-
动量过滤:应用14周期的RSI指标来避免在极端条件下入场。当RSI高于70时,避免做多以防在超买状态入场;当RSI低于30时,避免做空以防在超卖状态入场。
-
突破逻辑:检测价格是否突破了可配置周期内(默认5个K线)的最高点或最低点,不包括当前K线。这些点位分别作为阻力位和支撑位。
-
入场条件:
- 多头入场:价格突破近期阻力位 + 上升趋势确认(快速EMA > 慢速EMA) + RSI不处于超买状态
- 空头入场:价格突破近期支撑位 + 下降趋势确认(快速EMA < 慢速EMA) + RSI不处于超卖状态
-
仓位管理:
- 止损设置基于ATR:
- 多头止损 = 入场价格 - (ATR * 乘数)
- 空头止损 = 入场价格 + (ATR * 乘数)
- 追踪止损:
- 同样使用ATR * 追踪乘数作为trail_points和trail_offset
- 默认止损和追踪乘数均为1.5倍ATR
- 止损设置基于ATR:
策略还包含了webhook警报功能,可发送JSON格式化的警报以执行市场订单,以及视觉提示功能,在图表上标示入场点位。
策略优势
深入分析代码后,可以总结出该策略的几个显著优势:
-
趋势与突破的协同:通过结合EMA趋势确认和价格突破,策略能够避免在反趋势中进行突破交易,提高了交易的成功率。这种"顺势而为"的方法有助于捕捉更可靠的价格运动。
-
动态风险管理:基于ATR的止损和追踪止损机制,使风险控制能够自适应市场波动性。在波动性扩大时,止损位会更宽松;在波动性收缩时,止损位会更紧凑,这种动态调整比固定点位的止损更符合市场实际情况。
-
多重过滤机制:通过EMA趋势过滤和RSI动量过滤的结合,策略能够避免在不利的市场状态下入场,减少假突破带来的亏损。
-
清晰的交易规则:策略定义了明确的入场和出场条件,没有主观判断的空间,这有助于消除情绪因素对交易决策的影响。
-
可自定义参数:策略提供了多个可调整的参数,包括EMA周期、RSI设置、突破周期和ATR乘数等,使用者可以根据不同的市场环境和交易品种进行优化。
-
集成警报功能:内置的webhook警报功能便于与自动交易系统集成,提高了策略的实用性和执行效率。
策略风险
尽管该策略设计合理,但仍存在一些潜在风险和挑战:
-
假突破风险:尽管有趋势和RSI过滤,市场仍可能出现价格短暂突破后迅速回撤的情况,导致止损触发。解决方法:可以考虑增加确认机制,如要求价格在突破后保持一定时间或幅度才触发入场。
-
趋势反转风险:EMA作为滞后指标,在趋势转折点反应较慢,可能导致在趋势已经开始反转时仍然按原趋势方向交易。解决方法:可以增加更敏感的趋势指标作为辅助,或者添加趋势强度过滤。
-
参数优化过拟合:过度优化参数可能导致策略在历史数据上表现出色,但在实盘中效果不佳。解决方法:应使用足够长的测试周期和多个市场环境进行回测,避免过度拟合特定市场阶段。
-
市场波动性变化:尽管ATR可以适应波动性变化,但在波动性突然大幅增加的情况下(如重大新闻事件),止损可能仍然不够宽松。解决方法:可以考虑在特殊时期手动调整ATR乘数,或添加波动性变化的预警机制。
-
连续亏损心理压力:如遇到市场频繁振荡,可能导致连续止损,对交易者心理造成压力。解决方法:设定合理的资金管理规则,限制单笔交易风险,以及在不利市场环境下暂停交易的机制。
策略优化方向
基于代码分析,该策略还有以下几个可能的优化方向:
-
加入成交量确认:目前策略仅依赖价格数据,可以考虑加入成交量指标作为突破确认条件,以减少假突破的风险。成交量的增加通常是突破有效性的重要指标。
-
多时间框架分析:引入更高时间框架的趋势判断,确保交易方向与更大趋势保持一致,这可以通过security函数实现高时间框架数据的获取。
-
动态调整仓位大小:基于ATR或其他波动性指标动态调整头寸规模,在波动性较低时增加仓位,波动性较高时减少仓位,以优化风险回报比。
-
加入利润目标:除了追踪止损外,也可以设置基于ATR的利润目标,在达到特定风险回报比时部分获利了结。
-
增强入场条件:考虑加入蜡烛图形态、突破后的回测确认或其他技术指标作为辅助确认,提高入场质量。
-
优化RSI过滤条件:当前RSI过滤可能太过严格,考虑使用动态的RSI阈值,或者基于RSI的变化率而非绝对值来判断。
-
回撤控制机制:增加整体策略回撤控制,如当达到特定回撤百分比时暂停交易或减少仓位规模,以保护资金。
总结
"动量突破交易策略"是一个结合了趋势跟踪、动量分析和波动率风险管理的完整交易系统。通过EMA识别趋势方向,RSI过滤极端市场状态,并在支撑阻力突破点入场,该策略提供了一个系统化的方法来捕捉市场的突破性机会。
策略的核心优势在于其全面性和自适应性,不仅关注入场时机,也重视风险控制和仓位管理。基于ATR的动态止损机制使策略能够随市场波动性调整保护机制,这在不同市场环境中都能保持一定的适应性。
尽管存在一些潜在风险,如假突破和趋势反转的挑战,但通过建议的优化方向,如加入成交量确认、多时间框架分析和动态仓位管理等,该策略有望进一步提升其稳定性和盈利能力。
对于有一定交易经验的技术分析爱好者而言,这是一个值得尝试和进一步定制的策略框架,可以根据个人风险偏好和交易风格进行参数调整和策略增强。 ||
Strategy Overview
This Momentum Breakout Strategy is a technically-driven trading system designed to capture breakout movements aligned with the prevailing trend. The strategy cleverly combines Exponential Moving Averages (EMAs), Relative Strength Index (RSI), and Average True Range (ATR) to form a comprehensive trading framework that includes clear long/short entry conditions and volatility-based dynamic stop-loss mechanisms.
The core concept of this strategy is to wait for price breakouts of recent support or resistance levels after confirming trend direction, thereby capturing accelerated price movements. Meanwhile, the RSI indicator serves as a momentum filter, helping to avoid risky entries during overbought or oversold conditions. For risk management, the strategy employs ATR-based stop-losses and trailing stops, allowing stop points to dynamically adjust according to actual market volatility rather than using fixed levels.
Strategy Principles
The operation of this strategy is based on several key components:
-
Trend Identification: Uses two Exponential Moving Averages (EMAs) with different periods to determine market direction. The relative position of the fast EMA (default 20 periods) and slow EMA (default 50 periods) determines trend judgment. When the fast EMA is above the slow EMA, it's considered an uptrend; otherwise, it's considered a downtrend.
-
Momentum Filter: Applies a 14-period RSI indicator to avoid entries during extreme conditions. Avoids long entries when RSI is above 70 to prevent entering during overbought conditions; avoids short entries when RSI is below 30 to prevent entering during oversold conditions.
-
Breakout Logic: Detects whether prices break through the highest or lowest points within a configurable period (default 5 candles), excluding the current candle. These points serve as resistance and support levels respectively.
-
Entry Conditions:
- Long Entry: Price breaks above recent resistance + Uptrend confirmed (Fast EMA > Slow EMA) + RSI not in overbought condition
- Short Entry: Price breaks below recent support + Downtrend confirmed (Fast EMA < Slow EMA) + RSI not in oversold condition
-
Position Management:
- Stop-Loss based on ATR:
- Long stop-loss = Entry price - (ATR * multiplier)
- Short stop-loss = Entry price + (ATR * multiplier)
- Trailing Stop:
- Similarly uses ATR * trailing multiplier for both trail_points and trail_offset
- Default stop-loss and trailing multiplier are both 1.5x ATR
- Stop-Loss based on ATR:
The strategy also includes webhook alert functionality to send JSON-formatted alerts for market orders and visual cues to mark entry points on the chart.
Strategy Advantages
After in-depth analysis of the code, several significant advantages of this strategy can be summarized:
-
Synergy of Trend and Breakout: By combining EMA trend confirmation and price breakouts, the strategy avoids breakout trading against the trend, increasing the success rate of trades. This "trend-following" approach helps capture more reliable price movements.
-
Dynamic Risk Management: The ATR-based stop-loss and trailing stop mechanism allows risk control to adapt to market volatility. When volatility expands, stop-loss positions become wider; when volatility contracts, stop-loss positions become tighter. This dynamic adjustment is more in line with actual market conditions than fixed-point stops.
-
Multiple Filtering Mechanisms: Through the combination of EMA trend filtering and RSI momentum filtering, the strategy can avoid entering during unfavorable market states, reducing losses from false breakouts.
-
Clear Trading Rules: The strategy defines explicit entry and exit conditions with no room for subjective judgment, which helps eliminate emotional factors in trading decisions.
-
Customizable Parameters: The strategy provides multiple adjustable parameters, including EMA periods, RSI settings, breakout periods, and ATR multipliers, allowing users to optimize according to different market environments and trading instruments.
-
Integrated Alert Functionality: The built-in webhook alert functionality facilitates integration with automated trading systems, enhancing the strategy's practicality and execution efficiency.
Strategy Risks
Despite its reasonable design, the strategy still has some potential risks and challenges:
-
False Breakout Risk: Despite trend and RSI filtering, the market may still experience situations where prices briefly break through before quickly retracing, triggering stop-losses. Solution: Consider adding confirmation mechanisms, such as requiring prices to maintain a certain duration or amplitude after breakout before triggering entry.
-
Trend Reversal Risk: As a lagging indicator, EMA responds slowly at trend turning points, which may lead to trading in the original trend direction even when the trend has already begun to reverse. Solution: Add more sensitive trend indicators as auxiliary tools or incorporate trend strength filtering.
-
Parameter Optimization Overfitting: Excessive parameter optimization may cause the strategy to perform well on historical data but poorly in live trading. Solution: Use sufficiently long testing periods and multiple market environments for backtesting to avoid overfitting to specific market phases.
-
Market Volatility Changes: Although ATR can adapt to volatility changes, in cases of sudden substantial increases in volatility (such as major news events), stops may still not be wide enough. Solution: Consider manually adjusting ATR multipliers during special periods or adding early warning mechanisms for volatility changes.
-
Psychological Pressure from Consecutive Losses: Frequent market oscillations may lead to consecutive stop-losses, causing psychological pressure on traders. Solution: Establish reasonable fund management rules, limit single-trade risk, and implement mechanisms to pause trading during unfavorable market environments.
Strategy Optimization Directions
Based on code analysis, there are several possible optimization directions for this strategy:
-
Add Volume Confirmation: The current strategy relies solely on price data. Consider adding volume indicators as breakout confirmation conditions to reduce the risk of false breakouts. Increased volume is usually an important indicator of breakout validity.
-
Multi-Timeframe Analysis: Introduce trend determination from higher timeframes to ensure that trading direction aligns with larger trends. This can be achieved by using the security function to obtain higher timeframe data.
-
Dynamic Position Sizing: Dynamically adjust position size based on ATR or other volatility indicators, increasing positions when volatility is lower and decreasing positions when volatility is higher, to optimize the risk-reward ratio.
-
Add Profit Targets: In addition to trailing stops, consider setting ATR-based profit targets to partially take profits when specific risk-reward ratios are reached.
-
Enhance Entry Conditions: Consider adding candlestick patterns, post-breakout retest confirmation, or other technical indicators as auxiliary confirmations to improve entry quality.
-
Optimize RSI Filtering Conditions: The current RSI filtering may be too strict. Consider using dynamic RSI thresholds or basing judgments on RSI rate of change rather than absolute values.
-
Drawdown Control Mechanism: Add overall strategy drawdown control, such as pausing trading or reducing position size when reaching a specific drawdown percentage, to protect capital.
Summary
The "Momentum Breakout Trading Strategy" is a complete trading system that combines trend following, momentum analysis, and volatility-based risk management. By using EMAs to identify trend direction, RSI to filter extreme market conditions, and entering at support/resistance breakout points, this strategy provides a systematic approach to capturing breakout opportunities in the market.
The core advantages of the strategy lie in its comprehensiveness and adaptability, focusing not only on entry timing but also on risk control and position management. The ATR-based dynamic stop-loss mechanism allows the strategy to adjust protection mechanisms with market volatility, maintaining adaptability across different market environments.
Despite some potential risks, such as false breakouts and trend reversal challenges, through the suggested optimization directions like adding volume confirmation, multi-timeframe analysis, and dynamic position management, this strategy has the potential to further enhance its stability and profitability.
For technical analysis enthusiasts with certain trading experience, this is a strategy framework worth trying and further customizing, which can be parameter-adjusted and strategy-enhanced according to individual risk preferences and trading styles.[/trans]
Source (PineScript)
/*backtest
start: 2024-04-03 00:00:00
end: 2025-04-02 00:00:00
period: 1d
basePeriod: 1d
exchanges: [{"eid":"Futures_Binance","currency":"BNB_USDT"}]
*/

//@version=6
strategy("Ruben.Ramiro - Momentum Breakout Strategy", overlay=true, initial_capital=10000, default_qty_type=strategy.percent_of_equity, default_qty_value=10)

// ** Adjustable Parameters **
// Moving averages for trend detection
emaFastLen    = input.int(20, "Fast EMA", minval=1)
emaSlowLen    = input.int(50, "Slow EMA", minval=1)
// RSI
rsiLen        = input.int(14, "RSI Period", minval=1)
rsiOverbought = input.int(70, "RSI Overbought", minval=1, maxval=100)
rsiOversold   = input.int(30, "RSI Oversold", minval=1, maxval=100)
// Breakout (resistance and support)
breakoutPeriod = input.int(5, "Breakout Periods", minval=1)
// ATR for risk management
atrLen       = input.int(14, "ATR Period", minval=1)
atrMultSL    = input.float(1.5, "ATR Stop-Loss Multiplier", step=0.1)
atrMultTrail = input.float(1.5, "ATR Trailing Stop Multiplier", step=0.1)

// ** Technical Indicators **
emaFast = ta.ema(close, emaFastLen)
emaSlow = ta.ema(close, emaSlowLen)
rsi     = ta.rsi(close, rsiLen)
atr     = ta.atr(atrLen)

// ** Support and Resistance Calculation **
recentResistance = ta.highest(high, breakoutPeriod)[1]  // Highest high of the last N periods
recentSupport    = ta.lowest(low, breakoutPeriod)[1]    // Lowest low of the last N periods

// ** Entry Conditions **
bullishTrend   = emaFast > emaSlow
bearishTrend   = emaFast < emaSlow
notOverbought  = rsi < rsiOverbought
notOversoldExt = rsi > rsiOversold

// Long Entry: Breakout above resistance + bullish trend + not overbought
longCondition  = close > recentResistance and bullishTrend and notOverbought
// Short Entry: Breakout below support + bearish trend + not extremely oversold
shortCondition = close < recentSupport and bearishTrend and notOversoldExt

// ** Trade Execution **
if (longCondition)
    strategy.entry("Long", strategy.long)
if (shortCondition)
    strategy.entry("Short", strategy.short)

// ** Stop-Loss and Trailing Stop Management **
if (strategy.position_size > 0)  // If a Long position is open
    stopLong = strategy.position_avg_price - atr * atrMultSL
    strategy.exit("Exit Long", from_entry="Long", stop=stopLong, trail_points=atr * atrMultTrail, trail_offset=atr * atrMultTrail)

if (strategy.position_size < 0)  // If a Short position is open
    stopShort = strategy.position_avg_price + atr * atrMultSL
    strategy.exit("Exit Short", from_entry="Short", stop=stopShort, trail_points=atr * atrMultTrail, trail_offset=atr * atrMultTrail)

// ** Chart Visualization **
plotshape(series=longCondition, location=location.belowbar, color=color.green, style=shape.triangleup, title="Long Entry")
plotshape(series=shortCondition, location=location.abovebar, color=color.red, style=shape.triangledown, title="Short Entry")

// ** Alerts for Webhook-Ready JSON in Alpaca **
alertcondition(longCondition, title="Long Entry Alert", message='{"symbol":"{{ticker}}","qty":1,"side":"buy","type":"market","limit_price":"{{close}}","time_in_force":"gtc"}')
alertcondition(shortCondition, title="Short Entry Alert", message='{"symbol":"{{ticker}}","qty":1,"side":"sell","type":"market","limit_price":"{{close}}","time_in_force":"gtc"}')
Detail
https://www.fmz.com/strategy/489284
Last Modified
2025-04-03 15:17:50