
14 KiB
Name
多指标评分交易策略Multi-Indicator-Scoring-Trading-Strategy
Author
ChaoZhang
Strategy Description
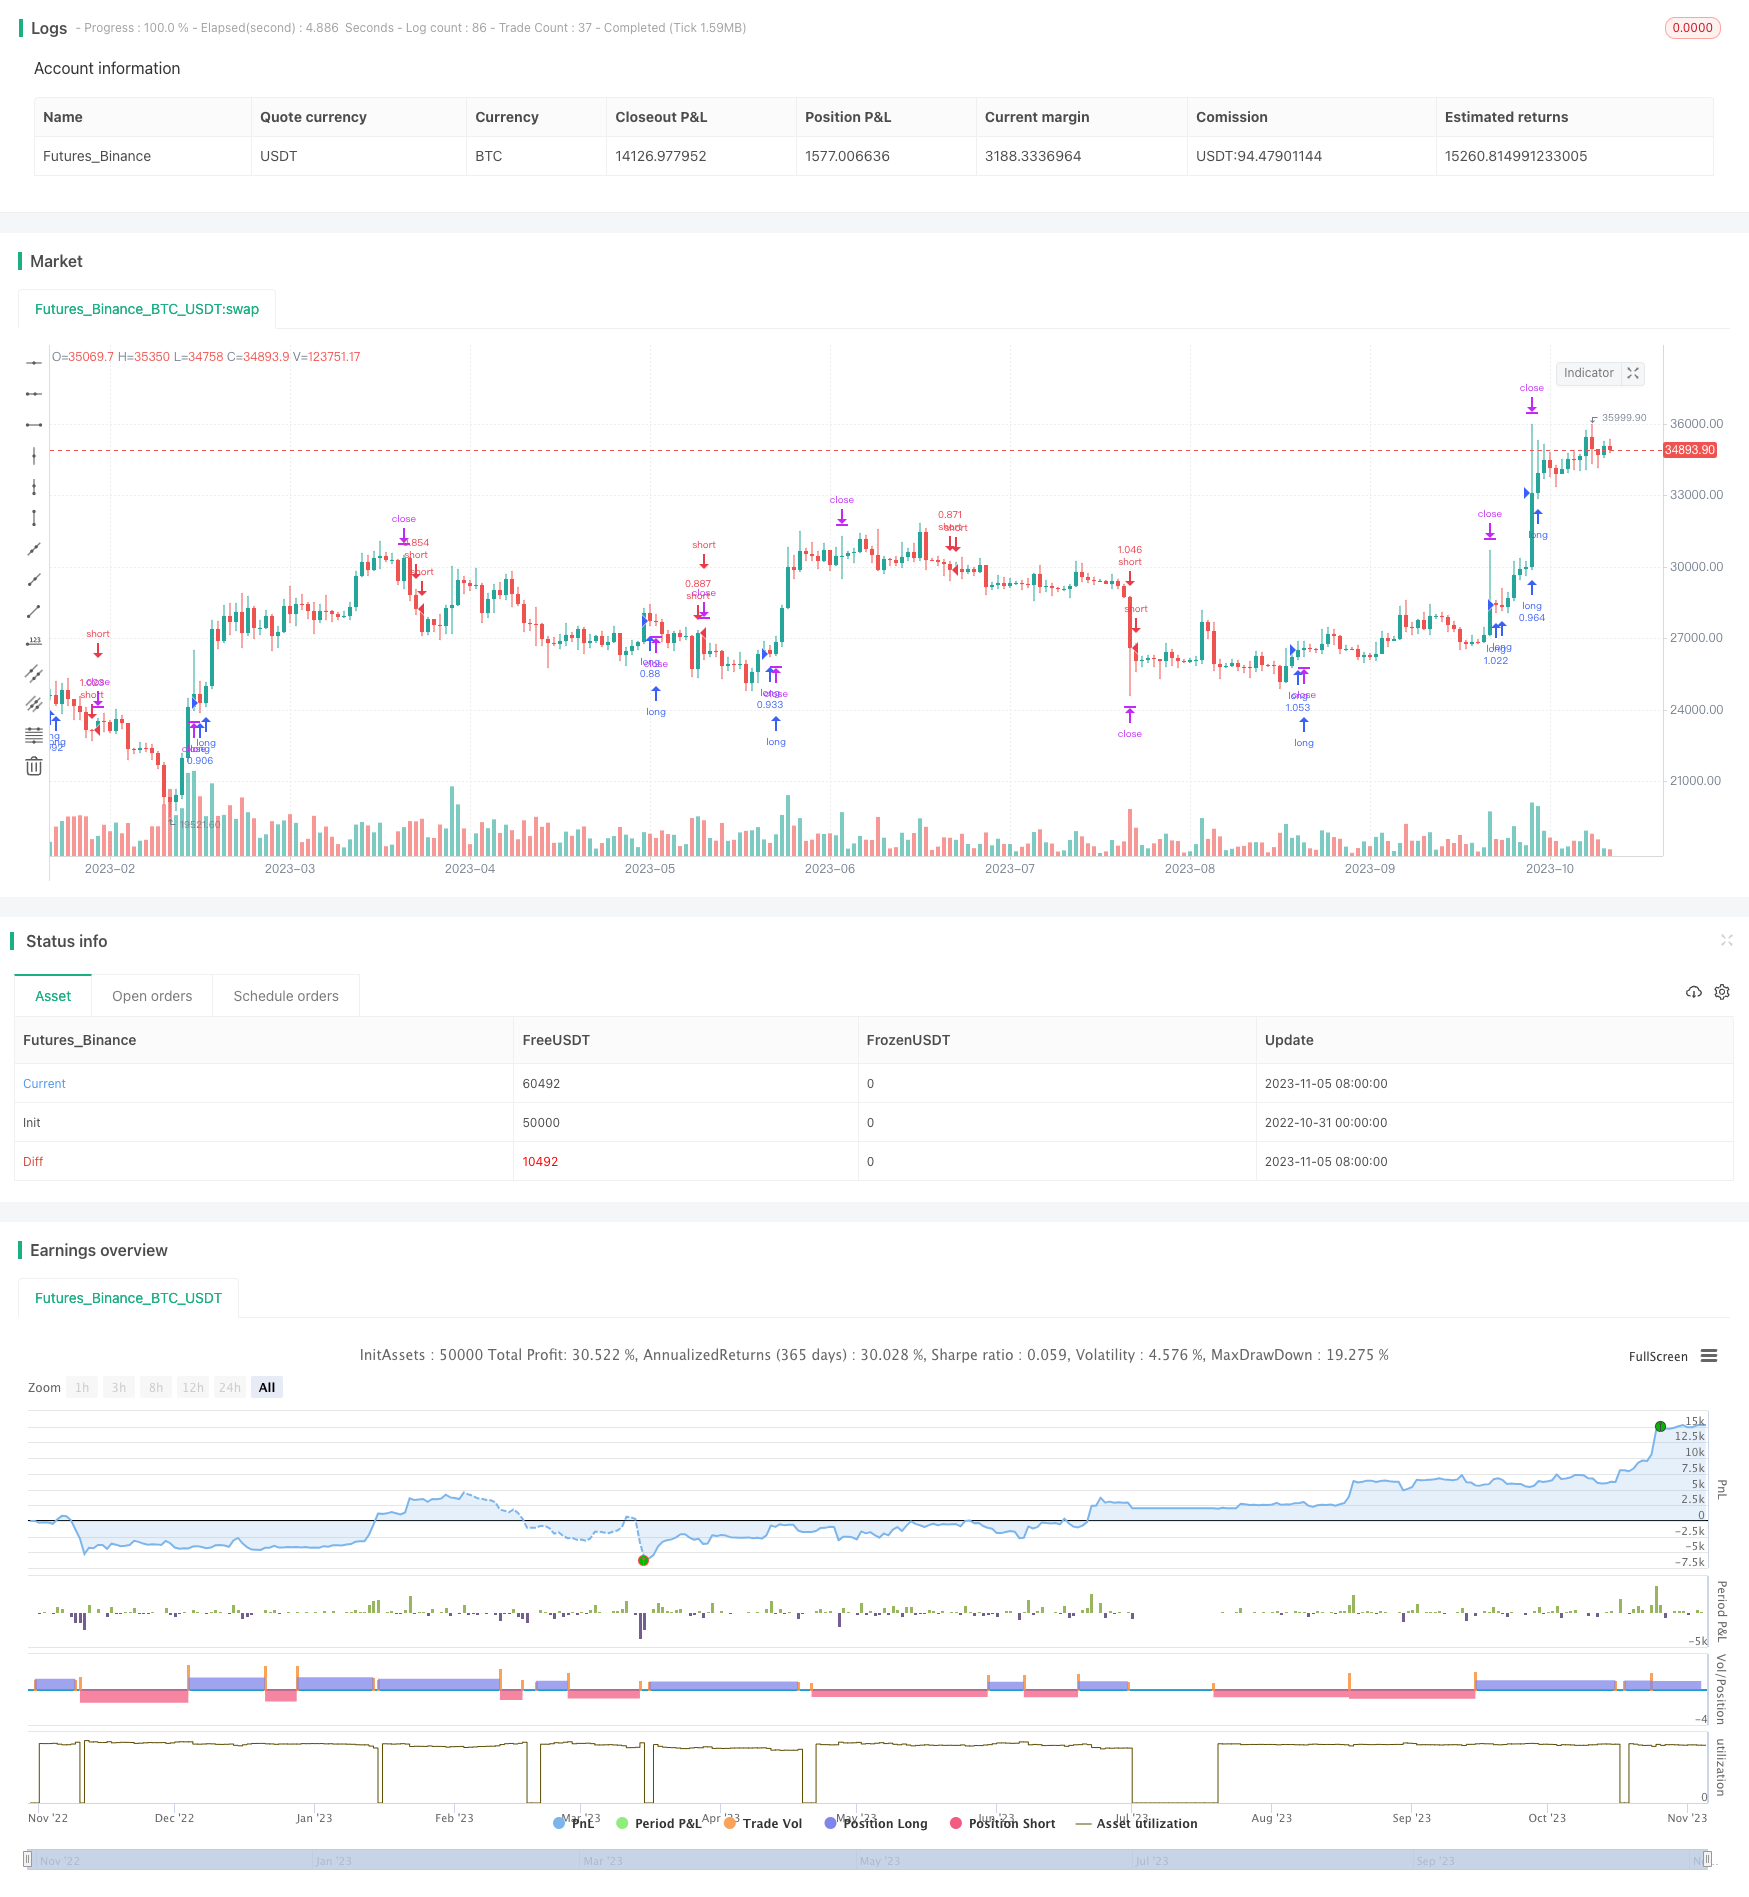 [trans]
概述
多指标评分交易策略通过整合技术指标评分,识别趋势方向和力度,实现自动交易。该策略综合考虑一组指标,包括Ichimoku云,HMA,RSI,Stoch,CCI和MACD。根据每个指标的结果,为其评分,然后综合所有指标的评分,形成一个整体评分。当整体评分高于阈值时做多,低于阈值时做空。
策略原理
该策略由多个部分组成:
-
计算一组指标,包括Ichimoku云,Hull移动平均线,相对强弱指数,随机指标,商品通道指数和移动平均线敏感度。
-
对每个指标进行评分。当指标显示多头信号时给予正分,空头信号时给予负分。
-
将所有指标评分进行求和平均,得到一个综合评分。
-
将综合评分与事先设定的阈值进行比较,判断整体趋势方向。评分高于阈值时看多,低于阈值时看空。
-
根据判断结果进行开仓。当看多时做多,看空时做空。
-
止损停利通过ATR指标设定。
该策略充分利用了多种指标的优势,综合判断市场趋势方向。相比单一指标,能够过滤掉部分虚假信号,提高信号的可靠性。
优势分析
该策略具有以下优势:
-
多指标综合判断,提高信号准确率。单一指标容易产生误判,该策略通过评分求平均的方式,能有效过滤虚假信号。
-
利用指标优势,识别趋势和目前力度。例如Ichimoku云判断大趋势,Stoch判断超买超卖。
-
自动交易避免情绪影响,严格执行策略信号。
-
使用ATR设定止损停利点,有利于风险控制。
-
可以针对不同品种进行参数调优。指标参数和评分阈值都可以优化。
-
策略逻辑简单清晰,易于理解和修改。
风险分析
该策略也存在以下风险:
-
多指标组合不一定优于单一指标,需要反复测试找到最佳参数。
-
指标发出错误信号时,评分求平均也无法完全避免损失。
-
ATR止损可能过于接近或过于宽松,需要根据品种特点调整。
-
需要避免过度优化而导致的曲线拟合。应在不同品种和时间段测试策略稳健性。
-
交易频率可能过高,交易成本也会影响最终收益。
优化方向
该策略可以从以下几个方面进行优化:
-
测试更多指标的组合,找到对特定品种最优的指标选择。
-
调整每个指标的评分权重,优化评分算法。
-
动态调整ATR参数,使止损停利更贴合市场波动。
-
加入交易过滤条件,减少不必要的交易频率。例如趋势过滤,交易量过滤等。
-
进行步进优化找到参数优化区间,再随机/网格优化寻找最佳参数组合。
-
在多品种多时间框架测试策略稳健性,避免过度优化。
-
组合其他有效交易策略,形成策略组合。
总结
多指标评分交易策略通过评分求平均的思路,提高了信号判断的准确性和可靠性。该策略参数调优空间大,可针对不同品种进行优化得到较好效果。但是也需要注意过优化的风险,保持参数优化和策略测试的科学性。作为一种优化方向广阔的交易策略思路,值得进一步研究和应用。
||
Overview
The multi indicator scoring trading strategy integrates technical indicators scoring to identify trend direction and strength for automated trading. It considers a group of indicators including Ichimoku Cloud, HMA, RSI, Stoch, CCI and MACD. Each indicator result is scored and the overall score is calculated by averaging all indicators' scores. When the overall score is above threshold, go long. When below threshold, go short.
Strategy Logic
The strategy consists of several parts:
-
Calculate a group of indicators including Ichimoku Cloud, Hull Moving Average, Relative Strength Index, Stochastic, Commodity Channel Index and Moving Average Convergence Divergence.
-
Score each indicator. Give positive score for bullish signal and negative score for bearish signal.
-
Sum and average all indicators' scores to get an overall score.
-
Compare overall score with preset threshold to determine overall trend direction. Go long when score is higher than threshold, short when lower.
-
Open position based on judgment. Long when bullish, short when bearish.
-
Set stop loss and take profit based on ATR.
The strategy makes full use of advantages of multiple indicators to determine market trend. Compared with single indicator, it helps filter out some false signals and increase reliability.
Advantage Analysis
The advantages of this strategy include:
-
Multiple indicators combined improve signal accuracy. Single indicator is prone to false signals. Scoring and averaging helps filter out false signals effectively.
-
Utilize indicators' strengths to identify trend and momentum. For example, Ichimoku Cloud for trend, Stochastics for overbought and oversold.
-
Automated trading avoids emotional impacts and strictly follows strategy signals.
-
Use ATR for stop loss and take profit helps risk management.
-
Parameters and score threshold can be optimized for different products.
-
Simple and clear logic, easy to understand and modify.
Risk Analysis
The risks of this strategy:
-
Multiple indicators combined is not necessarily better than single one. Need repetitive tests to find optimal parameters.
-
Averaging scores cannot completely avoid losses when indicators give wrong signals.
-
ATR stops may be too close or too loose. Need adjustments based on product character.
-
Avoid overfitting from excessive optimizations. Test robustness on different products and time periods.
-
High trading frequency increases transaction costs which also affect end return.
Optimization Directions
The strategy can be optimized in the following aspects:
-
Test more indicator combinations to find optimal selection for specific product.
-
Adjust indicator score weights, optimize scoring algorithm.
-
Dynamic ATR parameters to better fit market volatility.
-
Add trade filters to reduce unnecessary trading frequency, such as trend filter or volume filter.
-
Stepwise optimize to find parameter range, then random/grid optimize for best parameter set.
-
Test robustness on multiple products and timeframes to avoid overfitting.
-
Combine with other effective trading strategies for portfolio.
Conclusion
The multi indicator scoring strategy improves signal accuracy and reliability through averaging indicator scores. With large optimization space, it can be optimized for good results on different products. Overfitting risks need attention to keep parameter optimization and strategy testing scientific. As a strategy idea with broad optimization directions, it deserves further research and application.
[/trans]
Strategy Arguments
| Argument | Default | Description |
|---|---|---|
| v_input_1 | Indicator Timeframe | |
| v_input_2 | 14 | Period Length |
| v_input_3 | 1.1 | Minimum Signal Strength |
| v_input_4_open | 0 | Price Source: open |
| v_input_5 | false | Use ONLY BUY mode |
| v_input_6 | false | Use ONLY SELL mode |
| v_input_7 | true | Use ATR for TP & SL |
| v_input_8 | true | Use Ichimoku |
| v_input_9 | true | Use Hull MA |
| v_input_10 | true | Use RSI |
| v_input_11 | true | Use Stoch |
| v_input_12 | true | Use CCI |
| v_input_13 | true | Use MacD |
Source (PineScript)
/*backtest
start: 2022-10-31 00:00:00
end: 2023-11-06 00:00:00
period: 1d
basePeriod: 1h
exchanges: [{"eid":"Futures_Binance","currency":"BTC_USDT"}]
*/

//@version=4
strategy(title="Ichi HMA RSI Stoch CCI MACD Technicals Rating Strategy",shorttitle="TRSv420",overlay=true,default_qty_type=strategy.percent_of_equity,default_qty_value=50,commission_type=strategy.commission.percent,commission_value=0.05)
res = input("", title="Indicator Timeframe", type=input.resolution)
Period = input(defval = 14, title = "Period Length", minval = 2)
MinSignalStrength= input(title="Minimum Signal Strength", type=input.float, defval=1.1, minval=0.00, maxval=2.00, step=0.1)
Price = input(defval=open, title="Price Source", type=input.source)
Use_Only_Buy= input(false, title = "Use ONLY BUY mode",type=input.bool)
Use_Only_Sell= input(false, title = "Use ONLY SELL mode",type=input.bool)
Use_ATR_SL_TP= input(true, title = "Use ATR for TP & SL",type=input.bool)
Use_Ichimoku= input(true, title = "Use Ichimoku",type=input.bool)
Use_HMA= input(true, title = "Use Hull MA",type=input.bool)
Use_RSI= input(true, title = "Use RSI",type=input.bool)
Use_Stoch= input(true, title = "Use Stoch",type=input.bool)
Use_CCI= input(true, title = "Use CCI",type=input.bool)
Use_MACD= input(true, title = "Use MacD",type=input.bool)
// Ichimoku Cloud
donchian(len) => avg(lowest(len), highest(len))
ichimoku_cloud() =>
    conversionLine = donchian(9)
    baseLine = donchian(26)
    leadLine1 = avg(conversionLine, baseLine)
    leadLine2 = donchian(52)
    [conversionLine, baseLine, leadLine1, leadLine2]
[IC_CLine, IC_BLine, IC_Lead1, IC_Lead2] = ichimoku_cloud()
calcRatingMA(ma, src) => na(ma) or na(src) ? na : (ma == src ? 0 : ( ma < src ? 1 : -1 ))
calcRating(buy, sell) => buy ? 1 : ( sell ? -1 : 0 )
calcRatingAll() =>
    //============== HMA =================
    HMA10 = hma(Price, Period)
    HMA20 = hma(Price, 20)
    HMA30 = hma(Price, 30)
    HMA50 = hma(Price, 50)
    HMA100 = hma(Price, 100)
    HMA200 = hma(Price, 200)
    // Relative Strength Index, RSI
    RSI = rsi(Price,14)
    // Stochastic
    lengthStoch = 14
    smoothKStoch = 3
    smoothDStoch = 3
    kStoch = sma(stoch(Price, high, low, lengthStoch), smoothKStoch)
    dStoch = sma(kStoch, smoothDStoch)
    // Commodity Channel Index, CCI
    CCI = cci(Price, 20)
    // Moving Average Convergence/Divergence, MACD
    [macdMACD, signalMACD, _] = macd(Price, 12, 26, 9)
    // -------------------------------------------
    PriceAvg = hma(Price, Period)
    DownTrend = Price < PriceAvg
    UpTrend = Price > PriceAvg
    float ratingMA = 0
    float ratingMAC = 0
    if(Use_HMA)
        if not na(HMA10)
            ratingMA := ratingMA + calcRatingMA(HMA10, Price)
            ratingMAC := ratingMAC + 1
        if not na(HMA20)
            ratingMA := ratingMA + calcRatingMA(HMA20, Price)
            ratingMAC := ratingMAC + 1
        if not na(HMA30)
            ratingMA := ratingMA + calcRatingMA(HMA30, Price)
            ratingMAC := ratingMAC + 1
        if not na(HMA50)
            ratingMA := ratingMA + calcRatingMA(HMA50, Price)
            ratingMAC := ratingMAC + 1
        if not na(HMA100)
            ratingMA := ratingMA + calcRatingMA(HMA100, Price)
            ratingMAC := ratingMAC + 1
        if not na(HMA200)
            ratingMA := ratingMA + calcRatingMA(HMA200, Price)
            ratingMAC := ratingMAC + 1
    if(Use_Ichimoku)
        float ratingIC = na
        if not (na(IC_Lead1) or na(IC_Lead2) or na(Price) or na(Price[1]) or na(IC_BLine) or na(IC_CLine))
            ratingIC := calcRating(
             IC_Lead1 > IC_Lead2 and Price > IC_Lead1 and Price < IC_BLine and Price[1] < IC_CLine and Price > IC_CLine,
             IC_Lead2 > IC_Lead1 and Price < IC_Lead2 and Price > IC_BLine and Price[1] > IC_CLine and Price < IC_CLine)
        if not na(ratingIC)
            ratingMA := ratingMA + ratingIC
            ratingMAC := ratingMAC + 1
    ratingMA := ratingMAC > 0 ? ratingMA / ratingMAC : na
    float ratingOther = 0
    float ratingOtherC = 0
    if(Use_RSI)
        ratingRSI = RSI
        if not(na(ratingRSI) or na(ratingRSI[1]))
            ratingOtherC := ratingOtherC + 1
            ratingOther := ratingOther + calcRating(ratingRSI < 30 and ratingRSI[1] < ratingRSI, ratingRSI > 70 and ratingRSI[1] > ratingRSI)
    if(Use_Stoch)
        if not(na(kStoch) or na(dStoch) or na(kStoch[1]) or na(dStoch[1]))
            ratingOtherC := ratingOtherC + 1
            ratingOther := ratingOther + calcRating(kStoch < 20 and dStoch < 20 and kStoch > dStoch and kStoch[1] < dStoch[1], kStoch > 80 and dStoch > 80 and kStoch < dStoch and kStoch[1] > dStoch[1])
    if(Use_CCI)
        ratingCCI = CCI
        if not(na(ratingCCI) or na(ratingCCI[1]))
            ratingOtherC := ratingOtherC + 1
            ratingOther := ratingOther + calcRating(ratingCCI < -100 and ratingCCI > ratingCCI[1], ratingCCI > 100 and ratingCCI < ratingCCI[1])
    if(Use_MACD)
        if not(na(macdMACD) or na(signalMACD))
            ratingOtherC := ratingOtherC + 1
            ratingOther := ratingOther + calcRating(macdMACD > signalMACD, macdMACD < signalMACD)
    ratingOther := ratingOtherC > 0 ? ratingOther / ratingOtherC : na
    float ratingTotal = 0
    float ratingTotalC = 0
    if not na(ratingMA)
        ratingTotal := ratingTotal + ratingMA
        ratingTotalC := ratingTotalC + 1
        ratingTotal := ratingTotal + ratingOther
        ratingTotalC := ratingTotalC + 1
    ratingTotal := ratingTotalC > 0 ? ratingTotal / ratingTotalC : na
    [ratingTotal, ratingOther, ratingMA, ratingOtherC, ratingMAC]
[ratingTotal, ratingOther, ratingMA, ratingOtherC, ratingMAC]  = security(syminfo.tickerid, res, calcRatingAll(), lookahead=false)
tradeSignal = ratingTotal+ratingOther+ratingMA
dynSLpoints(factor) => factor * atr(14) / syminfo.mintick
if not (Use_Only_Sell)
    strategy.entry("long", strategy.long, when = tradeSignal > MinSignalStrength)
if not (Use_Only_Buy)
    strategy.entry("short", strategy.short, when = tradeSignal < -MinSignalStrength)
if(Use_ATR_SL_TP)
    strategy.exit("sl/tp", loss = dynSLpoints(3), trail_points = dynSLpoints(5), trail_offset = dynSLpoints(2))
Detail
https://www.fmz.com/strategy/431409
Last Modified
2023-11-07 16:16:45