
191 lines
7.6 KiB
Markdown
191 lines
7.6 KiB
Markdown
|
||
> Name
|
||
|
||
多指标组合动态交易优化策略-Multi-Indicator-Dynamic-Trading-Optimization-Strategy
|
||
|
||
> Author
|
||
|
||
ChaoZhang
|
||
|
||
> Strategy Description
|
||
|
||
|
||
|
||
[trans]
|
||
#### 概述
|
||
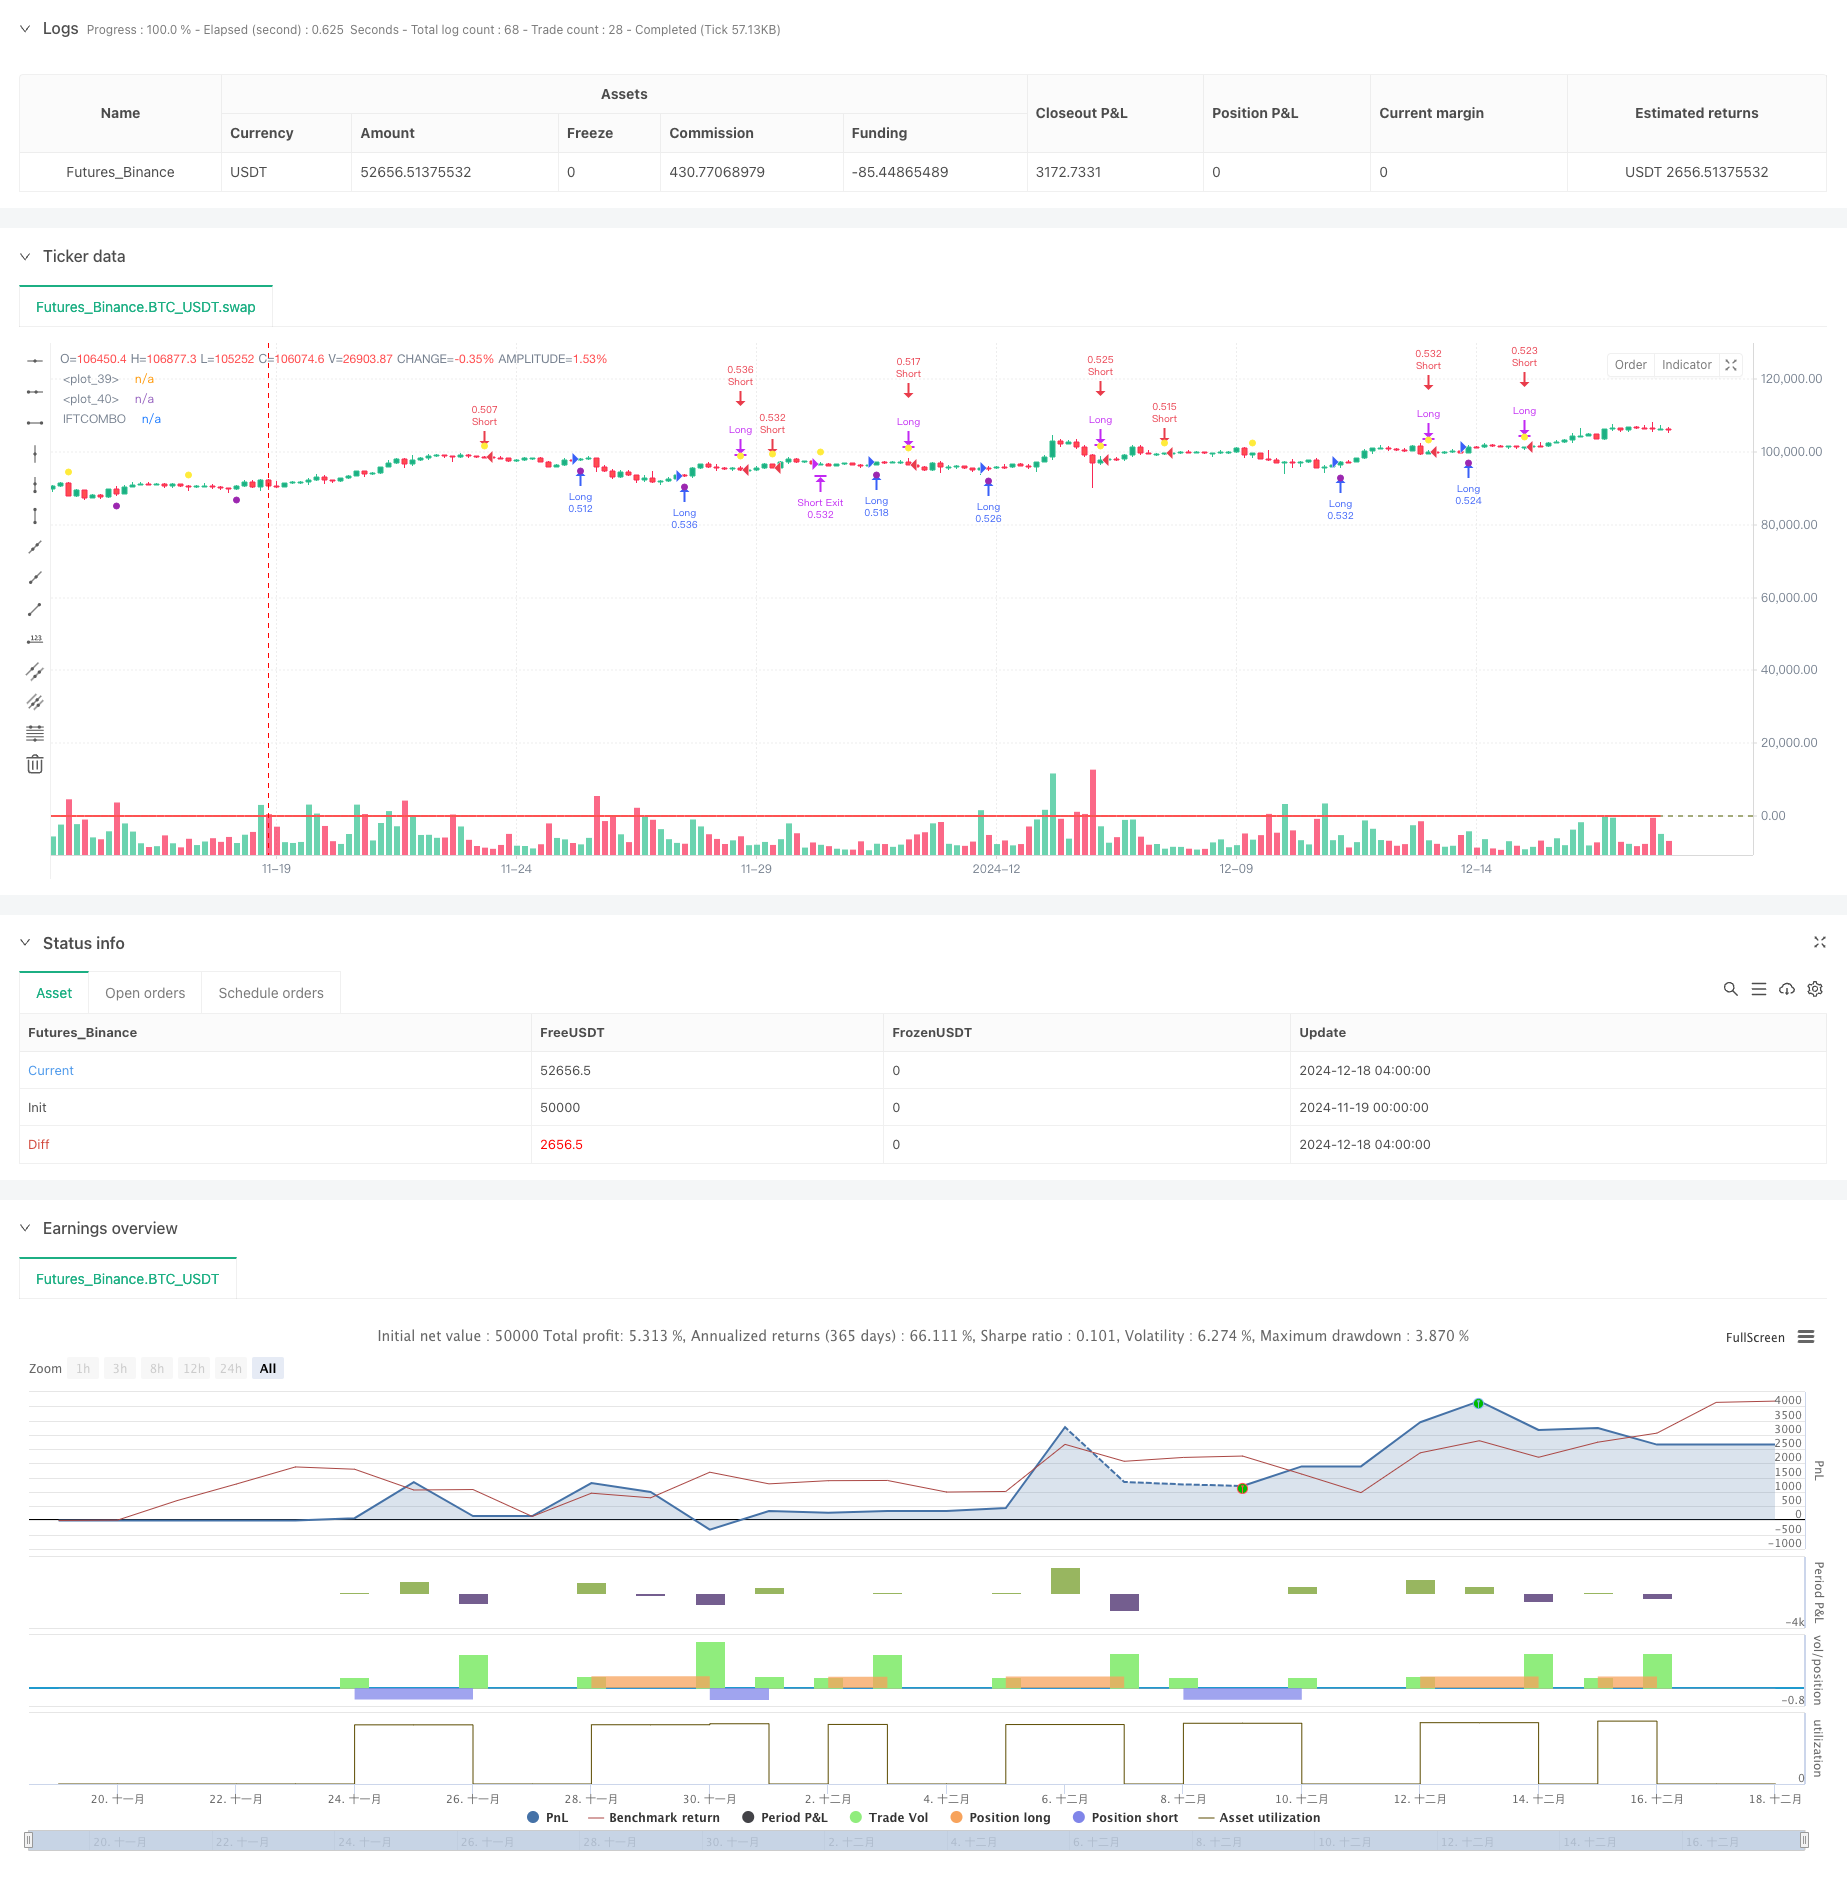
该策略是一个基于多个技术指标组合的交易系统,通过整合CCI、RSI、随机指标(Stochastic)和MFI等四个主要指标,并结合指数平滑处理,构建了一个全面的市场分析框架。策略采用IFT(Inverse Fisher Transform)转换来规范化指标输出,最终通过信号综合产生交易决策。
|
||
|
||
#### 策略原理
|
||
策略的核心是通过多指标融合来提供更可靠的交易信号。首先对各个指标进行标准化处理和WMA平滑,然后通过IFT转换将指标值映射到[-1,1]区间。具体包括:
|
||
1. 对CCI、RSI、Stochastic和MFI四个指标分别进行计算和归一化
|
||
2. 使用WMA对指标值进行平滑处理
|
||
3. 通过IFT转换将指标值转换到统一区间
|
||
4. 计算四个转换后指标的平均值作为最终信号
|
||
5. 当信号线突破-0.5时产生做多信号,突破0.5时产生做空信号
|
||
6. 设置0.5%止损和1%止盈来控制风险
|
||
|
||
#### 策略优势
|
||
1. 多指标融合提供了更全面的市场视角,降低了单一指标的局限性
|
||
2. IFT转换确保了指标输出的一致性,便于信号合成
|
||
3. WMA平滑处理有效降低了假信号
|
||
4. 设置了合理的止损止盈,控制风险的同时保证盈利空间
|
||
5. 信号生成机制清晰,便于调试和优化
|
||
|
||
#### 策略风险
|
||
1. 多指标可能在剧烈波动市场中产生滞后
|
||
2. 固定的止损止盈参数可能不适应所有市场环境
|
||
3. WMA平滑可能导致信号延迟
|
||
4. 指标参数需要针对不同市场进行优化
|
||
建议:动态调整止损止盈参数,引入波动率指标,优化平滑参数
|
||
|
||
#### 策略优化方向
|
||
1. 引入自适应的止损止盈机制,根据市场波动动态调整
|
||
2. 添加市场环境过滤机制,在不同趋势强度下使用不同参数
|
||
3. 优化信号合成方式,可考虑加权平均替代简单平均
|
||
4. 引入成交量加权和波动率调整机制
|
||
5. 开发指标参数的自动优化系统
|
||
|
||
#### 总结
|
||
该策略通过多指标融合和信号优化,构建了一个相对完整的交易系统。策略的优势在于信号的可靠性和风险控制的完整性,但仍需要在实际应用中根据市场特征进行参数优化。通过建议的优化方向,策略有望在不同市场环境下获得更好的表现。 ||
|
||
|
||
#### Overview
|
||
This strategy is a trading system based on multiple technical indicators, integrating CCI, RSI, Stochastic, and MFI indicators with exponential smoothing to build a comprehensive market analysis framework. The strategy uses IFT (Inverse Fisher Transform) to normalize indicator outputs and generates trading decisions through signal synthesis.
|
||
|
||
#### Strategy Principle
|
||
The core of the strategy is to provide more reliable trading signals through multi-indicator fusion. The process includes:
|
||
1. Calculate and normalize CCI, RSI, Stochastic, and MFI indicators
|
||
2. Apply WMA smoothing to indicator values
|
||
3. Transform values to a unified interval using IFT
|
||
4. Calculate the average of four transformed indicators as final signal
|
||
5. Generate long signals when crossing -0.5 and short signals when crossing 0.5
|
||
6. Set 0.5% stop-loss and 1% take-profit for risk control
|
||
|
||
#### Strategy Advantages
|
||
1. Multi-indicator fusion provides comprehensive market perspective
|
||
2. IFT transformation ensures consistency in indicator outputs
|
||
3. WMA smoothing effectively reduces false signals
|
||
4. Reasonable stop-loss and take-profit settings
|
||
5. Clear signal generation mechanism for debugging and optimization
|
||
|
||
#### Strategy Risks
|
||
1. Multiple indicators may lag in volatile markets
|
||
2. Fixed stop-loss and take-profit parameters may not suit all market conditions
|
||
3. WMA smoothing might cause signal delays
|
||
4. Indicator parameters need optimization for different markets
|
||
Suggestions: Implement dynamic risk management, introduce volatility indicators, optimize smoothing parameters
|
||
|
||
#### Optimization Directions
|
||
1. Introduce adaptive stop-loss and take-profit mechanisms
|
||
2. Add market environment filtering
|
||
3. Optimize signal synthesis with weighted averaging
|
||
4. Implement volume-weighted and volatility-adjusted mechanisms
|
||
5. Develop automatic parameter optimization system
|
||
|
||
#### Summary
|
||
The strategy builds a relatively complete trading system through multi-indicator fusion and signal optimization. Its strengths lie in signal reliability and comprehensive risk control, but parameters still need optimization based on market characteristics. Through the suggested optimization directions, the strategy has the potential to perform better in various market environments.[/trans]
|
||
|
||
|
||
|
||
> Source (PineScript)
|
||
|
||
``` pinescript
|
||
/*backtest
|
||
start: 2024-11-19 00:00:00
|
||
end: 2024-12-18 08:00:00
|
||
period: 4h
|
||
basePeriod: 4h
|
||
exchanges: [{"eid":"Futures_Binance","currency":"BTC_USDT"}]
|
||
*/
|
||
|
||
//@version=5
|
||
strategy('wombocombo', overlay=true, default_qty_type=strategy.percent_of_equity, default_qty_value=100)
|
||
|
||
// IFTCOMBO Hesaplamaları
|
||
ccilength = input.int(5, 'CCI Length')
|
||
wmalength = input.int(9, 'Smoothing Length')
|
||
rsilength = input.int(5, 'RSI Length')
|
||
stochlength = input.int(5, 'STOCH Length')
|
||
mfilength = input.int(5, 'MFI Length')
|
||
|
||
// CCI
|
||
v11 = 0.1 * (ta.cci(close, ccilength) / 4)
|
||
v21 = ta.wma(v11, wmalength)
|
||
INV1 = (math.exp(2 * v21) - 1) / (math.exp(2 * v21) + 1)
|
||
|
||
// RSI
|
||
v12 = 0.1 * (ta.rsi(close, rsilength) - 50)
|
||
v22 = ta.wma(v12, wmalength)
|
||
INV2 = (math.exp(2 * v22) - 1) / (math.exp(2 * v22) + 1)
|
||
|
||
// Stochastic
|
||
v1 = 0.1 * (ta.stoch(close, high, low, stochlength) - 50)
|
||
v2 = ta.wma(v1, wmalength)
|
||
INVLine = (math.exp(2 * v2) - 1) / (math.exp(2 * v2) + 1)
|
||
|
||
// MFI
|
||
source = hlc3
|
||
up = math.sum(volume * (ta.change(source) <= 0 ? 0 : source), mfilength)
|
||
lo = math.sum(volume * (ta.change(source) >= 0 ? 0 : source), mfilength)
|
||
mfi = 100.0 - 100.0 / (1.0 + up / lo)
|
||
v13 = 0.1 * (mfi - 50)
|
||
v23 = ta.wma(v13, wmalength)
|
||
INV3 = (math.exp(2 * v23) - 1) / (math.exp(2 * v23) + 1)
|
||
|
||
// Ortalama IFTCOMBO değeri
|
||
AVINV = (INV1 + INV2 + INVLine + INV3) / 4
|
||
|
||
// Sinyal çizgileri
|
||
hline(0.5, color=color.red, linestyle=hline.style_dashed)
|
||
hline(-0.5, color=color.green, linestyle=hline.style_dashed)
|
||
|
||
// IFTCOMBO çizgisi
|
||
plot(AVINV, color=color.red, linewidth=2, title='IFTCOMBO')
|
||
|
||
// Long Trading Sinyalleri
|
||
longCondition = ta.crossover(AVINV, -0.5)
|
||
longCloseCondition = ta.crossunder(AVINV, 0.5)
|
||
|
||
// Short Trading Sinyalleri
|
||
shortCondition = ta.crossunder(AVINV, 0.5)
|
||
shortCloseCondition = ta.crossover(AVINV, -0.5)
|
||
|
||
// Stop-loss seviyesi (%0.5 kayıp)
|
||
stopLoss = strategy.position_avg_price * (1 - 0.005) // Long için
|
||
takeProfit = strategy.position_avg_price * (1 + 0.01) // Long için
|
||
|
||
|
||
// Long Strateji Kuralları
|
||
if longCondition
|
||
strategy.entry('Long', strategy.long)
|
||
strategy.exit('Long Exit', 'Long', stop=stopLoss, limit=takeProfit) // Stop-loss eklendi
|
||
|
||
|
||
if longCloseCondition
|
||
strategy.close('Long')
|
||
|
||
// Stop-loss seviyesi (%0.5 kayıp)
|
||
stopLossShort = strategy.position_avg_price * (1 + 0.005) // Short için
|
||
takeProfitShort = strategy.position_avg_price * (1 - 0.01) // Short için
|
||
|
||
// Short Strateji Kuralları
|
||
if shortCondition
|
||
strategy.entry('Short', strategy.short)
|
||
strategy.exit('Short Exit', 'Short', stop=stopLossShort, limit=takeProfitShort) // Stop-loss eklendi
|
||
|
||
|
||
if shortCloseCondition
|
||
strategy.close('Short')
|
||
|
||
// Sinyal noktalarını plotlama
|
||
plotshape(longCondition, title='Long Signal', location=location.belowbar, color=color.purple, size=size.small)
|
||
plotshape(shortCondition, title='Short Signal', location=location.abovebar, color=color.yellow, size=size.small)
|
||
```
|
||
|
||
> Detail
|
||
|
||
https://www.fmz.com/strategy/475626
|
||
|
||
> Last Modified
|
||
|
||
2024-12-20 16:31:21
|