
216 lines
8.4 KiB
Markdown
216 lines
8.4 KiB
Markdown
|
|
> Name
|
|
|
|
多指标动量突破结合平滑K线交易策略-Multi-Indicator-Momentum-Breakout-with-Smoothed-Candlestick-Trading-Strategy
|
|
|
|
> Author
|
|
|
|
ChaoZhang
|
|
|
|
> Strategy Description
|
|
|
|
|
|
|
|
[trans]
|
|
#### 概述
|
|
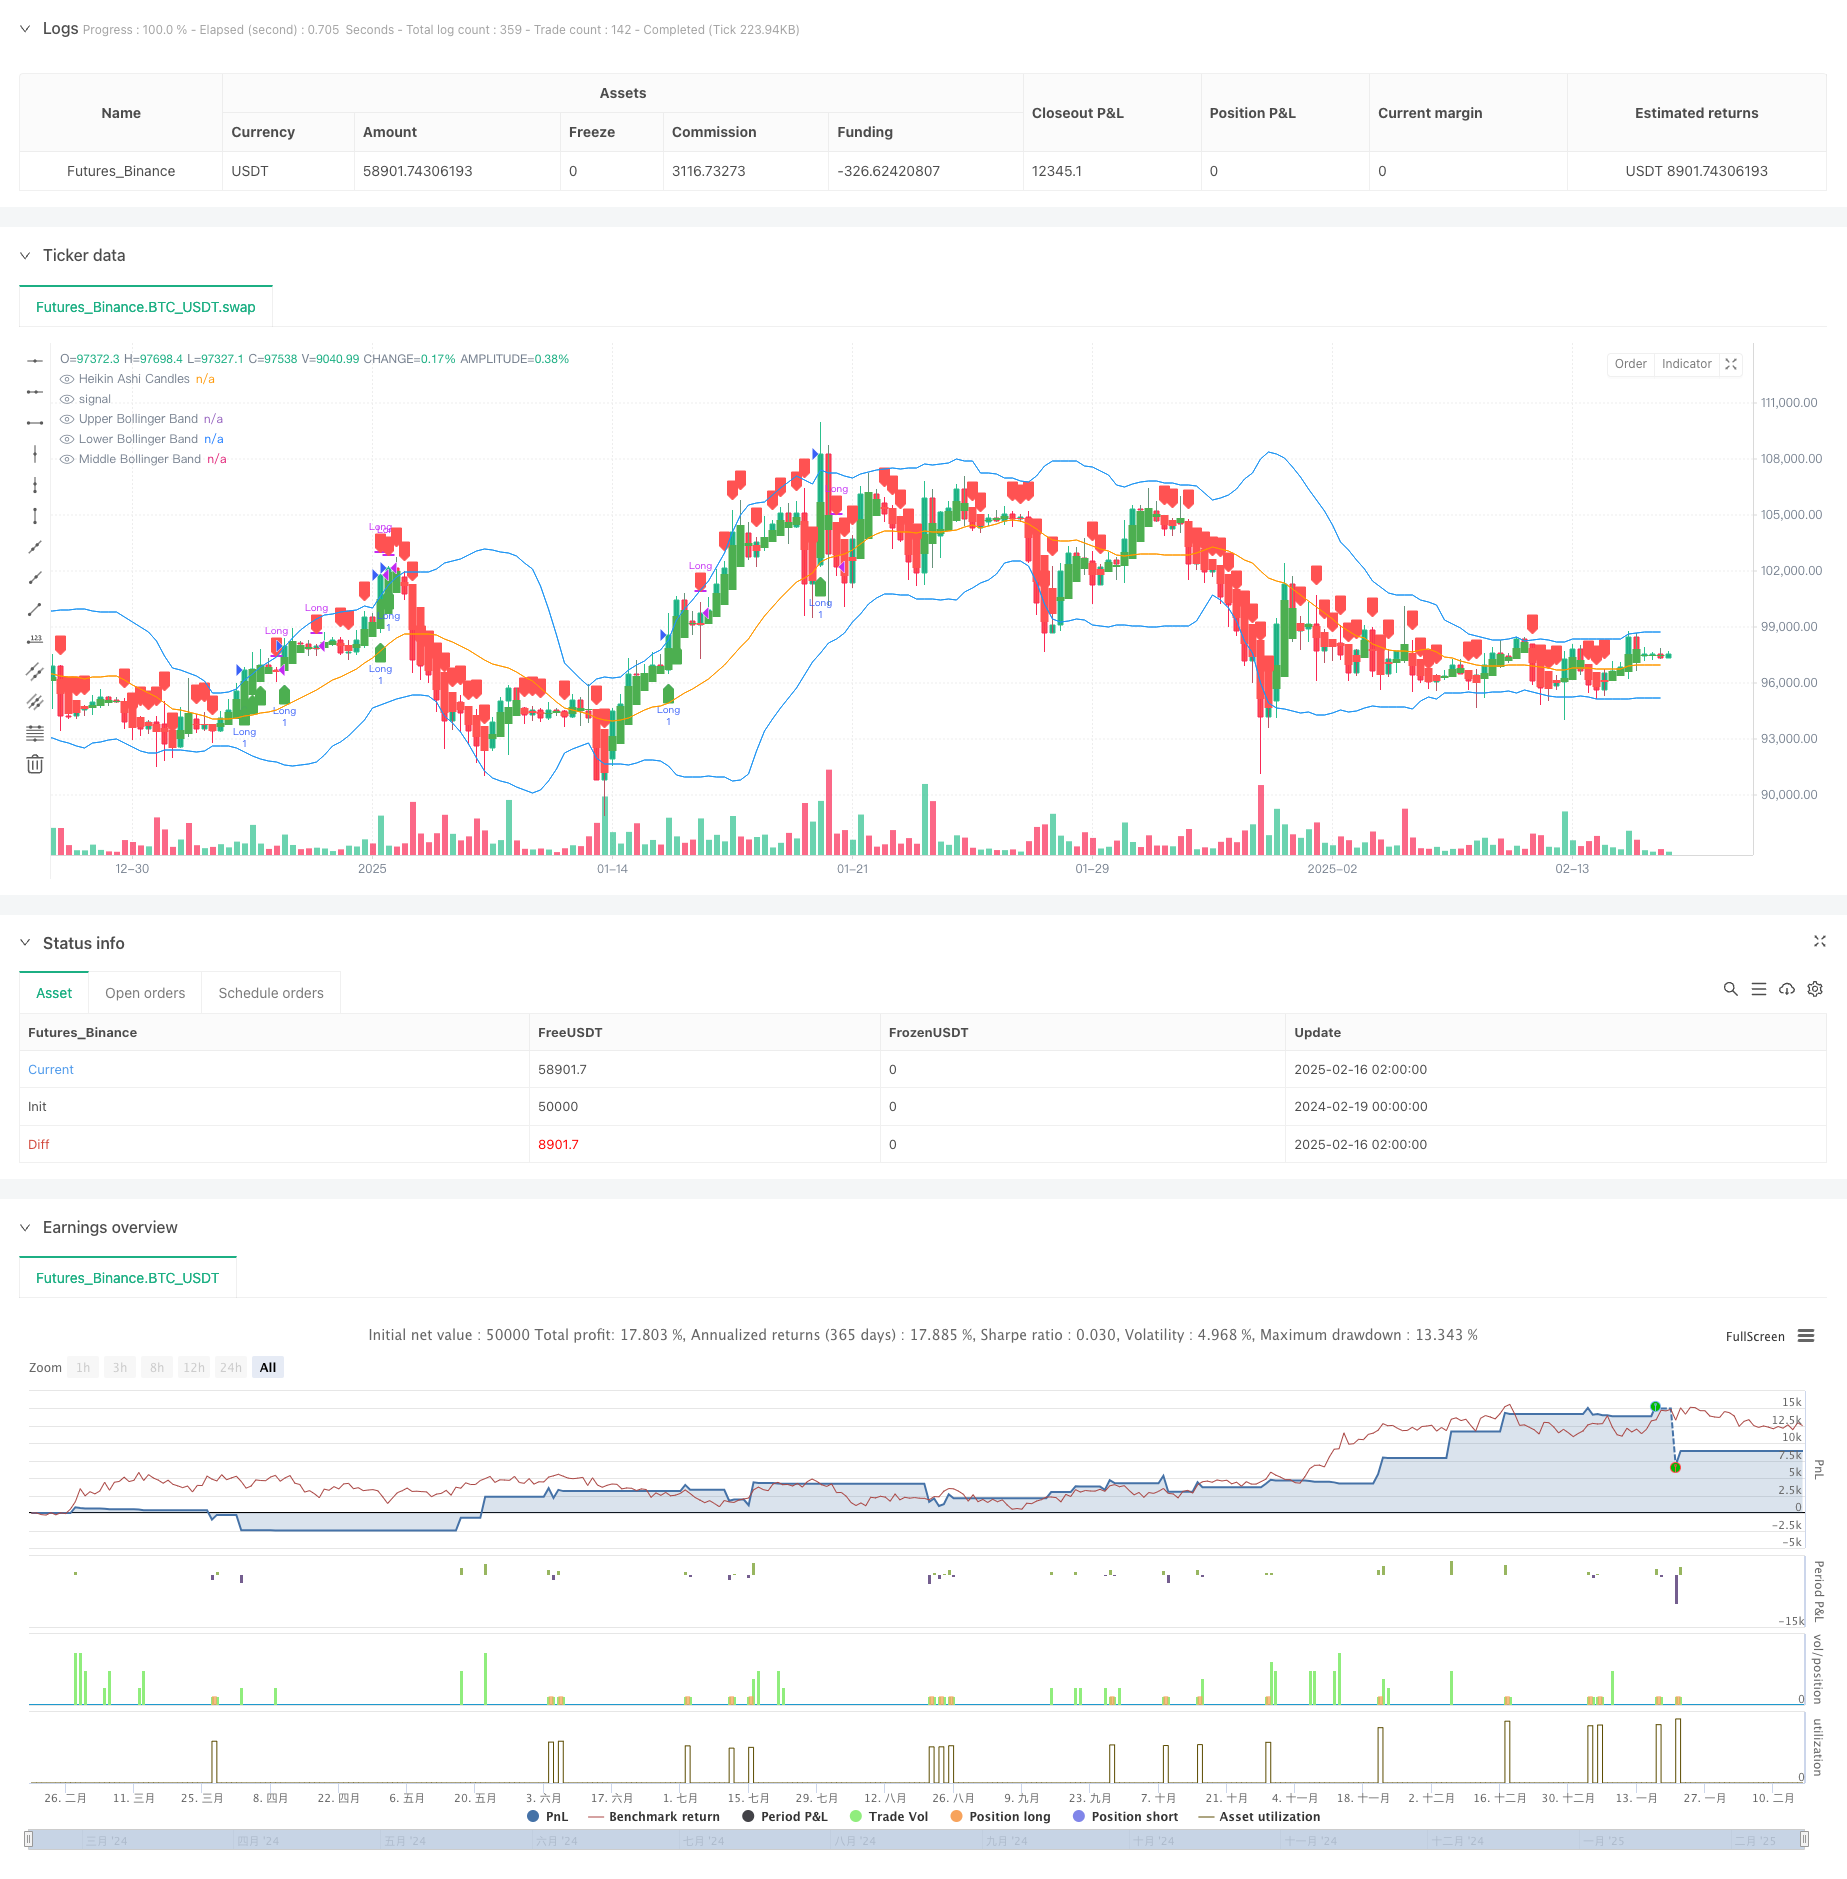
该策略是一个结合布林带(Bollinger Bands)、相对强弱指标(RSI)和平滑K线(Heikin Ashi)的突破交易系统。通过多重技术指标的配合使用,有效过滤市场噪音,捕捉高概率的突破交易机会。策略采用趋势跟踪和动量交易的理念,在突破确认后入场,通过平滑K线的反转和RSI超买作为退出信号。
|
|
|
|
#### 策略原理
|
|
策略的核心逻辑基于以下三个技术指标的协同:
|
|
1. 布林带用于识别价格波动范围和潜在突破位置,由20日均线作为中轨,上下轨距离中轨2个标准差。
|
|
2. RSI指标用于确认价格动量,采用14周期设置,RSI大于50表示上升动量。
|
|
3. 平滑K线通过计算开盘价、最高价、最低价和收盘价的加权平均,过滤短期价格波动。
|
|
|
|
入场条件需同时满足:
|
|
- 平滑K线由红转绿
|
|
- 收盘价突破布林带上轨
|
|
- RSI大于50
|
|
|
|
退出条件满足以下任一:
|
|
- 平滑K线由绿转红
|
|
- RSI达到70的超买水平
|
|
|
|
#### 策略优势
|
|
1. 多重技术指标的配合使用提高了交易信号的可靠性
|
|
2. 平滑K线有效降低了假突破的影响
|
|
3. RSI指标的加入确保在趋势方向做多
|
|
4. 清晰的入场和退出机制,避免主观判断
|
|
5. 策略逻辑简单,易于理解和执行
|
|
6. 参数可根据不同市场特征灵活调整
|
|
|
|
#### 策略风险
|
|
1. 在震荡市场可能产生频繁的假信号
|
|
2. 入场条件较为严格,可能错过部分交易机会
|
|
3. 依赖技术指标可能在市场环境急剧变化时失效
|
|
4. 未考虑基本面因素对市场的影响
|
|
5. 退出机制可能导致错过更大的利润空间
|
|
|
|
风险控制建议:
|
|
- 设置止损位置保护资金安全
|
|
- 根据市场波动调整布林带参数
|
|
- 结合更多市场分析维度
|
|
- 严格执行交易计划
|
|
|
|
#### 策略优化方向
|
|
1. 引入自适应参数:
|
|
- 根据市场波动率动态调整布林带乘数
|
|
- 基于市场环境优化RSI参数
|
|
|
|
2. 增加过滤条件:
|
|
- 加入成交量确认
|
|
- 考虑更长期均线趋势
|
|
- 纳入市场波动率指标
|
|
|
|
3. 完善止损机制:
|
|
- 设计移动止损
|
|
- 增加盈亏比控制
|
|
- 优化仓位管理方案
|
|
|
|
4. 增强信号系统:
|
|
- 开发信号强度评分
|
|
- 设计信号确认机制
|
|
- 优化出场时机判断
|
|
|
|
#### 总结
|
|
该策略通过布林带、RSI和平滑K线的组合应用,构建了一个相对完整的趋势跟踪交易系统。策略逻辑清晰,执行标准明确,具有较好的实用性。通过优化参数设置和增加辅助指标,策略的稳定性和可靠性有望进一步提升。建议交易者在实盘应用前进行充分的回测验证,并结合市场特征和个人风险偏好做出适当调整。 ||
|
|
|
|
#### Overview
|
|
This strategy is a breakout trading system that combines Bollinger Bands, Relative Strength Index (RSI), and Heikin Ashi candlesticks. Through the coordinated use of multiple technical indicators, it effectively filters market noise and captures high-probability breakout trading opportunities. The strategy adopts trend-following and momentum trading concepts, entering after breakout confirmation and using Heikin Ashi reversal and RSI overbought conditions as exit signals.
|
|
|
|
#### Strategy Principles
|
|
The core logic is based on the synergy of three technical indicators:
|
|
1. Bollinger Bands identify price volatility range and potential breakout positions, using 20-day moving average as the middle band, with upper and lower bands 2 standard deviations away.
|
|
2. RSI confirms price momentum, using 14-period settings, with RSI above 50 indicating upward momentum.
|
|
3. Heikin Ashi candlesticks filter short-term price fluctuations through weighted averages of open, high, low, and close prices.
|
|
|
|
Entry conditions require:
|
|
- Heikin Ashi candles turn from red to green
|
|
- Close price breaks above upper Bollinger Band
|
|
- RSI above 50
|
|
|
|
Exit conditions meet either:
|
|
- Heikin Ashi candles turn from green to red
|
|
- RSI reaches overbought level of 70
|
|
|
|
#### Strategy Advantages
|
|
1. Multiple technical indicators enhance trading signal reliability
|
|
2. Heikin Ashi candlesticks effectively reduce false breakouts
|
|
3. RSI inclusion ensures trading with trend direction
|
|
4. Clear entry and exit mechanisms avoid subjective judgment
|
|
5. Simple strategy logic, easy to understand and execute
|
|
6. Parameters can be flexibly adjusted for different market characteristics
|
|
|
|
#### Strategy Risks
|
|
1. May generate frequent false signals in ranging markets
|
|
2. Strict entry conditions might miss some trading opportunities
|
|
3. Reliance on technical indicators may fail during rapid market changes
|
|
4. Fundamental factors not considered in market analysis
|
|
5. Exit mechanism may lead to missed profit potential
|
|
|
|
Risk control suggestions:
|
|
- Set stop-loss positions to protect capital
|
|
- Adjust Bollinger Bands parameters based on market volatility
|
|
- Incorporate additional market analysis dimensions
|
|
- Strictly execute trading plan
|
|
|
|
#### Strategy Optimization Directions
|
|
1. Introduce adaptive parameters:
|
|
- Dynamically adjust Bollinger Bands multiplier based on market volatility
|
|
- Optimize RSI parameters based on market conditions
|
|
|
|
2. Add filtering conditions:
|
|
- Include volume confirmation
|
|
- Consider longer-term moving average trends
|
|
- Incorporate market volatility indicators
|
|
|
|
3. Improve stop-loss mechanism:
|
|
- Design trailing stop-loss
|
|
- Add risk-reward ratio control
|
|
- Optimize position management plan
|
|
|
|
4. Enhance signal system:
|
|
- Develop signal strength scoring
|
|
- Design signal confirmation mechanism
|
|
- Optimize exit timing determination
|
|
|
|
#### Summary
|
|
This strategy constructs a relatively complete trend-following trading system through the combined application of Bollinger Bands, RSI, and Heikin Ashi candlesticks. The strategy logic is clear with explicit execution standards, demonstrating good practicality. Through parameter optimization and additional auxiliary indicators, the strategy's stability and reliability can be further improved. Traders are advised to conduct thorough backtesting before live implementation and make appropriate adjustments based on market characteristics and personal risk preferences.[/trans]
|
|
|
|
|
|
|
|
> Source (PineScript)
|
|
|
|
``` pinescript
|
|
/*backtest
|
|
start: 2024-02-19 00:00:00
|
|
end: 2025-02-16 08:00:00
|
|
period: 6h
|
|
basePeriod: 6h
|
|
exchanges: [{"eid":"Futures_Binance","currency":"BTC_USDT"}]
|
|
*/
|
|
|
|
//@version=6
|
|
strategy("Bollinger Bands + RSI + Heikin Ashi Breakout", overlay=true)
|
|
|
|
// Input Settings
|
|
bbLength = input.int(20, title="Bollinger Bands Length")
|
|
bbMultiplier = input.float(2, title="Bollinger Bands Multiplier")
|
|
rsiLength = input.int(14, title="RSI Length")
|
|
rsiOverbought = input.float(70, title="RSI Overbought Level")
|
|
|
|
// Bollinger Bands
|
|
basis = ta.sma(close, bbLength)
|
|
dev = bbMultiplier * ta.stdev(close, bbLength)
|
|
upperBB = basis + dev
|
|
lowerBB = basis - dev
|
|
|
|
// Heikin Ashi Candle Calculations
|
|
var float heikinOpen = na // Declare `heikinOpen` with an undefined initial value
|
|
var float heikinClose = na // Declare `heikinClose` with an undefined initial value
|
|
|
|
// Update Heikin Ashi values
|
|
heikinClose := (open + high + low + close) / 4
|
|
heikinOpen := na(heikinOpen[1]) ? (open + close) / 2 : (heikinOpen[1] + heikinClose[1]) / 2
|
|
heikinHigh = math.max(high, math.max(heikinOpen, heikinClose))
|
|
heikinLow = math.min(low, math.min(heikinOpen, heikinClose))
|
|
|
|
// RSI
|
|
rsi = ta.rsi(close, rsiLength)
|
|
|
|
// Entry Conditions
|
|
heikinGreen = heikinClose > heikinOpen
|
|
longCondition = heikinGreen and close > upperBB and rsi > 50
|
|
|
|
// Exit Conditions
|
|
heikinRed = heikinClose < heikinOpen
|
|
longExitCondition = heikinRed or rsi >= rsiOverbought
|
|
|
|
// Strategy Execution
|
|
if (longCondition)
|
|
strategy.entry("Long", strategy.long)
|
|
|
|
if (longExitCondition)
|
|
strategy.close("Long", comment="Exit Long")
|
|
|
|
// Plotting Bollinger Bands
|
|
plot(upperBB, color=color.blue, title="Upper Bollinger Band")
|
|
plot(lowerBB, color=color.blue, title="Lower Bollinger Band")
|
|
plot(basis, color=color.orange, title="Middle Bollinger Band")
|
|
|
|
// Heikin Ashi Visualization
|
|
plotcandle(heikinOpen, heikinHigh, heikinLow, heikinClose, color=(heikinGreen ? color.green : color.red), title="Heikin Ashi Candles")
|
|
|
|
// Debugging Signals
|
|
plotshape(longCondition, style=shape.labelup, location=location.belowbar, color=color.green, title="Long Entry Signal")
|
|
plotshape(longExitCondition, style=shape.labeldown, location=location.abovebar, color=color.red, title="Long Exit Signal")
|
|
|
|
```
|
|
|
|
> Detail
|
|
|
|
https://www.fmz.com/strategy/482472
|
|
|
|
> Last Modified
|
|
|
|
2025-02-18 15:38:21
|