
300 lines
18 KiB
Markdown
300 lines
18 KiB
Markdown
|
|
> Name
|
|
|
|
多指标动态自适应量化交易策略-Multi-Indicator-Dynamic-Adaptive-Quantitative-Trading-Strategy
|
|
|
|
> Author
|
|
|
|
ianzeng123
|
|
|
|
> Strategy Description
|
|
|
|
|
|
|
|
|
|
|
|
|
|
|
|
[trans]
|
|
|
|
## 概述
|
|
|
|
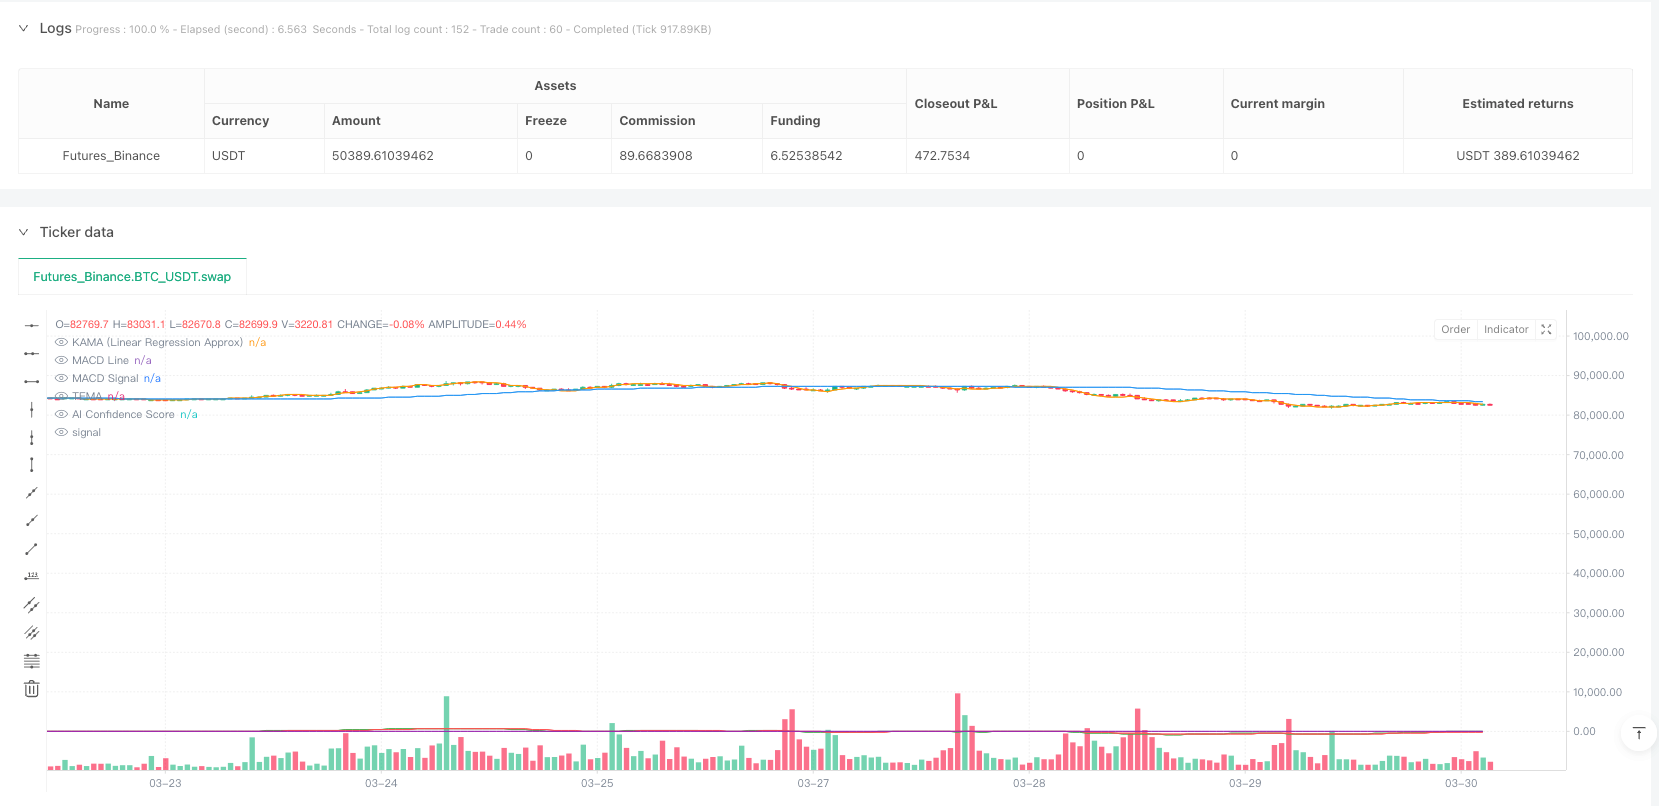
这个交易策略是一种结合了多重技术指标和人工智能辅助信号过滤的综合量化交易系统。该策略利用三重指数移动平均线(TEMA)、考夫曼自适应移动平均线(KAMA)、MACD、相对强弱指数(RSI)、平均真实波幅(ATR)和成交量分析来识别潜在的入场和出场点。通过AI信号过滤机制,该策略能够筛选出高可信度的交易信号,并使用动态的风险管理技术设置止损和止盈水平。
|
|
|
|
## 策略原理
|
|
|
|
该策略的核心原理建立在多指标交叉和辅助条件确认的基础上:
|
|
|
|
1. **指标计算**:
|
|
- 三重指数移动平均线(TEMA): 对价格进行三次指数平滑处理,减少滞后性
|
|
- 考夫曼自适应近似(线性回归): 使用线性回归代替传统KAMA,提供价格趋势的预测
|
|
- MACD: 计算快线、慢线及信号线,识别动量变化
|
|
- RSI: 测量价格变动的速度和幅度,识别超买超卖区域
|
|
- ATR: 衡量市场波动性,用于设置动态止损点
|
|
|
|
2. **AI信号过滤**:
|
|
策略创建了一个加权置信度分数,综合以下因素:
|
|
- MACD柱状图相对历史最高值的归一化
|
|
- RSI与中心线(50)的偏离程度
|
|
- 成交量相对于平均成交量的比率
|
|
这三个指标的平均值形成了AI信号,只有当该信号超过设定阈值时,交易才会执行。
|
|
|
|
3. **入场条件**:
|
|
多头入场要求:
|
|
- KAMA上穿TEMA(趋势转变为上升)
|
|
- MACD线在信号线之上(上升动量)
|
|
- RSI高于超卖水平(价格有反弹动能)
|
|
- 成交量高于平均成交量的特定倍数(强劲的市场参与度)
|
|
- AI置信度高于阈值(综合确认)
|
|
|
|
空头入场相反条件适用。
|
|
|
|
4. **风险管理**:
|
|
- 动态止损点基于ATR计算,适应市场波动性
|
|
- 止盈水平基于风险回报比设置,确保每笔交易的风险回报比例一致
|
|
|
|
## 策略优势
|
|
|
|
1. **多维信号确认**:
|
|
通过要求多个独立指标同时确认,该策略减少了假信号的可能性。TEMA和KAMA的交叉提供趋势方向,而MACD和RSI则分别确认动量和超买超卖状态。
|
|
|
|
2. **动态风险管理**:
|
|
使用ATR的止损设置方法适应当前市场波动性,确保止损不会因市场噪音被触发,也不会在高波动环境中过于宽松。
|
|
|
|
3. **AI增强过滤**:
|
|
虽然代码中的AI实现是模拟的,但其集成了三个关键市场面(价格动量、超买超卖和成交量异常),为传统指标增加了额外的确认层。
|
|
|
|
4. **成交量确认**:
|
|
通过要求交易发生在异常高成交量时,策略确保了进入的是有足够市场参与度的移动,这通常意味着更可靠的价格走势。
|
|
|
|
5. **灵活的参数化**:
|
|
策略提供了多个可调参数,允许交易者根据不同市场条件或个人风险偏好进行优化。
|
|
|
|
## 策略风险
|
|
|
|
1. **参数优化过拟合**:
|
|
策略包含多个参数(如TEMA长度、KAMA长度、MACD设置等),过度优化这些参数可能导致在历史数据上表现良好但在未来实时市场上表现不佳的过拟合问题。缓解方法是使用步进式优化和在多个市场条件下的稳健性测试。
|
|
|
|
2. **依赖技术指标的局限性**:
|
|
所有使用的指标本质上是滞后的,在快速变化的市场或极端行情中可能会给出不准确的信号。通过加入AI置信度分数可部分缓解此问题,但无法完全消除。
|
|
|
|
3. **复杂系统故障点增加**:
|
|
由于策略依赖多个指标和条件同时满足,可能导致交易频率降低,错过一些潜在的有利机会。在低波动或横盘市场中,这种保守方法可能导致长期无交易状态。
|
|
|
|
4. **AI模拟的局限性**:
|
|
代码中的"AI"实际上是一个简化的数学模型,并非真正的机器学习算法。它缺乏适应性学习和真正的模式识别能力,可能无法像真正的AI那样有效识别复杂的市场模式。
|
|
|
|
5. **滑点和佣金影响**:
|
|
尽管策略考虑了滑点和佣金,但在实际交易中,这些成本可能高于预期,特别是在低流动性或高波动环境下,影响策略的整体盈利能力。
|
|
|
|
## 策略优化方向
|
|
|
|
1. **真实AI集成**:
|
|
将简单的AI信号替换为真正的机器学习模型,如随机森林或神经网络。这可以通过外部训练模型实现,然后将预测结果输入到策略中,提高策略识别真实模式的能力。
|
|
|
|
2. **市场状态自适应**:
|
|
添加市场状态识别逻辑(如趋势、区间或高波动性状态),根据不同市场环境自动调整参数。例如,在区间市场中可能需要更敏感的指标设置,而在趋势市场中则需要更保守的设置。
|
|
|
|
3. **时间过滤器**:
|
|
实现时间过滤机制,避免在重大经济数据发布或市场流动性低的时段交易,减少异常波动带来的风险。
|
|
|
|
4. **改进止损策略**:
|
|
考虑实现追踪止损或基于支撑/阻力位的止损,而不仅仅依赖ATR。这能更好地保护利润和适应市场结构变化。
|
|
|
|
5. **优化仓位管理**:
|
|
当前策略使用固定百分比的资金进行每笔交易。可以实施动态仓位管理,基于市场波动性、交易信号强度和历史胜率调整仓位大小,实现更优的资金风险管理。
|
|
|
|
6. **增加过滤器**:
|
|
考虑添加趋势强度指标(如ADX)或市场结构指标(如支撑/阻力、关键价格水平)作为额外的确认层,减少在低质量设置中的交易。
|
|
|
|
## 总结
|
|
|
|
这个"多指标动态自适应量化交易策略"代表了一种精心设计的量化交易方法,通过结合传统技术分析指标和模拟的AI置信度评分,创建了一个全面的交易系统。其核心优势在于多层次的信号确认和适应市场波动的动态风险管理。
|
|
|
|
策略的基础是TEMA和KAMA的交叉,通过MACD、RSI和成交量分析进行补充确认,然后由AI置信度分数进行最终筛选。这种多层次方法有助于减少假信号,但也可能导致错过某些交易机会。
|
|
|
|
为进一步提升策略性能,建议实施真正的机器学习模型、市场状态适应性调整、优化的止损机制和动态仓位管理。这些改进可以增强策略应对不同市场环境的能力,提高长期稳定性和盈利潜力。
|
|
|
|
重要的是,任何量化策略都需要在实施前进行全面的回测和前向测试,特别关注不同市场条件下的表现,确保策略的稳健性和适应性。实际交易中,持续监控和必要的调整同样至关重要,以适应不断变化的市场动态。 ||
|
|
|
|
## Overview
|
|
|
|
This trading strategy is a comprehensive quantitative trading system that combines multiple technical indicators with AI-assisted signal filtering. The strategy utilizes Triple Exponential Moving Average (TEMA), Kaufman Adaptive Moving Average (KAMA), MACD, Relative Strength Index (RSI), Average True Range (ATR), and volume analysis to identify potential entry and exit points. Through an AI signal filtering mechanism, the strategy can screen for high-confidence trading signals and uses dynamic risk management techniques to set stop-loss and take-profit levels.
|
|
|
|
## Strategy Principle
|
|
|
|
The core principle of this strategy is built on multi-indicator crossovers and confirmatory conditions:
|
|
|
|
1. **Indicator Calculation**:
|
|
- Triple Exponential Moving Average (TEMA): Applies exponential smoothing three times to reduce lag
|
|
- Kaufman Adaptive Approximation (Linear Regression): Uses linear regression instead of traditional KAMA to provide price trend prediction
|
|
- MACD: Calculates fast line, slow line, and signal line to identify momentum changes
|
|
- RSI: Measures the speed and magnitude of price movements to identify overbought and oversold areas
|
|
- ATR: Measures market volatility, used for setting dynamic stop points
|
|
|
|
2. **AI Signal Filtering**:
|
|
The strategy creates a weighted confidence score by incorporating:
|
|
- Normalized MACD histogram relative to historical highs
|
|
- RSI deviation from the centerline (50)
|
|
- Volume ratio relative to average volume
|
|
These three metrics are averaged to form the AI signal, and trades are only executed when this signal exceeds a set threshold.
|
|
|
|
3. **Entry Conditions**:
|
|
Long entry requirements:
|
|
- KAMA crosses above TEMA (trend turns upward)
|
|
- MACD line is above the signal line (upward momentum)
|
|
- RSI is above oversold level (price has rebound momentum)
|
|
- Volume is higher than a specific multiple of average volume (strong market participation)
|
|
- AI confidence is above threshold (comprehensive confirmation)
|
|
|
|
Opposite conditions apply for short entries.
|
|
|
|
4. **Risk Management**:
|
|
- Dynamic stop-loss points calculated based on ATR, adapting to market volatility
|
|
- Take-profit levels set based on risk-reward ratio, ensuring consistent risk-reward proportion for each trade
|
|
|
|
## Strategy Advantages
|
|
|
|
1. **Multi-dimensional Signal Confirmation**:
|
|
By requiring multiple independent indicators to confirm simultaneously, the strategy reduces the possibility of false signals. The TEMA and KAMA crossover provides trend direction, while MACD and RSI confirm momentum and overbought/oversold conditions respectively.
|
|
|
|
2. **Dynamic Risk Management**:
|
|
The ATR-based stop-loss method adapts to current market volatility, ensuring stops aren't triggered by market noise but also aren't too loose in highly volatile environments.
|
|
|
|
3. **AI-Enhanced Filtering**:
|
|
While the AI implementation in the code is simulated, it integrates three key market aspects (price momentum, overbought/oversold conditions, and volume anomalies), adding an extra layer of confirmation to traditional indicators.
|
|
|
|
4. **Volume Confirmation**:
|
|
By requiring trades to occur during abnormally high volume, the strategy ensures entry into movements with sufficient market participation, which typically indicates more reliable price movements.
|
|
|
|
5. **Flexible Parameterization**:
|
|
The strategy offers multiple adjustable parameters, allowing traders to optimize according to different market conditions or personal risk preferences.
|
|
|
|
## Strategy Risks
|
|
|
|
1. **Parameter Optimization Overfitting**:
|
|
The strategy includes multiple parameters (such as TEMA length, KAMA length, MACD settings, etc.). Excessive optimization of these parameters may lead to overfitting, performing well on historical data but poorly in future live markets. This can be mitigated through walk-forward optimization and robustness testing across multiple market conditions.
|
|
|
|
2. **Limitations of Technical Indicators**:
|
|
All indicators used are inherently lagging and may provide inaccurate signals in rapidly changing markets or extreme conditions. The addition of the AI confidence score partially mitigates this issue but cannot eliminate it entirely.
|
|
|
|
3. **Increased Failure Points in Complex Systems**:
|
|
As the strategy relies on multiple indicators and conditions being met simultaneously, it may lead to reduced trading frequency, missing some potentially favorable opportunities. In low-volatility or sideways markets, this conservative approach may result in extended periods without trades.
|
|
|
|
4. **Limitations of AI Simulation**:
|
|
The "AI" in the code is actually a simplified mathematical model, not a true machine learning algorithm. It lacks adaptive learning and true pattern recognition capabilities, potentially not being as effective at identifying complex market patterns as actual AI.
|
|
|
|
5. **Impact of Slippage and Commissions**:
|
|
Although the strategy considers slippage and commissions, in actual trading, these costs may be higher than expected, especially in low-liquidity or high-volatility environments, affecting the overall profitability of the strategy.
|
|
|
|
## Strategy Optimization Directions
|
|
|
|
1. **True AI Integration**:
|
|
Replace the simple AI signal with a genuine machine learning model, such as random forests or neural networks. This can be implemented through externally trained models with predictions fed into the strategy, improving the ability to identify genuine patterns.
|
|
|
|
2. **Market State Adaptation**:
|
|
Add market state recognition logic (such as trending, ranging, or high-volatility states) to automatically adjust parameters based on different market environments. For example, more sensitive indicator settings might be needed in ranging markets, while more conservative settings are appropriate in trending markets.
|
|
|
|
3. **Time Filters**:
|
|
Implement time filtering mechanisms to avoid trading during major economic data releases or low-liquidity market sessions, reducing risks from abnormal volatility.
|
|
|
|
4. **Improved Stop-Loss Strategy**:
|
|
Consider implementing trailing stops or support/resistance-based stops rather than relying solely on ATR. This would better protect profits and adapt to changing market structures.
|
|
|
|
5. **Optimized Position Management**:
|
|
The current strategy uses a fixed percentage of funds for each trade. Implementing dynamic position sizing based on market volatility, signal strength, and historical win rates would achieve optimal capital risk management.
|
|
|
|
6. **Additional Filters**:
|
|
Consider adding trend strength indicators (such as ADX) or market structure indicators (such as support/resistance, key price levels) as additional confirmation layers to reduce trading in low-quality setups.
|
|
|
|
## Summary
|
|
|
|
This "Multi-Indicator Dynamic Adaptive Quantitative Trading Strategy" represents a carefully designed quantitative trading approach that creates a comprehensive trading system by combining traditional technical analysis indicators with simulated AI confidence scoring. Its core strengths lie in multi-layered signal confirmation and dynamic risk management that adapts to market volatility.
|
|
|
|
The strategy is based on TEMA and KAMA crossovers, supplemented by MACD, RSI, and volume analysis confirmation, then finally filtered by an AI confidence score. This multi-layered approach helps reduce false signals but may also result in missing certain trading opportunities.
|
|
|
|
To further enhance strategy performance, implementing genuine machine learning models, market state adaptive adjustments, optimized stop mechanisms, and dynamic position management are recommended. These improvements can enhance the strategy's ability to handle different market environments, improving long-term stability and profit potential.
|
|
|
|
Importantly, any quantitative strategy requires comprehensive backtesting and forward testing before implementation, with particular attention to performance under different market conditions to ensure strategy robustness and adaptability. In actual trading, continuous monitoring and necessary adjustments are equally important to adapt to constantly changing market dynamics.[/trans]
|
|
|
|
|
|
|
|
> Source (PineScript)
|
|
|
|
``` pinescript
|
|
/*backtest
|
|
start: 2024-04-01 00:00:00
|
|
end: 2025-03-31 00:00:00
|
|
period: 1h
|
|
basePeriod: 1h
|
|
exchanges: [{"eid":"Futures_Binance","currency":"BTC_USDT"}]
|
|
*/
|
|
|
|
//@version=5
|
|
strategy("AI-Powered Crypto Strategy", overlay=true, default_qty_type=strategy.percent_of_equity, default_qty_value=10, calc_on_order_fills=true, calc_on_every_tick=true, slippage=1, commission_value=0.05)
|
|
|
|
// Parameters
|
|
temaLength = input(20, "Triple EMA Length")
|
|
kamaLength = input(10, "KAMA Length")
|
|
macdFast = input(12, "MACD Fast")
|
|
macdSlow = input(26, "MACD Slow")
|
|
macdSignal = input(9, "MACD Signal")
|
|
rsiLength = input(14, "RSI Length")
|
|
rsiOverbought = input(75, "RSI Overbought")
|
|
rsiOversold = input(25, "RSI Oversold")
|
|
atrLength = input(14, "ATR Length")
|
|
stopATRMultiplier = input(2, "ATR Stop Multiplier")
|
|
riskRewardRatio = input(4, "Risk-Reward Ratio")
|
|
volumeThreshold = input(2, "Volume Multiplier")
|
|
aiThreshold = input(0.6, "AI Confidence Threshold")
|
|
|
|
// Indicators
|
|
tema = ta.ema(ta.ema(ta.ema(close, temaLength), temaLength), temaLength)
|
|
kama = ta.linreg(close, kamaLength, 0) // Replacing KAMA with Linear Regression Approximation
|
|
[macdLine, signalLine, _] = ta.macd(close, macdFast, macdSlow, macdSignal)
|
|
rsi = ta.rsi(close, rsiLength)
|
|
atr = ta.atr(atrLength)
|
|
avgVolume = ta.sma(volume, 20)
|
|
|
|
// AI-Based Signal Filtering (Simulated using a weighted confidence score)
|
|
aiSignal = ((macdLine - signalLine) / ta.highest(macdLine - signalLine, 50) + (rsi - 50) / 50 + (volume / avgVolume - 1)) / 3
|
|
highConfidence = aiSignal > aiThreshold
|
|
|
|
// Entry Conditions (AI-Powered Setups)
|
|
longCondition = ta.crossover(kama, tema) and macdLine > signalLine and rsi > rsiOversold and volume > avgVolume * volumeThreshold and highConfidence
|
|
shortCondition = ta.crossunder(kama, tema) and macdLine < signalLine and rsi < rsiOverbought and volume > avgVolume * volumeThreshold and highConfidence
|
|
|
|
// Stop Loss and Take Profit (Using ATR for Dynamic Risk Management)
|
|
longStopLoss = close - (atr * stopATRMultiplier)
|
|
shortStopLoss = close + (atr * stopATRMultiplier)
|
|
longTakeProfit = close + (close - longStopLoss) * riskRewardRatio
|
|
shortTakeProfit = close - (shortStopLoss - close) * riskRewardRatio
|
|
|
|
// Execute Trades
|
|
if (longCondition)
|
|
strategy.entry("Long", strategy.long)
|
|
strategy.exit("Long TP", from_entry="Long", limit=longTakeProfit, stop=longStopLoss)
|
|
|
|
if (shortCondition)
|
|
strategy.entry("Short", strategy.short)
|
|
strategy.exit("Short TP", from_entry="Short", limit=shortTakeProfit, stop=shortStopLoss)
|
|
|
|
// Plot Indicators
|
|
plot(tema, title="TEMA", color=color.blue)
|
|
plot(kama, title="KAMA (Linear Regression Approx)", color=color.orange)
|
|
plot(macdLine, title="MACD Line", color=color.green)
|
|
plot(signalLine, title="MACD Signal", color=color.red)
|
|
plot(aiSignal, title="AI Confidence Score", color=color.purple)
|
|
plotshape(series=longCondition, location=location.belowbar, color=color.green, style=shape.labelup, title="BUY")
|
|
plotshape(series=shortCondition, location=location.abovebar, color=color.red, style=shape.labeldown, title="SELL")
|
|
|
|
```
|
|
|
|
> Detail
|
|
|
|
https://www.fmz.com/strategy/489025
|
|
|
|
> Last Modified
|
|
|
|
2025-04-01 11:25:46
|