
221 lines
10 KiB
Markdown
221 lines
10 KiB
Markdown
|
|
> Name
|
|
|
|
多层级超买超卖震荡买入策略-Multi-Level-Oversold-Oscillator-Buy-Strategy
|
|
|
|
> Author
|
|
|
|
ChaoZhang
|
|
|
|
> Strategy Description
|
|
|
|
|
|
[trans]
|
|
|
|
#### 概述
|
|
|
|
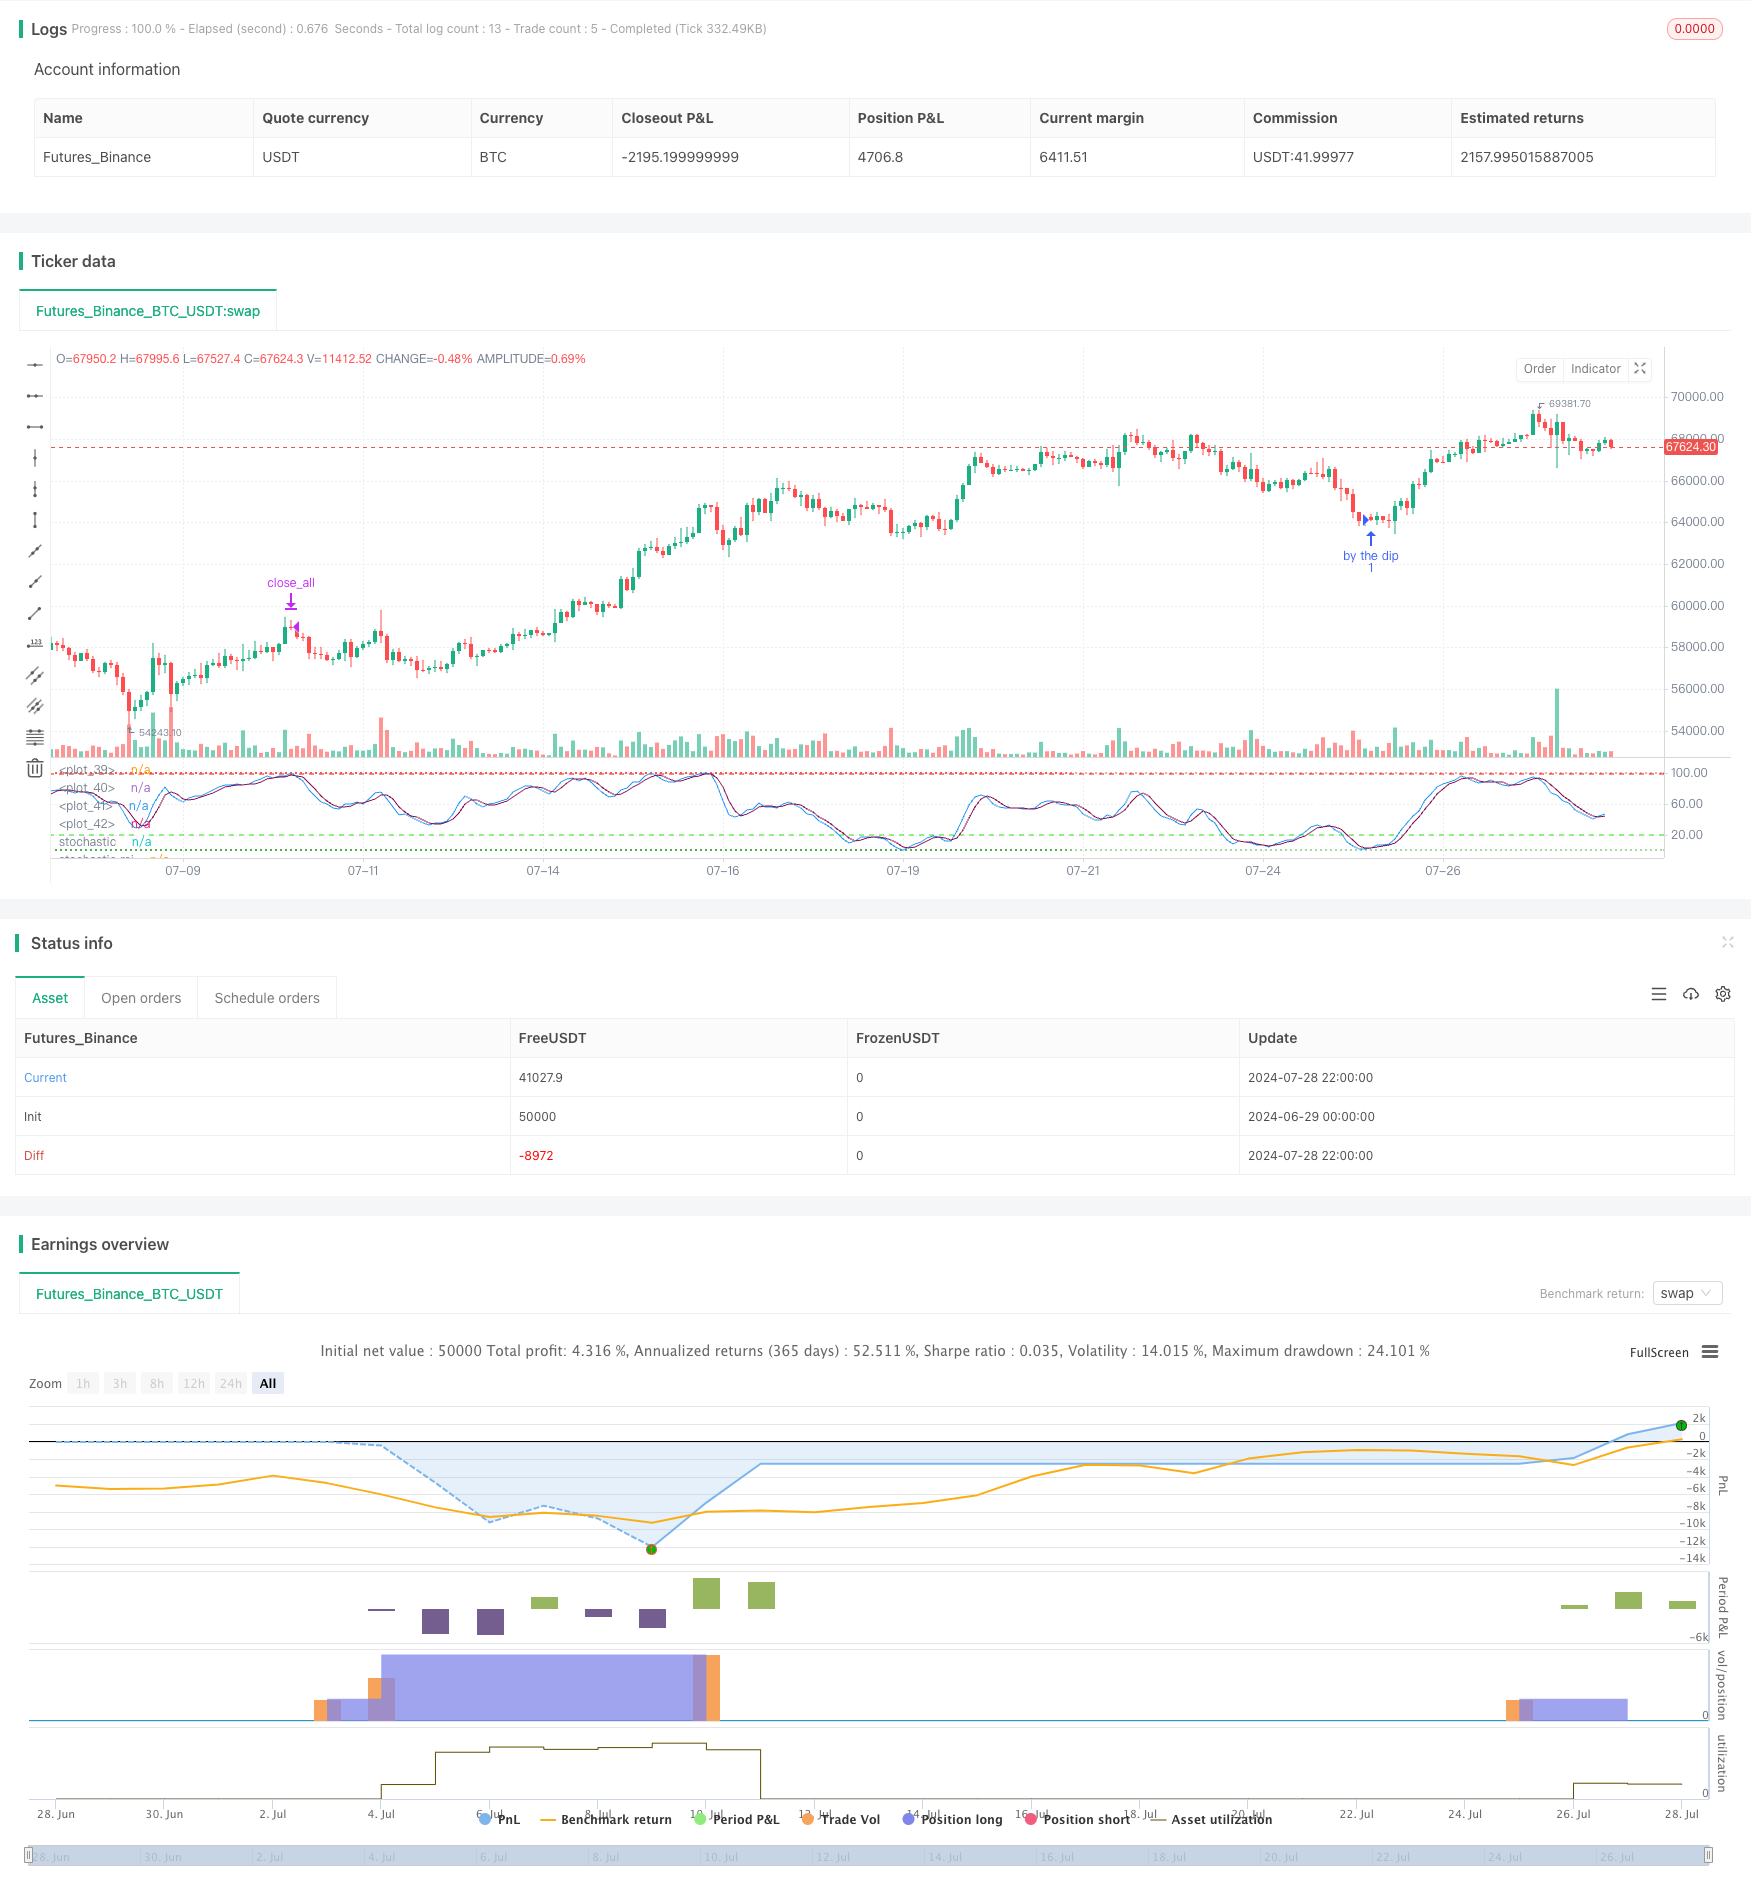
多层级超买超卖震荡买入策略是一种专为牛市环境设计的长线交易策略。该策略利用随机指标(Stochastic)和随机相对强弱指标(Stochastic RSI)的组合,在市场调整期间寻找最佳买入时机。策略采用三级金字塔式加仓方法,模拟美元成本平均法(DCA)的效果,旨在捕捉市场回调带来的投资机会。
|
|
|
|
#### 策略原理
|
|
|
|
该策略的核心原理是通过识别超卖区域的买入信号来实现"逢低买入"。具体来说:
|
|
|
|
1. 使用周期较长(66)的随机指标(K)和随机RSI指标(Kr)。
|
|
2. 设定上偏的超卖线(20)和超买线(99),以适应牛市环境。
|
|
3. 当K和Kr同时低于超卖线(20)时,策略开始寻找买入机会。
|
|
4. 在上述条件满足的情况下,一旦Kr线上穿D线,触发买入信号。
|
|
5. 采用3级金字塔式加仓,每次投入账户总值的20%。
|
|
6. 当Kr线达到或超过超买线(99)时,平掉所有头寸获利了结。
|
|
|
|
策略不设止损,体现了对牛市趋势的坚定信心。
|
|
|
|
#### 策略优势
|
|
|
|
1. 顺应趋势:专为牛市设计,充分利用上升趋势中的回调机会。
|
|
2. 多重确认:结合两种指标,提高入场信号的可靠性。
|
|
3. 灵活加仓:三级金字塔式加仓法,既能降低平均成本,又能控制风险。
|
|
4. 自适应性强:通过调整参数,可适应不同市场环境。
|
|
5. 简单直观:策略逻辑清晰,易于理解和执行。
|
|
6. 自动化友好:代码简洁,易于实现自动化交易。
|
|
|
|
#### 策略风险
|
|
|
|
1. 假突破风险:在震荡市中可能频繁触发假信号。
|
|
解决方法:增加额外的趋势确认指标,如移动平均线。
|
|
|
|
2. 过度加仓风险:连续下跌可能导致过度持仓。
|
|
解决方法:设置最大持仓限制或动态调整加仓比例。
|
|
|
|
3. 错过反弹风险:严格的入场条件可能导致错过快速反弹。
|
|
解决方法:考虑增加更灵敏的短期指标作为辅助。
|
|
|
|
4. 缺乏止损机制:在剧烈回调中可能承受较大亏损。
|
|
解决方法:引入基于波动率的动态止损机制。
|
|
|
|
5. 参数敏感性:策略表现可能过度依赖于参数设置。
|
|
解决方法:进行全面的参数优化和回测。
|
|
|
|
#### 策略优化方向
|
|
|
|
1. 动态参数调整:根据市场波动率自动调整Stochastic和RSI的周期。
|
|
原因:提高策略对不同市场环境的适应性。
|
|
|
|
2. 引入趋势过滤器:增加长期移动平均线作为趋势确认。
|
|
原因:减少震荡市中的假信号,提高入场质量。
|
|
|
|
3. 实现动态加仓:基于市场波动性和账户盈亏调整每次加仓比例。
|
|
原因:更好地控制风险,提高资金利用效率。
|
|
|
|
4. 增加获利了结机制:在Kr达到超买区域时,分批减仓而非全部平仓。
|
|
原因:避免错过大趋势,提高长期收益。
|
|
|
|
5. 整合市场情绪指标:如VIX或资金流向指标,优化入场时机。
|
|
原因:提高策略对市场宏观环境的敏感度。
|
|
|
|
#### 总结
|
|
|
|
多层级超买超卖震荡买入策略是一种设计精巧的牛市交易系统,通过结合Stochastic和Stochastic RSI指标,有效捕捉市场调整中的买入机会。其三级金字塔式加仓方法不仅模拟了DCA策略的优势,还提供了更灵活的仓位管理。虽然策略在设计上偏向乐观,但通过合理的风险管理和持续优化,有潜力成为一个稳健的长期投资工具。未来的优化方向应着重于提高策略的自适应性和风险控制能力,以应对不同的市场环境。总的来说,这是一个值得进一步研究和改进的有潜力的交易策略。
|
|
|
|
||
|
|
|
|
#### Overview
|
|
|
|
The Multi-Level Oversold Oscillator Buy Strategy is a long-only trading system designed specifically for bullish market environments. This strategy utilizes a combination of the Stochastic Oscillator and the Stochastic Relative Strength Index (Stochastic RSI) to identify optimal buying opportunities during market corrections. The strategy employs a three-level pyramiding approach to emulate the effects of Dollar Cost Averaging (DCA), aiming to capitalize on market pullbacks.
|
|
|
|
#### Strategy Principles
|
|
|
|
The core principle of this strategy is to "buy the dips" by identifying buy signals in oversold territory. Specifically:
|
|
|
|
1. It uses a long-period (66) Stochastic Oscillator (K) and Stochastic RSI (Kr).
|
|
2. Sets upwardly biased oversold (20) and overbought (99) lines to suit bullish markets.
|
|
3. When both K and Kr fall below the oversold line (20), the strategy starts looking for buying opportunities.
|
|
4. Under these conditions, a buy signal is triggered when the Kr line crosses above the D line.
|
|
5. Implements a 3-level pyramiding approach, investing 20% of the account value each time.
|
|
6. All positions are closed for profit when the Kr line reaches or exceeds the overbought line (99).
|
|
|
|
The strategy does not employ a stop-loss, reflecting strong confidence in the bullish trend.
|
|
|
|
#### Strategy Advantages
|
|
|
|
1. Trend-following: Designed for bull markets, effectively utilizing pullbacks in uptrends.
|
|
2. Multiple confirmations: Combines two indicators to increase the reliability of entry signals.
|
|
3. Flexible position sizing: Three-level pyramiding approach lowers average cost while controlling risk.
|
|
4. High adaptability: Can be adjusted to different market conditions through parameter tuning.
|
|
5. Simplicity and clarity: Clear strategy logic that is easy to understand and execute.
|
|
6. Automation-friendly: Concise code, easily implementable for automated trading.
|
|
|
|
#### Strategy Risks
|
|
|
|
1. False breakout risk: May trigger frequent false signals in choppy markets.
|
|
Solution: Incorporate additional trend confirmation indicators, such as moving averages.
|
|
|
|
2. Over-leveraging risk: Continuous declines may lead to excessive positions.
|
|
Solution: Set maximum position limits or dynamically adjust the pyramiding ratio.
|
|
|
|
3. Missing rebound risk: Strict entry conditions may cause missing quick rebounds.
|
|
Solution: Consider adding more sensitive short-term indicators as supplements.
|
|
|
|
4. Lack of stop-loss mechanism: May incur significant losses during severe corrections.
|
|
Solution: Introduce a volatility-based dynamic stop-loss mechanism.
|
|
|
|
5. Parameter sensitivity: Strategy performance may overly depend on parameter settings.
|
|
Solution: Conduct comprehensive parameter optimization and backtesting.
|
|
|
|
#### Strategy Optimization Directions
|
|
|
|
1. Dynamic parameter adjustment: Automatically adjust Stochastic and RSI periods based on market volatility.
|
|
Reason: Enhance strategy adaptability to different market environments.
|
|
|
|
2. Introduce trend filters: Add long-term moving averages for trend confirmation.
|
|
Reason: Reduce false signals in choppy markets and improve entry quality.
|
|
|
|
3. Implement dynamic position sizing: Adjust each pyramiding ratio based on market volatility and account performance.
|
|
Reason: Better risk control and improved capital efficiency.
|
|
|
|
4. Enhance profit-taking mechanism: Implement partial position reduction when Kr reaches overbought territory instead of full closure.
|
|
Reason: Avoid missing extended trends and improve long-term returns.
|
|
|
|
5. Integrate market sentiment indicators: Such as VIX or fund flow indicators to optimize entry timing.
|
|
Reason: Increase strategy sensitivity to macro market environments.
|
|
|
|
#### Conclusion
|
|
|
|
The Multi-Level Oversold Oscillator Buy Strategy is an ingeniously designed bull market trading system that effectively captures buying opportunities during market corrections by combining Stochastic and Stochastic RSI indicators. Its three-level pyramiding approach not only emulates the advantages of DCA strategy but also provides more flexible position management. While the strategy design leans towards optimism, it has the potential to become a robust long-term investment tool with proper risk management and continuous optimization. Future optimization should focus on enhancing the strategy's adaptability and risk control capabilities to cope with various market environments. Overall, this is a promising trading strategy worthy of further research and improvement.
|
|
|
|
[/trans]
|
|
|
|
|
|
|
|
> Source (PineScript)
|
|
|
|
``` pinescript
|
|
/*backtest
|
|
start: 2024-06-29 00:00:00
|
|
end: 2024-07-29 00:00:00
|
|
period: 2h
|
|
basePeriod: 15m
|
|
exchanges: [{"eid":"Futures_Binance","currency":"BTC_USDT"}]
|
|
*/
|
|
|
|
// This Pine Script™ code is subject to the terms of the Mozilla Public License 2.0 at https://mozilla.org/MPL/2.0/
|
|
// © aeperalta
|
|
|
|
//@version=5
|
|
strategy("Buy The Dips [aep]", overlay=false, pyramiding = 3)
|
|
|
|
//------- strategy details ------------ {
|
|
// The strategy is to buy the dips by entering the market in the territory of oversold
|
|
// When both Stochastic (K) and Stochastic RSI (Kr) are below OS line is time to look for
|
|
// crossovers in the Stochastic RSI indicator and buy @ market
|
|
// Take profit will happend when Kr is way up near the 100% as Overbought territory
|
|
// Since we are buy dips of during bullmarkets, there is no stoploss
|
|
//}
|
|
|
|
|
|
// ------stochastics --------{
|
|
periodK = input.int(66, title="%K Length", minval=1)
|
|
smoothK = input.int(3, title="%K Smoothing", minval=1)
|
|
periodD = input.int(3, title="%D Smoothing", minval=1)
|
|
|
|
// classic stochastic
|
|
k = ta.sma(ta.stoch(close, high, low, periodK), smoothK)
|
|
|
|
|
|
// stochastic rsi
|
|
periodRSI = input(14)
|
|
rsi = ta.rsi(close,periodRSI)
|
|
kr = ta.sma(ta.stoch(rsi, rsi, rsi, periodK), smoothK)
|
|
d = ta.sma(kr, periodD)
|
|
|
|
// plots
|
|
OB = input.int(99, "Overbought")
|
|
OS = input.int(20, 'Oversold')
|
|
|
|
plot(k,'stochastic',color.white,2)
|
|
plot(kr, 'stochastic rsi', color.blue, 1)
|
|
plot(d, '%rsi D',color.maroon, 1 )
|
|
|
|
hline(OS, color = color.rgb(39, 230, 18), linestyle= hline.style_dashed)
|
|
hline(OB, color = color.rgb(229, 28, 18), linestyle= hline.style_dashed)
|
|
hline(100, color = color.red, linestyle= hline.style_dotted)
|
|
hline(0, color = color.green, linestyle= hline.style_dotted)
|
|
|
|
//}
|
|
// -------------- strategy excecution --------------- {
|
|
|
|
if ta.crossover(kr, d) and kr < OS and k < OS
|
|
strategy.entry("by the dip",strategy.long)
|
|
if kr >= OB
|
|
strategy.close_all()
|
|
|
|
//}
|
|
```
|
|
|
|
> Detail
|
|
|
|
https://www.fmz.com/strategy/458170
|
|
|
|
> Last Modified
|
|
|
|
2024-07-30 15:45:44
|