
259 lines
20 KiB
Markdown
259 lines
20 KiB
Markdown
|
|
> Name
|
|
|
|
多层级布林带趋势跟踪与反转交易策略-Multi-level-Bollinger-Bands-Trend-Following-and-Reversal-Trading-Strategy
|
|
|
|
> Author
|
|
|
|
ianzeng123
|
|
|
|
> Strategy Description
|
|
|
|
|
|
|
|
|
|
|
|
[trans]
|
|
|
|
#### 概述
|
|
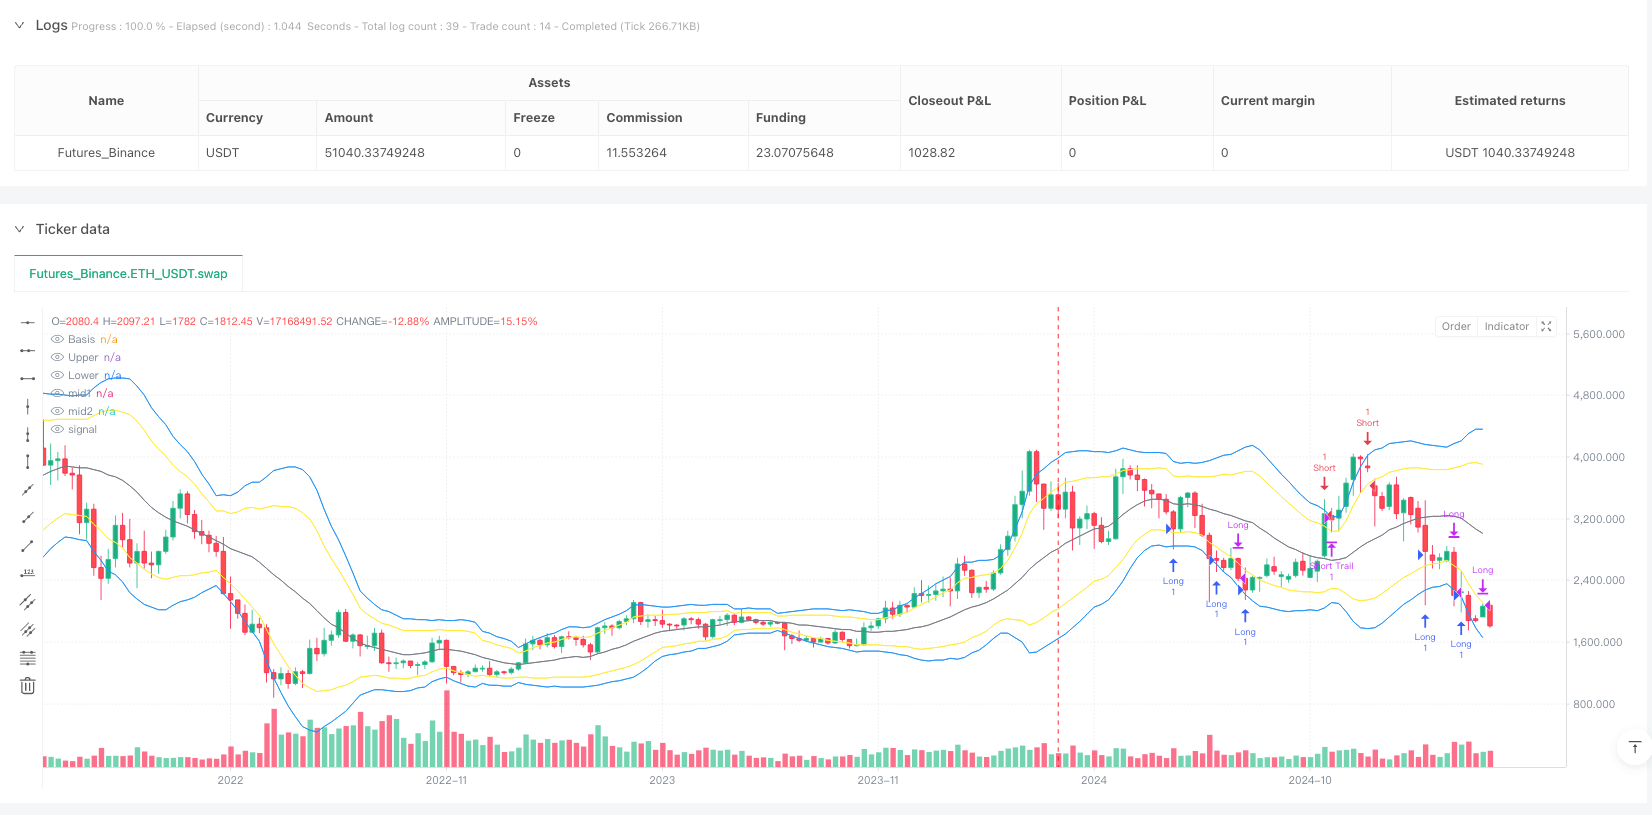
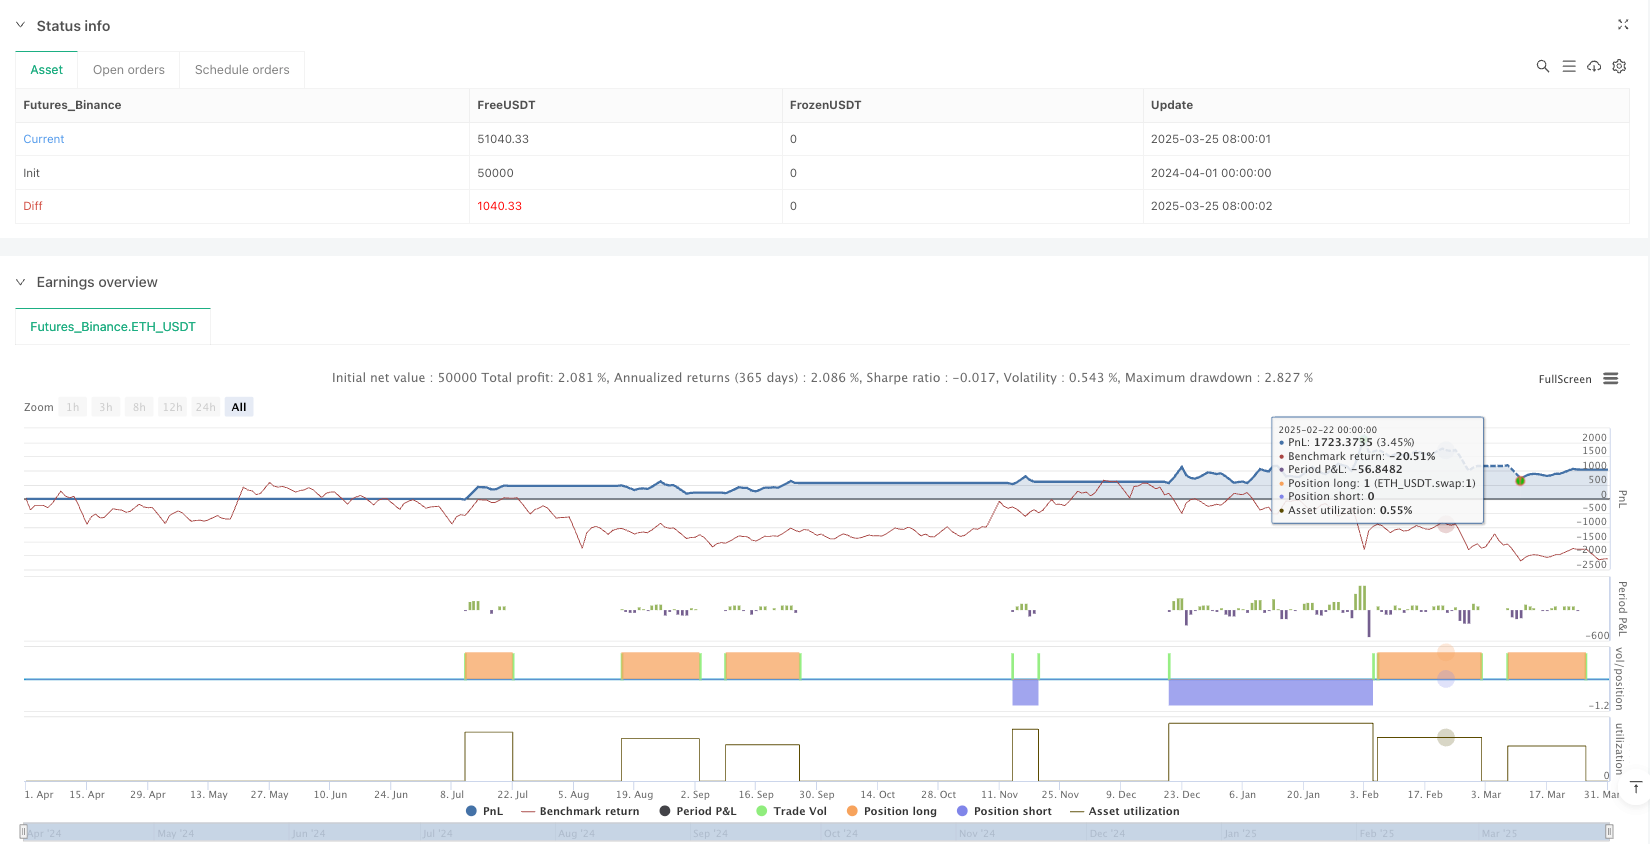
多层级布林带趋势跟踪与反转交易策略是一个基于布林带(Bollinger Bands)指标的综合交易系统,该策略巧妙地结合了趋势跟踪和反转交易的特点,通过价格与布林带上下轨的互动来捕捉市场机会。系统设计了三层出场机制,包括区域判断、均线穿越和移动止盈,使策略在捕捉利润最大化的同时,能有效控制风险。这一策略适用于多种市场环境和时间周期,尤其适合波动较大的金融市场。
|
|
|
|
#### 策略原理
|
|
该策略的核心原理是利用布林带作为价格波动的动态参考区间,并结合精心设计的多层次进出场规则。
|
|
|
|
进场逻辑分为两部分:
|
|
1. 做多条件:当价格向上穿越布林带下轨(Crossover Lower Band),或价格触及下轨下方后反弹(即最低价低于下轨但收盘价高于下轨)时进场做多。
|
|
2. 做空条件:当价格向下穿越布林带上轨(Crossunder Upper Band),或价格触及上轨上方后回落(即最高价高于上轨但收盘价低于上轨)时进场做空。
|
|
|
|
出场逻辑设计了三层防护措施:
|
|
1. 第一层(区域判断):从进场后第X根K线开始,当收盘价进入布林带特定区域时出场。具体而言,做多时,如果价格跌至下轨与均线之间前1/3区域,则平仓;做空时,如果价格涨至上轨与均线之间前1/3区域,则平仓。
|
|
2. 第二层(均线穿越):从进场后第Y根K线开始,如果收盘价穿越20期均线(MA20),则平仓。
|
|
3. 第三层(移动止盈):当价格突破布林带另一侧边缘时启动移动止盈机制,一旦利润回撤Z%则自动出场,锁定大部分收益。
|
|
|
|
布林带参数可灵活调整,包括均线周期(默认20)和标准差倍数(默认2.0)。出场设置也可根据市场特性调整,包括X(默认3)、Y(默认10)和移动止盈回撤百分比Z(默认30%)。
|
|
|
|
#### 策略优势
|
|
1. 捕捉多种市场机会:策略同时包含趋势跟踪和反转交易逻辑,能够在不同市场环境下找到交易机会。当市场处于震荡状态时,可利用价格触及布林带边缘后的反弹/回落;当市场开始趋势运动时,则可通过价格突破布林带边缘的信号跟随趋势。
|
|
|
|
2. 多层次风险控制:通过设计三层不同机制的出场条件,策略能够在不同情况下保护资金。第一层区域判断能迅速识别交易方向错误;第二层均线穿越适合中期趋势改变;第三层移动止盈则在大幅盈利后保护已获利润。
|
|
|
|
3. 参数灵活可调:策略提供多个可调整参数,使交易者能根据不同市场和时间周期特性优化系统。布林带长度和倍数可调整以适应市场波动性,出场条件的时间参数(X和Y)以及移动止盈回撤比例(Z)可根据交易者的风险偏好设置。
|
|
|
|
4. 可视化优势:布林带以及新增的中间参考线直接绘制在图表上,便于交易者直观分析价格位置和潜在的支撑/阻力区域,提高决策效率。
|
|
|
|
5. 代码结构清晰:策略代码组织有序,变量命名规范,注释详细,便于理解和维护。进出场逻辑分离明确,便于后续扩展和优化。
|
|
|
|
#### 策略风险
|
|
1. 缺乏明确止损机制:当前策略未包含传统意义上的止损条件,在极端市场条件下可能导致较大损失。建议交易者根据个人风险承受能力,手动添加固定止损或基于ATR的动态止损逻辑。
|
|
|
|
2. 过度依赖布林带:在高波动或低流动性市场中,布林带可能过宽或过窄,导致信号质量下降。建议在不同市场环境中测试不同的布林带参数设置。
|
|
|
|
3. 参数敏感性:策略表现可能对参数设置敏感,如布林带长度、标准差倍数以及出场条件的时间参数。不当的参数选择可能导致过度交易或错过重要机会。
|
|
|
|
4. 移动止盈触发条件固定:当前代码中,移动止盈的触发条件设为固定的2倍风险距离,这可能不适用于所有市场环境。在波动过大的市场中,可能导致止盈设置过远,无法有效保护利润。
|
|
|
|
5. 多空条件对称性风险:策略对多空方向使用对称的进出场逻辑,但实际市场中,涨跌行为往往不对称(如股票市场通常下跌速度快于上涨)。建议考虑为多空方向设置不同的参数。
|
|
|
|
#### 策略优化方向
|
|
1. 增加智能止损机制:可以引入基于ATR(平均真实波幅)的动态止损,或者基于布林带宽度设置止损距离,使止损更贴合市场实际波动情况。实现方式可通过在strategy.entry函数中添加stop参数,或使用strategy.exit函数的stop_loss参数。
|
|
|
|
2. 优化进场过滤条件:可考虑增加趋势确认指标,如方向移动指标(DMI)或相对强弱指数(RSI),以过滤低质量信号。例如,只在ADX>25时接受趋势跟踪信号,或只在RSI超买/超卖区域接受反转信号。
|
|
|
|
3. 自适应参数设置:将布林带参数和出场条件参数设计为自适应形式,根据市场波动性自动调整。例如,可以计算过去N周期的波动率,并据此动态调整布林带的标准差倍数。
|
|
|
|
4. 改进移动止盈机制:使移动止盈的触发条件和跟踪距离可调整,而不是固定为2倍风险距离。考虑根据不同时间周期的波动特性,调整移动止盈的回撤百分比。
|
|
|
|
5. 加入时间过滤:引入交易时段过滤,避开市场开盘和收盘前的高波动时段,或针对特定市场添加最佳交易时间过滤器。
|
|
|
|
6. 多周期分析:整合多周期分析框架,要求更高周期的趋势方向与当前交易方向一致,以提高信号质量。例如,只在日线趋势向上时,接受4小时图表上的做多信号。
|
|
|
|
7. 优化资金管理:加入基于波动性的仓位计算逻辑,在低波动环境增加仓位,高波动环境减少仓位,以平衡风险与收益。
|
|
|
|
#### 总结
|
|
多层级布林带趋势跟踪与反转交易策略是一个设计全面的交易系统,通过布林带指标的动态特性,结合多层次出场规则,在捕捉市场机会的同时有效管理风险。该策略的最大优势在于其灵活性和适应性,能够在不同市场环境中找到交易机会,并通过参数调整适应不同的交易品种和时间周期。
|
|
|
|
虽然策略存在一些风险点,如缺乏明确的止损机制和参数敏感性,但通过本文提出的优化方向,如增加智能止损、优化进场过滤条件、自适应参数设置等,可以进一步提升策略的稳健性和盈利能力。
|
|
|
|
对于交易者而言,建议在实际应用前进行充分的回测,并根据特定市场特性调整参数。同时,将该策略作为完整交易系统的一部分,结合其他技术和基本面分析,制定全面的交易决策。 ||
|
|
|
|
#### Overview
|
|
The Multi-level Bollinger Bands Trend Following and Reversal Trading Strategy is a comprehensive trading system based on the Bollinger Bands indicator. This strategy cleverly combines trend following and reversal trading characteristics by capturing market opportunities through the interaction between price and the upper and lower Bollinger Bands. The system has designed a three-layer exit mechanism, including zone judgment, moving average crossover, and trailing stop profit, which maximizes profit capture while effectively controlling risk. This strategy is applicable to various market environments and time periods, particularly suitable for highly volatile financial markets.
|
|
|
|
#### Strategy Principles
|
|
The core principle of this strategy is to use Bollinger Bands as a dynamic reference range for price fluctuations, combined with carefully designed multi-level entry and exit rules.
|
|
|
|
The entry logic is divided into two parts:
|
|
1. Long entry conditions: Enter long when the price crosses above the lower Bollinger Band (Crossover Lower Band), or when the price touches below the lower band and then rebounds (i.e., the low price is below the lower band but the closing price is above the lower band).
|
|
2. Short entry conditions: Enter short when the price crosses below the upper Bollinger Band (Crossunder Upper Band), or when the price touches above the upper band and then falls back (i.e., the high price is above the upper band but the closing price is below the upper band).
|
|
|
|
The exit logic includes three protective measures:
|
|
1. First layer (zone judgment): Starting from the X-th bar after entry, exit when the closing price enters a specific area of the Bollinger Bands. Specifically, for long positions, close the position if the price falls to the first 1/3 area between the lower band and the middle band; for short positions, close the position if the price rises to the first 1/3 area between the upper band and the middle band.
|
|
2. Second layer (moving average crossover): Starting from the Y-th bar after entry, close the position if the closing price crosses the 20-period moving average (MA20).
|
|
3. Third layer (trailing stop profit): Activate the trailing stop profit mechanism when the price breaks through the opposite edge of the Bollinger Bands, and automatically exit once the profit retraces by Z%, securing most of the gains.
|
|
|
|
Bollinger Bands parameters can be flexibly adjusted, including the moving average period (default 20) and standard deviation multiplier (default 2.0). Exit settings can also be adjusted according to market characteristics, including X (default 3), Y (default 10), and trailing stop profit retreat percentage Z (default 30%).
|
|
|
|
#### Strategy Advantages
|
|
1. Captures various market opportunities: The strategy includes both trend following and reversal trading logic, allowing it to find trading opportunities in different market environments. When the market is in a consolidation state, it can capitalize on price rebounds/falls after touching the edges of Bollinger Bands; when the market begins a trend movement, it can follow the trend through signals of price breakthrough at the edges of Bollinger Bands.
|
|
|
|
2. Multi-level risk control: Through three different exit condition mechanisms, the strategy can protect capital in various situations. The first layer of zone judgment can quickly identify incorrect trading directions; the second layer of moving average crossover is suitable for medium-term trend changes; the third layer of trailing stop profit protects profits after significant gains.
|
|
|
|
3. Flexible parameters: The strategy provides multiple adjustable parameters, allowing traders to optimize the system according to different market and time period characteristics. Bollinger Bands length and multiplier can be adjusted to adapt to market volatility, and the time parameters (X and Y) of exit conditions as well as the trailing stop profit retreat ratio (Z) can be set according to the trader's risk preference.
|
|
|
|
4. Visualization advantage: Bollinger Bands and newly added middle reference lines are directly drawn on the chart, facilitating intuitive analysis of price positions and potential support/resistance areas, improving decision-making efficiency.
|
|
|
|
5. Clear code structure: The strategy code is well-organized, with standardized variable naming and detailed comments, making it easy to understand and maintain. Entry and exit logic are clearly separated, facilitating subsequent expansion and optimization.
|
|
|
|
#### Strategy Risks
|
|
1. Lack of explicit stop-loss mechanism: The current strategy does not include traditional stop-loss conditions, which may lead to significant losses under extreme market conditions. It is recommended that traders manually add fixed stop-loss or ATR-based dynamic stop-loss logic according to their risk tolerance.
|
|
|
|
2. Over-reliance on Bollinger Bands: In highly volatile or low liquidity markets, Bollinger Bands may be too wide or too narrow, leading to decreased signal quality. It is recommended to test different Bollinger Bands parameter settings in different market environments.
|
|
|
|
3. Parameter sensitivity: Strategy performance may be sensitive to parameter settings, such as Bollinger Bands length, standard deviation multiplier, and time parameters for exit conditions. Inappropriate parameter selection may lead to overtrading or missing important opportunities.
|
|
|
|
4. Fixed trailing stop profit trigger conditions: In the current code, the trigger condition for the trailing stop profit is set to a fixed 2 times risk distance, which may not be applicable to all market environments. In highly volatile markets, this may cause the stop profit to be set too far, failing to effectively protect profits.
|
|
|
|
5. Symmetry risk for long and short conditions: The strategy uses symmetrical entry and exit logic for long and short directions, but in actual markets, rising and falling behaviors are often asymmetrical (e.g., stock markets usually fall faster than they rise). It is recommended to consider setting different parameters for long and short directions.
|
|
|
|
#### Strategy Optimization Directions
|
|
1. Add intelligent stop-loss mechanism: Dynamic stop-loss based on ATR (Average True Range) can be introduced, or stop-loss distance can be set based on Bollinger Bands width, making the stop-loss more aligned with actual market volatility. This can be implemented by adding a stop parameter in the strategy.entry function or using the stop_loss parameter of the strategy.exit function.
|
|
|
|
2. Optimize entry filtering conditions: Consider adding trend confirmation indicators, such as Directional Movement Index (DMI) or Relative Strength Index (RSI), to filter low-quality signals. For example, only accept trend following signals when ADX>25, or only accept reversal signals in RSI overbought/oversold areas.
|
|
|
|
3. Adaptive parameter settings: Design Bollinger Bands parameters and exit condition parameters in an adaptive form, automatically adjusting based on market volatility. For example, calculate the volatility over the past N periods and dynamically adjust the standard deviation multiplier of Bollinger Bands accordingly.
|
|
|
|
4. Improve trailing stop profit mechanism: Make the trigger conditions and tracking distance for trailing stop profit adjustable, rather than fixed at 2 times risk distance. Consider adjusting the trailing stop profit retreat percentage based on volatility characteristics of different time periods.
|
|
|
|
5. Add time filtering: Introduce trading session filtering to avoid high volatility periods before market opening and closing, or add optimal trading time filters for specific markets.
|
|
|
|
6. Multi-timeframe analysis: Integrate multi-timeframe analysis framework, requiring the trend direction of higher timeframes to be consistent with the current trading direction to improve signal quality. For example, only accept long signals on a 4-hour chart when the daily trend is upward.
|
|
|
|
7. Optimize money management: Add position calculation logic based on volatility, increasing positions in low volatility environments and decreasing positions in high volatility environments, to balance risk and return.
|
|
|
|
#### Conclusion
|
|
The Multi-level Bollinger Bands Trend Following and Reversal Trading Strategy is a comprehensively designed trading system that effectively manages risk while capturing market opportunities through the dynamic characteristics of the Bollinger Bands indicator combined with multi-level exit rules. The greatest advantage of this strategy lies in its flexibility and adaptability, allowing it to find trading opportunities in different market environments and adapt to different trading instruments and time periods through parameter adjustments.
|
|
|
|
Although the strategy has some risk points, such as the lack of a clear stop-loss mechanism and parameter sensitivity, through the optimization directions proposed in this article, such as adding intelligent stop-loss, optimizing entry filtering conditions, adaptive parameter settings, etc., the robustness and profitability of the strategy can be further enhanced.
|
|
|
|
For traders, it is recommended to conduct thorough backtesting before actual application and adjust parameters according to specific market characteristics. At the same time, this strategy should be used as part of a complete trading system, combined with other technical and fundamental analysis, to develop comprehensive trading decisions.[/trans]
|
|
|
|
|
|
|
|
> Source (PineScript)
|
|
|
|
``` pinescript
|
|
/*backtest
|
|
start: 2024-04-01 00:00:00
|
|
end: 2025-03-31 00:00:00
|
|
period: 6d
|
|
basePeriod: 6d
|
|
exchanges: [{"eid":"Futures_Binance","currency":"ETH_USDT"}]
|
|
*/
|
|
|
|
//@version=6
|
|
strategy("Bollinger Bands Strategy", overlay=true)
|
|
|
|
// 輸入參數
|
|
length = input.int(20, "BB Length", minval=1, group="布林帶設定")
|
|
mult = input.float(2.0, "BB Multiplier", minval=0.001, maxval=50, group="布林帶設定")
|
|
X = input.int(3, "Exit Condition 1 Bars (X)", minval=1, group="出場設定")
|
|
Y = input.int(10, "Exit Condition 2 Bars (Y)", minval=1, group="出場設定")
|
|
Z = input.float(30.0, "Trail Profit Retreat Z%", minval=1.0, maxval=100.0, step=1.0, group="出場設定")
|
|
|
|
// 計算布林帶
|
|
source = close
|
|
basis = ta.sma(source, length) // 20 期均線
|
|
dev = mult * ta.stdev(source, length) // 標準差
|
|
upper = basis + dev // 上緣
|
|
lower = basis - dev // 下緣
|
|
mid1 = upper - (upper - basis)/3
|
|
mid2 = lower + (basis - lower)/3
|
|
|
|
// 繪製布林帶
|
|
plot(basis, "Basis", color=color.gray)
|
|
plot(upper, "Upper", color=color.blue)
|
|
plot(lower, "Lower", color=color.blue)
|
|
plot(mid1,"mid1",color = color.yellow)
|
|
plot(mid2,"mid2",color = color.yellow)
|
|
//fill(upper, lower, color=color.new(color.blue, 90), title="BB Fill")
|
|
|
|
// 進場條件
|
|
longEntry = ta.crossover(source, lower) or (low < lower and close > lower)
|
|
shortEntry = ta.crossunder(source, upper) or (high > upper and close < upper)
|
|
|
|
// 進場執行
|
|
if (longEntry)
|
|
strategy.entry("Long", strategy.long)
|
|
|
|
if (shortEntry)
|
|
strategy.entry("Short", strategy.short)
|
|
|
|
// 出場條件變數
|
|
var float longEntryPrice = na
|
|
var float shortEntryPrice = na
|
|
var int longBarsSinceEntry = 0
|
|
var int shortBarsSinceEntry = 0
|
|
|
|
// 更新持倉狀態
|
|
if (strategy.position_size > 0) // 做多持倉
|
|
if (na(longEntryPrice)) // 記錄進場價格和起始計數
|
|
longEntryPrice := strategy.position_avg_price
|
|
longBarsSinceEntry := 0
|
|
longBarsSinceEntry := longBarsSinceEntry + 1
|
|
|
|
if (strategy.position_size < 0) // 做空持倉
|
|
if (na(shortEntryPrice))
|
|
shortEntryPrice := strategy.position_avg_price
|
|
shortBarsSinceEntry := 0
|
|
shortBarsSinceEntry := shortBarsSinceEntry + 1
|
|
|
|
// 做多出場條件
|
|
if (strategy.position_size > 0)
|
|
// 條件 1:第 X 根 K 線後,收盤價 < lower + (basis - lower) / 3
|
|
longExitLevel1 = lower + (basis - lower) / 3
|
|
if (longBarsSinceEntry >= X and close < longExitLevel1)
|
|
strategy.close("Long", comment="Long Exit Condition 1")
|
|
|
|
// 條件 2:第 Y 根 K 線後,收盤價 < basis
|
|
if (longBarsSinceEntry >= Y and close < basis)
|
|
strategy.close("Long", comment="Long Exit Condition 2")
|
|
|
|
// 條件 3:移動停利(收盤價 > upper 觸發)
|
|
distanceLong = longEntryPrice - lower
|
|
trailPriceLong = longEntryPrice + (distanceLong * 2) // 假設 2 倍風險距離作為觸發點,可調整
|
|
trailOffsetLong = distanceLong * (1 - Z / 100)
|
|
strategy.exit("Long Trail", "Long", trail_price=trailPriceLong, trail_offset=trailOffsetLong)
|
|
|
|
// 做空出場條件
|
|
if (strategy.position_size < 0)
|
|
// 條件 1:第 X 根 K 線後,收盤價 > upper - (upper - basis) / 3
|
|
shortExitLevel1 = upper - (upper - basis) / 3
|
|
if (shortBarsSinceEntry >= X and close > shortExitLevel1)
|
|
strategy.close("Short", comment="Short Exit Condition 1")
|
|
|
|
// 條件 2:第 Y 根 K 線後,收盤價 > basis
|
|
if (shortBarsSinceEntry >= Y and close > basis)
|
|
strategy.close("Short", comment="Short Exit Condition 2")
|
|
|
|
// 條件 3:移動停利(收盤價 < lower 觸發)
|
|
distanceShort = upper - shortEntryPrice
|
|
trailPriceShort = shortEntryPrice - (distanceShort * 2) // 假設 2 倍風險距離作為觸發點,可調整
|
|
trailOffsetShort = distanceShort * (1 - Z / 100)
|
|
strategy.exit("Short Trail", "Short", trail_price=trailPriceShort, trail_offset=trailOffsetShort)
|
|
|
|
// 清除變數(當持倉結束時)
|
|
if (strategy.position_size == 0)
|
|
longEntryPrice := na
|
|
shortEntryPrice := na
|
|
longBarsSinceEntry := 0
|
|
shortBarsSinceEntry := 0
|
|
```
|
|
|
|
> Detail
|
|
|
|
https://www.fmz.com/strategy/489010
|
|
|
|
> Last Modified
|
|
|
|
2025-04-01 10:16:29
|