
17 KiB
Name
多层布林通道支撑阻力价格突破交易策略-Multi-Layer-Bollinger-Bands-Support-Resistance-Price-Breakout-Trading-Strategy
Author
ianzeng123
Strategy Description
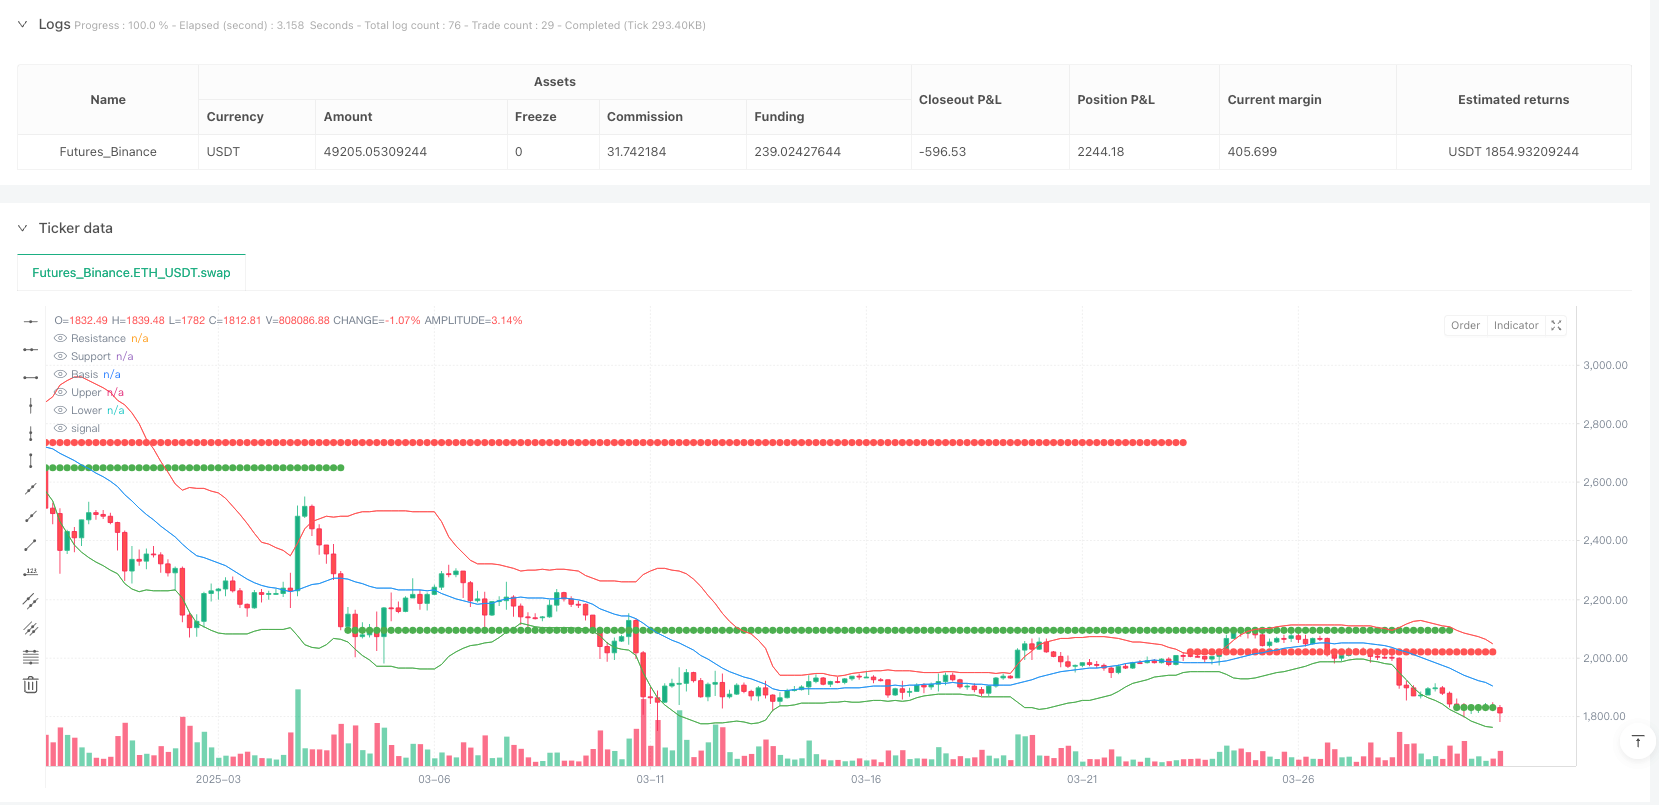
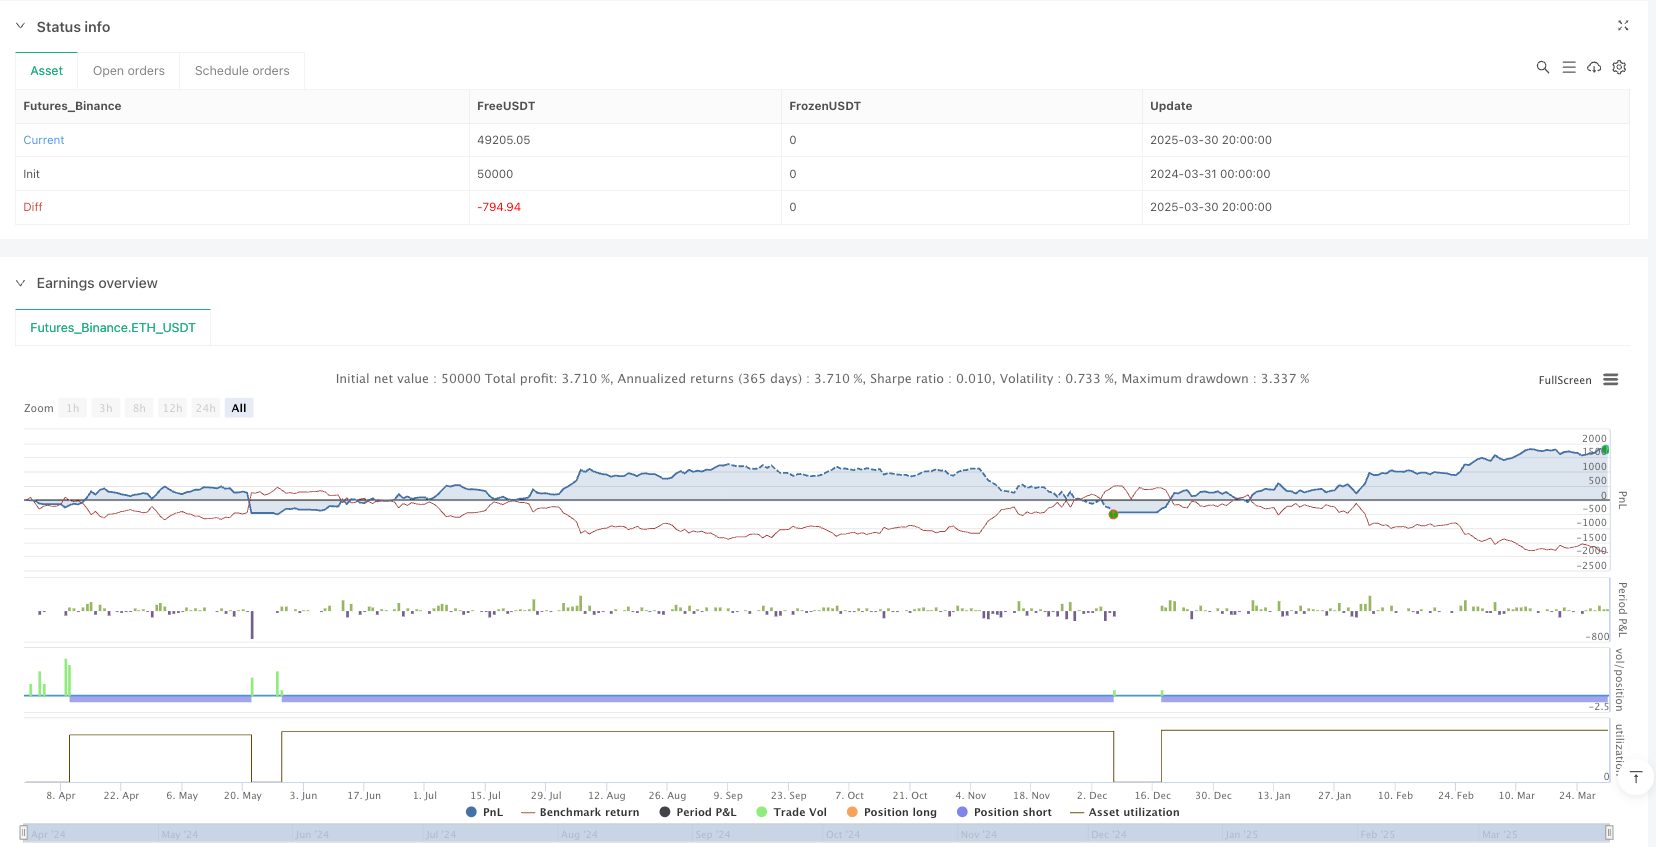
[trans]
概述
多层布林通道支撑阻力价格突破交易策略是一种结合了技术分析指标与价格行为理论的量化交易系统。该策略主要基于布林带(Bollinger Bands)指标与支撑阻力位的协同作用,在价格突破特定区域时产生交易信号。系统通过识别重要的支撑位和阻力位,并结合布林带的统计波动范围,在价格达到超买或超卖区域且同时违背关键价格水平时进行交易。该策略还整合了风险管理机制,通过预设的止损水平和基于风险比例的止盈目标,确保每笔交易都有明确的风险收益比。
策略原理
该策略的核心原理基于以下几个关键组成部分:
-
布林带参数设置: 系统使用20周期的简单移动平均线(SMA)作为布林带的中轨,并设定标准差乘数为2.0来计算上下轨。这一配置能够囊括约95%的价格波动,使得突破上下轨的行情具有统计学意义。
-
支撑阻力位识别: 策略通过5周期内最高价和最低价的历史数据来确定潜在的阻力位和支撑位。当价格在这些关键水平附近(±0.05%)波动时,系统会将其记录为有效的支撑或阻力水平。
-
入场条件精确定义:
- 多头入场: 当价格低于布林带下轨且同时低于有效支撑位一定距离(25个点位)时,系统产生买入信号。
- 空头入场: 当价格高于布林带上轨且同时高于有效阻力位一定距离(25个点位)时,系统产生卖出信号。
-
精细的风险管理:
- 止损设置: 系统为每笔交易设置15个点位的止损距离。
- 止盈设置: 止盈目标设定为止损距离的2倍,确保风险收益比为1:2。
-
零持仓条件: 策略设计为不重叠交易,只有在当前无持仓的情况下才会考虑新的入场信号。
策略优势
-
多重确认机制: 策略结合了技术指标(布林带)与价格结构(支撑阻力位)的双重确认,显著减少了虚假信号。当价格同时满足两个条件时才生成交易信号,提高了交易准确性。
-
统计学基础: 布林带基于统计学原理,上下轨代表了价格的波动范围。当价格突破这些边界时,往往意味着市场出现了统计上的异常波动,这为交易提供了数学基础。
-
明确的风险控制: 每笔交易都有预设的止损和止盈水平,风险收益比固定为1:2,这使得长期交易结果更具可预测性和一致性。
-
自适应性设计: 支撑阻力位是基于近期价格行为动态计算的,而不是静态设定的,这使得策略能够适应不同市场条件下的价格结构变化。
-
可视化交易信号: 策略通过绘制买卖箭头和改变K线颜色,使交易者能够直观地识别交易信号,便于实时监控和回测分析。
策略风险
-
假突破风险: 价格可能暂时突破支撑阻力位或布林带边界后又迅速回归,导致错误信号。解决方法可包括引入确认周期,要求价格在特定时间内保持突破状态。
-
横盘市场表现不佳: 在窄幅震荡市场中,布林带收窄,支撑阻力位也较为接近,可能导致过多交易信号和亏损。可以通过增加布林带宽度过滤器,在带宽低于特定阈值时暂停交易。
-
高波动性风险: 在重大新闻事件或极端市场条件下,价格可能剧烈波动并超过预设的止损水平,导致实际亏损超过预期。建议在已知的高波动性时期(如重要经济数据发布前)暂停交易或增加止损距离。
-
参数敏感性: 策略性能高度依赖于参数设置,包括布林带长度、标准差乘数、支撑阻力距离等。不同市场环境可能需要不同的参数设置,过度优化可能导致曲线拟合问题。
-
低流动性风险: 在交易量低的时段,实际执行价格可能与信号生成时的价格有显著差异,导致滑点增加。建议限制在主要交易时段内操作,并设置最大可接受滑点值。
策略优化方向
-
动态参数调整机制: 可以引入基于市场波动性的自适应参数系统。例如,在高波动性时期自动增加布林带标准差乘数,或根据ATR(真实波动幅度均值)动态调整止损距离。这样可以使策略更好地适应不同市场状态。
-
时间过滤器: 引入交易时间窗口过滤器,避开低流动性时段和已知的高波动性事件时段。这可以通过在策略代码中添加基于交易时间的条件判断来实现,有效减少因市场异常波动导致的虚假信号。
-
趋势过滤器: 增加更长周期的趋势判断指标,如50或200周期移动平均线,只在总体趋势方向上交易。例如,只在价格位于长期移动平均线上方时考虑做多信号,反之亦然。这样可以提高交易的胜率和盈利因子。
-
交易量确认: 增加交易量分析组件,要求价格突破时伴随有显著的交易量增加,以确认突破的有效性。这可以通过比较当前交易量与近期平均交易量的相对关系来实现。
-
动态止盈机制: 引入追踪止损功能,允许在盈利交易继续发展时锁定部分利润。可以基于ATR或价格波动的百分比设置移动止损,使策略能够在强趋势行情中获取更多利润。
总结
多层布林通道支撑阻力价格突破交易策略是一个结合了统计学原理与技术分析的量化交易系统。它通过布林带指标和动态支撑阻力位的协同作用,在价格突破关键水平时产生交易信号。策略内置的风险管理机制确保了交易的风险收益比保持在合理水平,而明确的入场和出场规则减少了情绪因素对交易决策的干扰。
该策略特别适合在有明显趋势或者区间突破的市场环境中使用,但在低波动或高度不确定的市场中可能需要谨慎操作。通过实施建议的优化措施,如增加趋势过滤器、动态参数调整和交易量确认,可以进一步提升策略的稳健性和适应性。最终,任何交易策略的成功都取决于严格的风险控制和持续的性能监控,这一点在使用本策略时尤为重要。
||
Overview
The Multi-Layer Bollinger Bands Support Resistance Price Breakout Trading Strategy is a quantitative trading system that combines technical indicators with price action theory. This strategy primarily relies on the collaborative effect of Bollinger Bands indicators and support/resistance levels to generate trading signals when prices break through specific zones. The system identifies important support and resistance levels and integrates them with the statistical volatility range of Bollinger Bands to execute trades when prices reach overbought or oversold areas while simultaneously violating key price levels. The strategy also incorporates risk management mechanisms through preset stop-loss levels and profit targets based on risk ratios, ensuring each trade has a clear risk-reward profile.
Strategy Principles
The core principles of this strategy are based on several key components:
-
Bollinger Bands Configuration: The system uses a 20-period Simple Moving Average (SMA) as the middle band of the Bollinger Bands, with a standard deviation multiplier of 2.0 to calculate the upper and lower bands. This configuration encompasses approximately 95% of price movements, making breakouts beyond the bands statistically significant.
-
Support/Resistance Identification: The strategy identifies potential resistance and support levels using historical data of highest and lowest prices within a 5-period range. When prices fluctuate near these key levels (±0.05%), the system records them as valid support or resistance levels.
-
Precise Entry Condition Definitions:
- Long Entry: The system generates a buy signal when the price falls below the lower Bollinger Band and simultaneously drops below the valid support level by a certain distance (25 pips).
- Short Entry: The system generates a sell signal when the price rises above the upper Bollinger Band and simultaneously exceeds the valid resistance level by a certain distance (25 pips).
-
Refined Risk Management:
- Stop-Loss Setting: The system sets a 15-pip stop-loss distance for each trade.
- Take-Profit Setting: The profit target is set at twice the stop-loss distance, ensuring a 1:2 risk-reward ratio.
-
Zero Position Condition: The strategy is designed to avoid overlapping trades, only considering new entry signals when there is currently no open position.
Strategy Advantages
-
Multiple Confirmation Mechanism: The strategy combines technical indicators (Bollinger Bands) with price structure (support/resistance levels) for dual confirmation, significantly reducing false signals. Trading signals are only generated when prices simultaneously meet both conditions, improving trading accuracy.
-
Statistical Foundation: Bollinger Bands are based on statistical principles, with the upper and lower bands representing price volatility ranges. When prices break through these boundaries, it often indicates statistically abnormal market movements, providing a mathematical basis for trading.
-
Clear Risk Control: Each trade has preset stop-loss and take-profit levels, with a fixed risk-reward ratio of 1:2, making long-term trading results more predictable and consistent.
-
Adaptive Design: Support and resistance levels are dynamically calculated based on recent price action rather than statically set, allowing the strategy to adapt to price structure changes under different market conditions.
-
Visualized Trading Signals: The strategy plots buy/sell arrows and changes candle colors, allowing traders to visually identify trading signals, facilitating real-time monitoring and backtesting analysis.
Strategy Risks
-
False Breakout Risk: Prices may temporarily break through support/resistance levels or Bollinger Band boundaries before quickly reverting, leading to erroneous signals. Solutions may include introducing confirmation periods, requiring prices to maintain breakout status for a specific time.
-
Poor Performance in Ranging Markets: In narrow-range fluctuating markets, Bollinger Bands contract and support/resistance levels are also closer, potentially leading to excessive trading signals and losses. This can be addressed by adding a Bollinger Band width filter to pause trading when the band width falls below a specific threshold.
-
High Volatility Risk: During major news events or extreme market conditions, prices may fluctuate dramatically and exceed preset stop-loss levels, causing actual losses to exceed expectations. It is advisable to pause trading during known high-volatility periods (such as before important economic data releases) or increase stop-loss distances.
-
Parameter Sensitivity: Strategy performance is highly dependent on parameter settings, including Bollinger Band length, standard deviation multiplier, support/resistance distance, etc. Different market environments may require different parameter settings, and excessive optimization may lead to curve-fitting issues.
-
Low Liquidity Risk: During low-volume trading sessions, actual execution prices may differ significantly from the prices at signal generation, leading to increased slippage. It is recommended to limit operations to major trading sessions and set maximum acceptable slippage values.
Strategy Optimization Directions
-
Dynamic Parameter Adjustment Mechanism: An adaptive parameter system based on market volatility can be introduced. For example, automatically increasing the Bollinger Band standard deviation multiplier during high-volatility periods, or dynamically adjusting stop-loss distances based on ATR (Average True Range). This allows the strategy to better adapt to different market states.
-
Time Filter: Introduce trading time window filters to avoid low liquidity sessions and known high-volatility event periods. This can be implemented by adding time-based conditional judgments in the strategy code, effectively reducing false signals caused by abnormal market volatility.
-
Trend Filter: Add longer-period trend determination indicators, such as 50 or 200-period moving averages, to only trade in the direction of the overall trend. For example, only considering long signals when prices are above the long-term moving average, and vice versa. This can improve the win rate and profit factor of trades.
-
Volume Confirmation: Add a volume analysis component, requiring significant volume increases to accompany price breakouts to confirm their validity. This can be achieved by comparing the current trading volume with the relative relationship to recent average trading volumes.
-
Dynamic Take-Profit Mechanism: Introduce trailing stop functionality to lock in partial profits as profitable trades continue to develop. Moving stops can be set based on ATR or percentage of price movements, allowing the strategy to capture more profits in strong trending markets.
Summary
The Multi-Layer Bollinger Bands Support Resistance Price Breakout Trading Strategy is a quantitative trading system that combines statistical principles with technical analysis. It generates trading signals when prices break through key levels through the collaborative action of Bollinger Bands indicators and dynamic support/resistance levels. The built-in risk management mechanism ensures that the risk-reward ratio of trades remains at a reasonable level, while clear entry and exit rules reduce the interference of emotional factors on trading decisions.
This strategy is particularly suitable for use in market environments with obvious trends or range breakouts but may require cautious operation in low-volatility or highly uncertain markets. By implementing the suggested optimization measures, such as adding trend filters, dynamic parameter adjustments, and volume confirmation, the robustness and adaptability of the strategy can be further enhanced. Ultimately, the success of any trading strategy depends on strict risk control and continuous performance monitoring, which is particularly important when using this strategy. [/trans]
Source (PineScript)
/*backtest
start: 2024-03-31 00:00:00
end: 2025-03-31 00:00:00
period: 4h
basePeriod: 4h
exchanges: [{"eid":"Futures_Binance","currency":"ETH_USDT"}]
*/

//@version=6
strategy("Gold BB Support/Resistance Strategy", overlay=true, margin_long=100, margin_short=100)

// Inputs
length = input(20, title="Bollinger Band Length")
mult = input(2.0, title="Standard Deviation")
supportResistancePips = input(25, title="Support/Resistance Distance (pips)")
stopLossPips = input(15, title="Stop Loss (pips)")
takeProfitRatio = input(2.0, title="Take Profit (x risk)")

// Convert pips to price (gold typically has 2 decimal places)
pipSize = syminfo.mintick * 10  // 0.1 for XAU/USD
supportDistance = supportResistancePips * pipSize
stopLossDistance = stopLossPips * pipSize

// Bollinger Bands
basis = ta.sma(close, length)
dev = mult * ta.stdev(close, length)
upper = basis + dev
lower = basis - dev

// Support/Resistance Detection
supportLevel = ta.valuewhen(ta.lowest(low, 5)[1] == low[1], low[1], 0)
resistanceLevel = ta.valuewhen(ta.highest(high, 5)[1] == high[1], high[1], 0)

// Identify valid support/resistance (needs at least 2 touches)
validSupport = ta.valuewhen(low <= supportLevel * 1.0005 and low >= supportLevel * 0.9995, supportLevel, 0)
validResistance = ta.valuewhen(high >= resistanceLevel * 0.9995 and high <= resistanceLevel * 1.0005, resistanceLevel, 0)

// Entry Conditions
longCondition = close < lower and close <= (validSupport - supportDistance) and strategy.position_size == 0
shortCondition = close > upper and close >= (validResistance + supportDistance) and strategy.position_size == 0

// Exit Conditions
stopLossPriceLong = low - stopLossDistance
takeProfitPriceLong = strategy.position_avg_price + (stopLossDistance * takeProfitRatio)

stopLossPriceShort = high + stopLossDistance
takeProfitPriceShort = strategy.position_avg_price - (stopLossDistance * takeProfitRatio)

// Strategy Execution
if (longCondition)
    strategy.entry("BB Long", strategy.long)
    strategy.exit("Exit Long", "BB Long", stop=stopLossPriceLong, limit=takeProfitPriceLong)

if (shortCondition)
    strategy.entry("BB Short", strategy.short)
    strategy.exit("Exit Short", "BB Short", stop=stopLossPriceShort, limit=takeProfitPriceShort)

// Plotting
plot(basis, "Basis", color=color.blue)
plot(upper, "Upper", color=color.red)
plot(lower, "Lower", color=color.green)

// Plot support/resistance
plot(validSupport != 0 ? validSupport : na, "Support", color=color.green, style=plot.style_circles, linewidth=2)
plot(validResistance != 0 ? validResistance : na, "Resistance", color=color.red, style=plot.style_circles, linewidth=2)

// Buy/Sell Arrows
plotshape(series=longCondition, title="Buy Signal", style=shape.triangleup, location=location.belowbar, color=color.green, size=size.normal)
plotshape(series=shortCondition, title="Sell Signal", style=shape.triangledown, location=location.abovebar, color=color.red, size=size.normal)

// Highlight candle on signal
barcolor(longCondition ? color.green : shortCondition ? color.red : na)
Detail
https://www.fmz.com/strategy/489056
Last Modified
2025-04-01 16:55:00