
244 lines
13 KiB
Markdown
244 lines
13 KiB
Markdown
|
|
> Name
|
|
|
|
多周期Hull移动平均线交叉策略-Multi-Timeframe-Hull-Moving-Average-Crossover-Strategy
|
|
|
|
> Author
|
|
|
|
ChaoZhang
|
|
|
|
> Strategy Description
|
|
|
|
|
|
|
|
[trans]
|
|
#### 概述
|
|
|
|
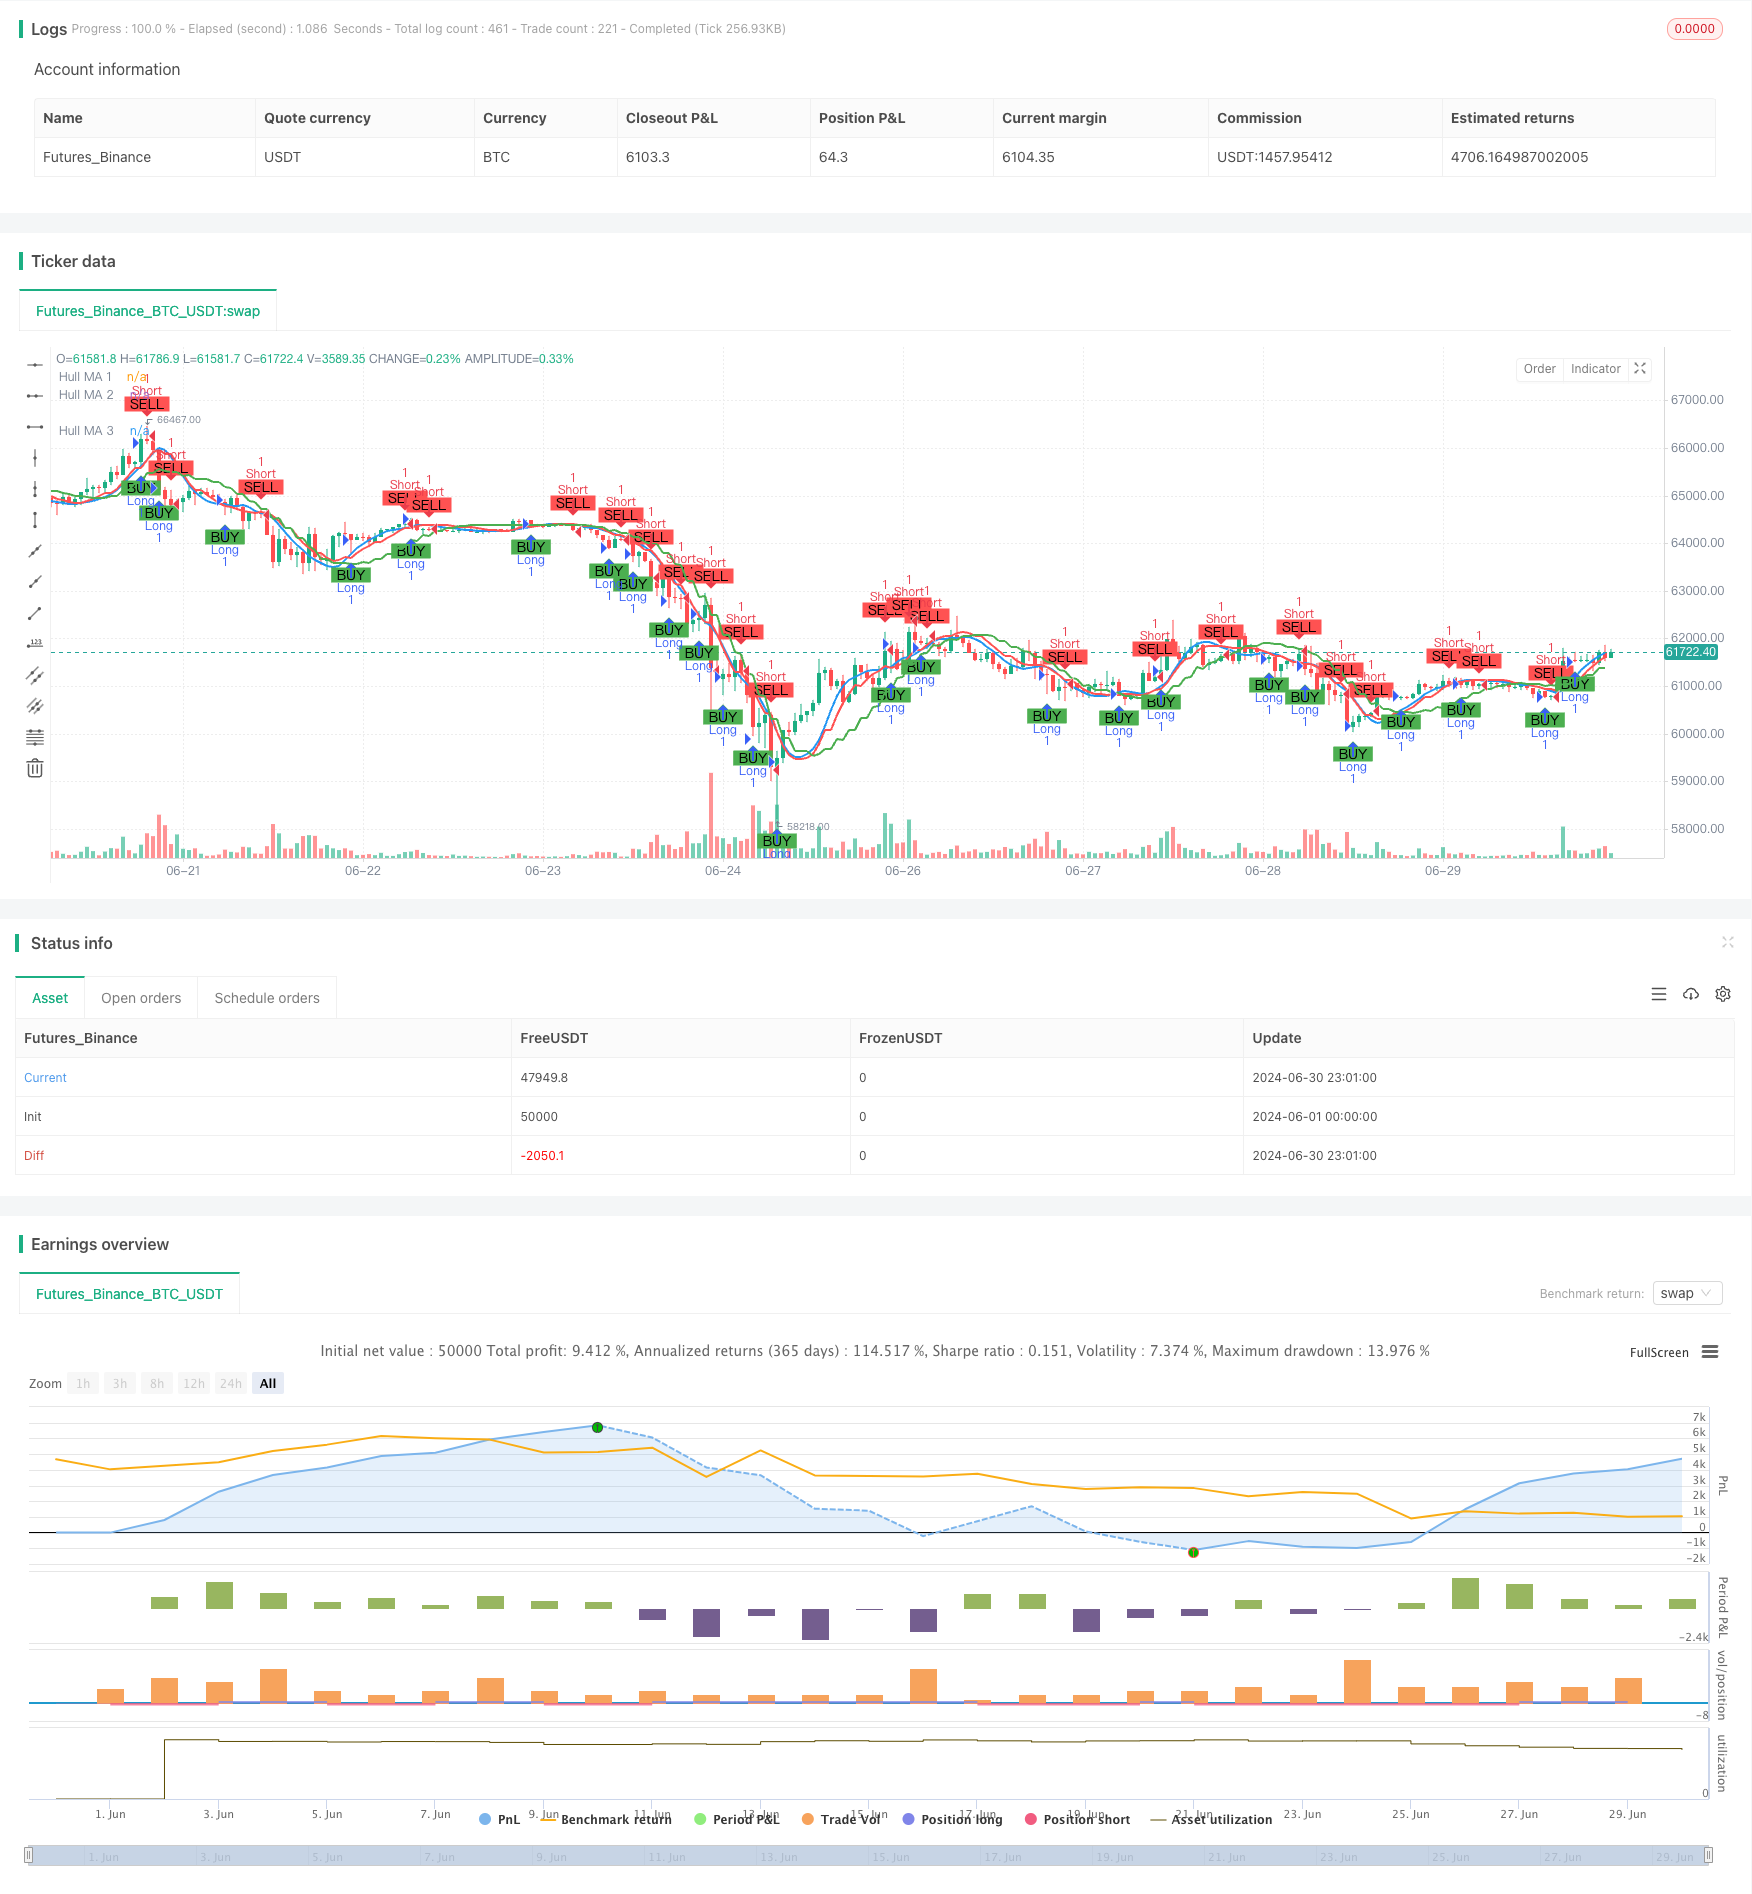
多周期Hull移动平均线交叉策略是一个基于Hull移动平均线(HMA)的量化交易策略。该策略利用不同时间周期的HMA指标来识别市场趋势并生成交易信号。策略的核心是通过观察短期HMA与中期HMA的交叉来确定入场和出场时机,同时使用长期HMA作为整体趋势的参考。这种多周期approach能够有效地过滤噪音,提高交易决策的准确性。
|
|
|
|
#### 策略原理
|
|
|
|
该策略的核心原理是利用Hull移动平均线(HMA)的快速响应特性和多周期分析的优势。具体实现如下:
|
|
|
|
1. 计算三个不同周期的HMA:
|
|
- HMA 1: 25分钟周期
|
|
- HMA 2: 75分钟周期
|
|
- HMA 3: 125分钟周期
|
|
|
|
2. 交易信号生成:
|
|
- 做多信号: 当HMA 1上穿HMA 2时
|
|
- 做空信号: 当HMA 1下穿HMA 2时
|
|
|
|
3. HMA 3作为长期趋势指标,虽然不直接参与信号生成,但可用于判断整体市场趋势。
|
|
|
|
4. 策略使用固定比例的账户权益(10%)作为每次交易的资金量。
|
|
|
|
5. 通过PlotShape函数在图表上标记买入和卖出信号,增强可视化效果。
|
|
|
|
6. 设置了长短仓位的警报条件,便于实时监控市场机会。
|
|
|
|
#### 策略优势
|
|
|
|
1. 降低滞后性: Hull移动平均线本身就具有较低的滞后性,比传统移动平均线更快地响应价格变化。
|
|
|
|
2. 多周期分析: 通过结合不同时间周期的HMA,策略能够同时捕捉短期、中期和长期趋势,提高交易的准确性和稳定性。
|
|
|
|
3. 噪音过滤: 使用较长周期(75分钟和125分钟)的HMA可以有效过滤短期市场噪音,减少虚假信号。
|
|
|
|
4. 灵活性: 策略允许用户自定义各个HMA的长度和数据源,适应不同的市场环境和交易风格。
|
|
|
|
5. 风险管理: 使用账户权益的固定比例进行交易,有助于控制风险敞口。
|
|
|
|
6. 可视化: 通过在图表上直观显示买卖信号,帮助交易者更好地理解和验证策略逻辑。
|
|
|
|
7. 实时警报: 设置了交易信号警报,使得交易者能够及时把握市场机会。
|
|
|
|
#### 策略风险
|
|
|
|
1. 趋势反转风险: 在强趋势市场中,策略可能会频繁产生信号,导致过度交易和不必要的成本。
|
|
|
|
2. 横盘市场风险: 在没有明显趋势的市场中,HMA交叉可能会产生大量虚假信号,影响策略表现。
|
|
|
|
3. 参数敏感性: 策略性能高度依赖于所选择的HMA长度和时间周期,不同的参数组合可能导致截然不同的结果。
|
|
|
|
4. 滑点和交易成本: 频繁的交易可能导致较高的滑点和交易成本,尤其是在流动性较低的市场中。
|
|
|
|
5. 技术依赖性: 策略完全依赖于技术指标,忽视了基本面因素,可能在重大新闻或事件发生时表现不佳。
|
|
|
|
6. 过度拟合风险: 如果在历史数据上过度优化参数,可能导致策略在实盘交易中表现不佳。
|
|
|
|
#### 策略优化方向
|
|
|
|
1. 引入趋势过滤器: 可以考虑使用HMA 3作为趋势过滤器,只在长期趋势方向上开仓,以减少逆势交易。
|
|
|
|
2. 动态调整参数: 实现一个自适应机制,根据市场波动性动态调整HMA的长度和时间周期,以适应不同的市场环境。
|
|
|
|
3. 增加止损和止盈机制: 引入基于ATR或固定百分比的止损和止盈规则,以更好地控制风险和锁定利润。
|
|
|
|
4. 优化仓位管理: 实现更复杂的仓位管理策略,如基于波动性或账户盈亏的动态调整仓位大小。
|
|
|
|
5. 整合其他技术指标: 结合如RSI、MACD等其他技术指标,构建更全面的入场和出场条件。
|
|
|
|
6. 回测和优化: 在不同的市场条件和时间框架下进行广泛的回测,以找到最优的参数组合。
|
|
|
|
7. 考虑基本面因素: 引入对重要经济数据发布或公司事件的考虑,在特定时期调整策略行为。
|
|
|
|
8. 实现部分仓位交易: 允许策略根据信号强度执行部分仓位交易,而不是每次都全仓进出。
|
|
|
|
#### 总结
|
|
|
|
多周期Hull移动平均线交叉策略是一个结合了Hull移动平均线快速响应特性和多周期分析优势的量化交易策略。通过观察不同时间周期HMA之间的交叉关系,策略能够有效识别市场趋势并生成交易信号。其优势在于降低了传统移动平均线的滞后性,同时通过多周期分析提高了信号的可靠性。然而,策略也面临着趋势反转、参数敏感性等风险。
|
|
|
|
为了进一步提高策略的稳健性和盈利能力,可以考虑引入趋势过滤器、动态参数调整、优化仓位管理等方向进行改进。同时,结合其他技术指标和基本面因素,可以构建一个更全面、更适应不同市场环境的交易系统。
|
|
|
|
总的来说,这个策略为交易者提供了一个有潜力的框架,通过持续的优化和完善,有望成为一个强大的量化交易工具。然而,在实际应用中,交易者仍需谨慎评估市场风险,并根据个人风险承受能力和交易目标进行相应的调整。
|
|
|
|
||
|
|
|
|
#### Overview
|
|
|
|
The Multi-Timeframe Hull Moving Average Crossover Strategy is a quantitative trading strategy based on the Hull Moving Average (HMA) indicator. This strategy utilizes HMA indicators from different timeframes to identify market trends and generate trading signals. The core of the strategy is to determine entry and exit points by observing the crossovers between short-term and medium-term HMAs, while using a long-term HMA as a reference for the overall trend. This multi-timeframe approach effectively filters out noise and improves the accuracy of trading decisions.
|
|
|
|
#### Strategy Principles
|
|
|
|
The core principle of this strategy is to leverage the fast response characteristics of the Hull Moving Average (HMA) and the advantages of multi-timeframe analysis. The specific implementation is as follows:
|
|
|
|
1. Calculate three HMAs with different periods:
|
|
- HMA 1: 25-minute timeframe
|
|
- HMA 2: 75-minute timeframe
|
|
- HMA 3: 125-minute timeframe
|
|
|
|
2. Trading signal generation:
|
|
- Long signal: When HMA 1 crosses above HMA 2
|
|
- Short signal: When HMA 1 crosses below HMA 2
|
|
|
|
3. HMA 3 serves as a long-term trend indicator, although it doesn't directly participate in signal generation, it can be used to judge the overall market trend.
|
|
|
|
4. The strategy uses a fixed percentage of account equity (10%) as the fund size for each trade.
|
|
|
|
5. Buy and sell signals are marked on the chart using the PlotShape function, enhancing visualization.
|
|
|
|
6. Alert conditions for long and short positions are set up, facilitating real-time monitoring of market opportunities.
|
|
|
|
#### Strategy Advantages
|
|
|
|
1. Reduced lag: The Hull Moving Average itself has lower lag and responds faster to price changes compared to traditional moving averages.
|
|
|
|
2. Multi-timeframe analysis: By combining HMAs from different timeframes, the strategy can capture short-term, medium-term, and long-term trends simultaneously, improving trading accuracy and stability.
|
|
|
|
3. Noise filtering: Using HMAs with longer periods (75 and 125 minutes) can effectively filter out short-term market noise, reducing false signals.
|
|
|
|
4. Flexibility: The strategy allows users to customize the length and data source of each HMA, adapting to different market environments and trading styles.
|
|
|
|
5. Risk management: Using a fixed percentage of account equity for trading helps control risk exposure.
|
|
|
|
6. Visualization: Displaying buy and sell signals directly on the chart helps traders better understand and verify the strategy logic.
|
|
|
|
7. Real-time alerts: Trading signal alerts are set up, enabling traders to seize market opportunities in a timely manner.
|
|
|
|
#### Strategy Risks
|
|
|
|
1. Trend reversal risk: In strong trending markets, the strategy may generate frequent signals, leading to overtrading and unnecessary costs.
|
|
|
|
2. Sideways market risk: In markets without clear trends, HMA crossovers may produce numerous false signals, affecting strategy performance.
|
|
|
|
3. Parameter sensitivity: Strategy performance highly depends on the chosen HMA lengths and timeframes; different parameter combinations may lead to drastically different results.
|
|
|
|
4. Slippage and trading costs: Frequent trading may result in higher slippage and trading costs, especially in markets with lower liquidity.
|
|
|
|
5. Technical dependency: The strategy relies entirely on technical indicators, ignoring fundamental factors, which may perform poorly when significant news or events occur.
|
|
|
|
6. Overfitting risk: Excessive optimization of parameters on historical data may lead to poor performance in live trading.
|
|
|
|
#### Strategy Optimization Directions
|
|
|
|
1. Introduce trend filter: Consider using HMA 3 as a trend filter, only opening positions in the direction of the long-term trend to reduce counter-trend trading.
|
|
|
|
2. Dynamic parameter adjustment: Implement an adaptive mechanism to dynamically adjust HMA lengths and timeframes based on market volatility, adapting to different market environments.
|
|
|
|
3. Add stop-loss and take-profit mechanisms: Introduce stop-loss and take-profit rules based on ATR or fixed percentages to better control risk and lock in profits.
|
|
|
|
4. Optimize position management: Implement more sophisticated position management strategies, such as dynamically adjusting position sizes based on volatility or account profit/loss.
|
|
|
|
5. Integrate other technical indicators: Combine other technical indicators such as RSI, MACD to build more comprehensive entry and exit conditions.
|
|
|
|
6. Backtesting and optimization: Conduct extensive backtesting under different market conditions and timeframes to find the optimal parameter combinations.
|
|
|
|
7. Consider fundamental factors: Introduce considerations for important economic data releases or company events, adjusting strategy behavior during specific periods.
|
|
|
|
8. Implement partial position trading: Allow the strategy to execute partial position trades based on signal strength, rather than always entering or exiting with full positions.
|
|
|
|
#### Conclusion
|
|
|
|
The Multi-Timeframe Hull Moving Average Crossover Strategy is a quantitative trading strategy that combines the fast response characteristics of the Hull Moving Average with the advantages of multi-timeframe analysis. By observing the crossover relationships between HMAs of different timeframes, the strategy can effectively identify market trends and generate trading signals. Its advantages lie in reducing the lag of traditional moving averages while improving signal reliability through multi-timeframe analysis. However, the strategy also faces risks such as trend reversals and parameter sensitivity.
|
|
|
|
To further improve the robustness and profitability of the strategy, considerations can be made to introduce trend filters, dynamic parameter adjustments, and optimize position management. Additionally, combining other technical indicators and fundamental factors can build a more comprehensive trading system that adapts to different market environments.
|
|
|
|
Overall, this strategy provides traders with a promising framework that, through continuous optimization and refinement, has the potential to become a powerful quantitative trading tool. However, in practical applications, traders still need to carefully assess market risks and make appropriate adjustments based on individual risk tolerance and trading objectives.
|
|
|
|
[/trans]
|
|
|
|
|
|
|
|
> Source (PineScript)
|
|
|
|
``` pinescript
|
|
/*backtest
|
|
start: 2024-06-01 00:00:00
|
|
end: 2024-06-30 23:59:59
|
|
period: 1h
|
|
basePeriod: 15m
|
|
exchanges: [{"eid":"Futures_Binance","currency":"BTC_USDT"}]
|
|
*/
|
|
|
|
//@version=5
|
|
strategy(title='Hull v2 Strategy', shorttitle='V2 HMA', overlay=true)
|
|
|
|
// Hull MA 1
|
|
length_1 = input.int(20, minval=1, title="Length 1")
|
|
src_1 = input(close, title='Source 1')
|
|
timeframe_1 = input.timeframe('25')
|
|
hullma_1 = request.security(syminfo.tickerid, timeframe_1, ta.wma(2 * ta.wma(src_1, length_1 / 2) - ta.wma(src_1, length_1), math.round(math.sqrt(length_1))))
|
|
plot(hullma_1, title='Hull MA 1', color=color.blue, linewidth=2)
|
|
|
|
// Hull MA 2
|
|
length_2 = input.int(20, minval=1, title="Length 2")
|
|
src_2 = input(close, title='Source 2')
|
|
timeframe_2 = input.timeframe('75')
|
|
hullma_2 = request.security(syminfo.tickerid, timeframe_2, ta.wma(2 * ta.wma(src_2, length_2 / 2) - ta.wma(src_2, length_2), math.round(math.sqrt(length_2))))
|
|
plot(hullma_2, title='Hull MA 2', color=color.red, linewidth=2)
|
|
|
|
// Hull MA 3
|
|
length_3 = input.int(20, minval=1, title="Length 3")
|
|
src_3 = input(close, title='Source 3')
|
|
timeframe_3 = input.timeframe('125')
|
|
hullma_3 = request.security(syminfo.tickerid, timeframe_3, ta.wma(2 * ta.wma(src_3, length_3 / 2) - ta.wma(src_3, length_3), math.round(math.sqrt(length_3))))
|
|
plot(hullma_3, title='Hull MA 3', color=color.green, linewidth=2)
|
|
|
|
// Cross Strategy
|
|
longCondition = ta.crossover(hullma_1, hullma_2)
|
|
shortCondition = ta.crossunder(hullma_1, hullma_2)
|
|
// Entry and Exit
|
|
if (longCondition)
|
|
strategy.entry("Long", strategy.long)
|
|
if (shortCondition)
|
|
strategy.entry("Short", strategy.short)
|
|
|
|
// Plot Buy/Sell Signals
|
|
plotshape(series=longCondition, location=location.belowbar, color=color.green, style=shape.labelup, title='Buy Signal', text='BUY')
|
|
plotshape(series=shortCondition, location=location.abovebar, color=color.red, style=shape.labeldown, title='Sell Signal', text='SELL')
|
|
|
|
// Alerts
|
|
alertcondition(longCondition, title='Long Alert', message='Long Condition Met')
|
|
alertcondition(shortCondition, title='Short Alert', message='Short Condition Met')
|
|
|
|
```
|
|
|
|
> Detail
|
|
|
|
https://www.fmz.com/strategy/458047
|
|
|
|
> Last Modified
|
|
|
|
2024-07-29 14:44:25
|