
7.9 KiB
Name
多周期均线趋势跟踪结合RSI超买超卖动态优化策略-Multi-Period-EMA-Trend-Following-with-RSI-Overbought-Oversold-Dynamic-Optimization-Strategy
Author
ChaoZhang
Strategy Description
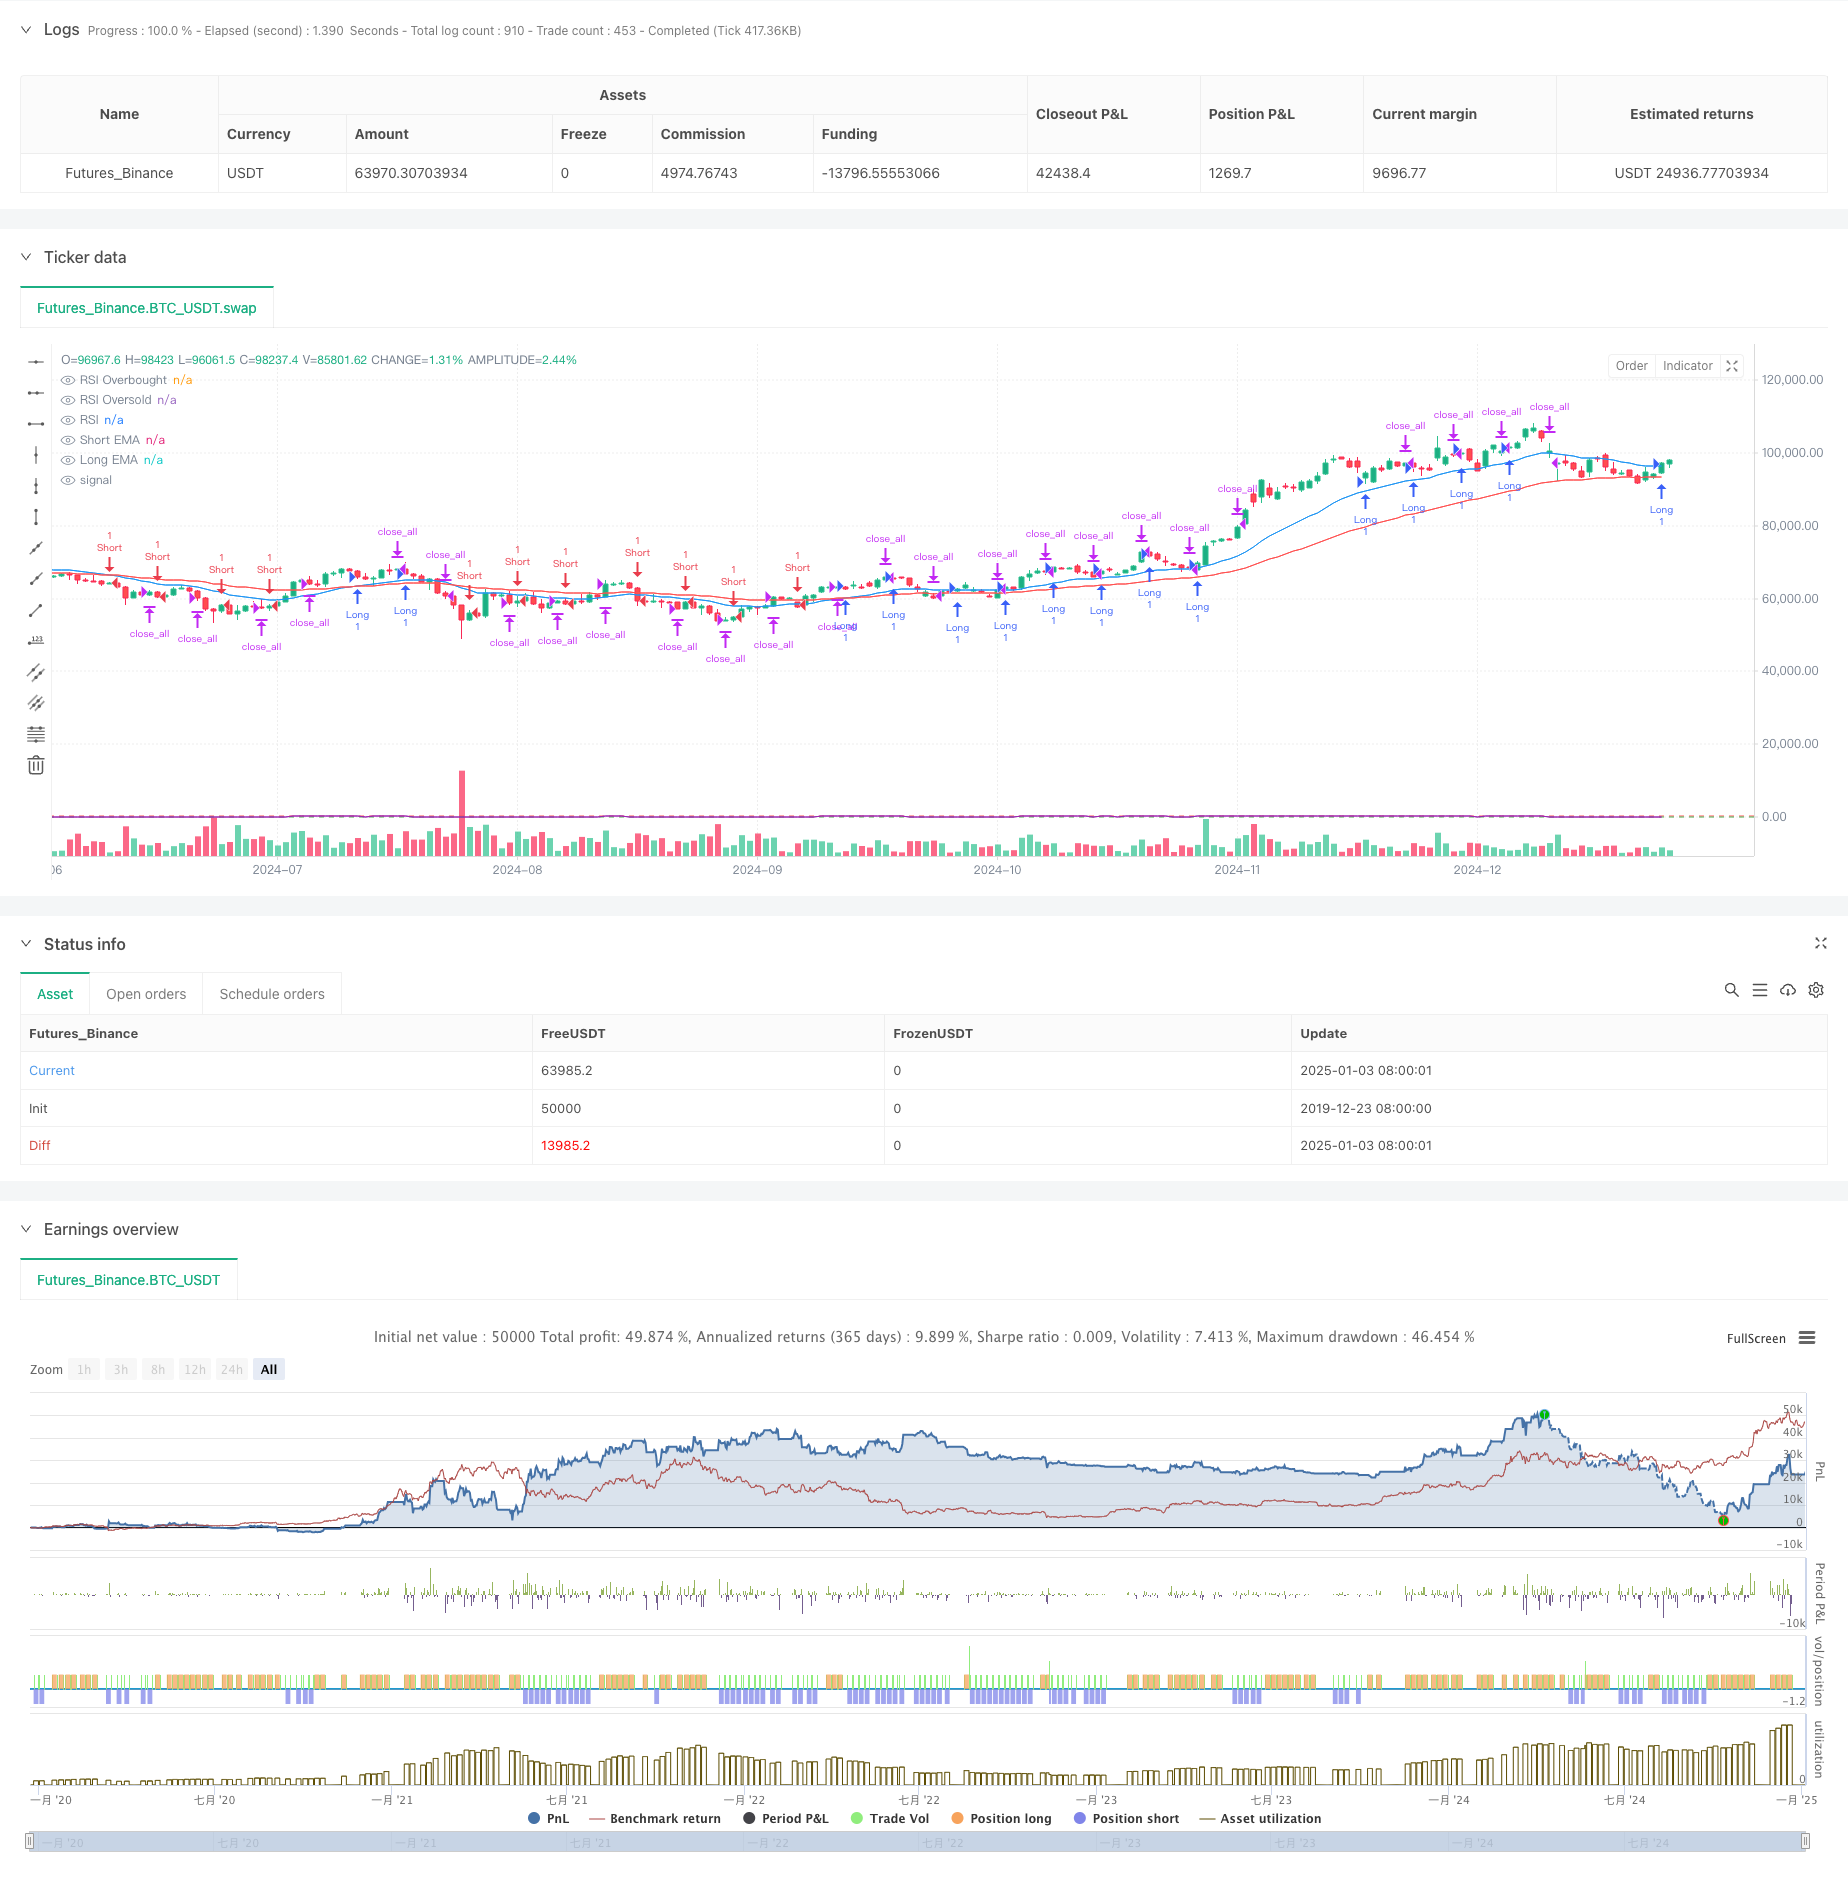
[trans]
概述
本策略是一个基于多重技术指标的趋势跟踪交易系统,结合了均线趋势、RSI超买超卖以及ATR波动率指标,通过多维度的市场分析来提高交易的胜率和收益。策略核心逻辑是通过短期和长期EMA的交叉确认趋势方向,同时利用RSI指标过滤假突破,最后结合ATR动态调整持仓时间,实现对趋势的精准把握。
策略原理
策略采用20日与50日两条EMA均线作为趋势判断的主要依据。当短期EMA上穿长期EMA时,确认上升趋势;反之则确认下降趋势。在趋势确认的基础上,引入RSI指标进行超买超卖判断,当RSI低于30进入超卖区间且处于上升趋势时,触发做多信号;当RSI高于70进入超买区间且处于下降趋势时,触发做空信号。同时使用ATR指标衡量市场波动性,只有当ATR大于设定阈值时才执行交易,避免在波动率过低的市场环境中交易。
策略优势
- 多重技术指标的结合提供了更可靠的交易信号,有效降低了假突破带来的风险
- 通过ATR动态调整持仓时间,使策略能够适应不同的市场环境
- RSI指标的引入帮助避免在过度追涨杀跌的情况下入场
- 固定持仓周期的设计有助于控制风险,避免过度持仓
- 策略逻辑清晰,参数可调整性强,便于根据不同市场情况进行优化
策略风险
- 在震荡市场中可能产生频繁的假信号,增加交易成本
- 固定的持仓周期可能导致在强趋势行情中过早退出,错过部分盈利机会
- 多重指标的使用可能导致信号滞后,影响入场时机
- 在快速行情中,RSI的超买超卖判断可能不够及时
- ATR阈值的设置需要根据市场情况不断调整,参数优化难度较大
策略优化方向
- 引入自适应参数机制,根据市场波动情况动态调整EMA周期和RSI阈值
- 增加成交量指标作为辅助确认,提高交易信号的可靠性
- 开发动态持仓周期机制,根据趋势强度自动调整持仓时间
- 加入更多的市场情绪指标,如MACD或布林带,增强策略的适应性
- 优化止损止盈机制,采用跟踪止损方式提高盈利能力
总结
该策略通过均线趋势、RSI超买超卖和ATR波动率三个维度的综合分析,构建了一个相对完整的交易系统。策略的核心优势在于多重指标的交叉验证,能够有效降低虚假信号的影响。通过参数优化和风险控制机制的改进,策略仍有较大的优化空间。建议交易者在实盘使用时,需要根据具体市场环境调整参数,并严格执行风险控制措施。 ||
Overview
This strategy is a trend-following trading system based on multiple technical indicators, combining EMA trends, RSI overbought/oversold conditions, and ATR volatility indicators to improve trading win rates and returns through multi-dimensional market analysis. The core logic uses short-term and long-term EMA crossovers to confirm trend direction, while utilizing RSI indicators to filter false breakouts and ATR to dynamically adjust holding periods for precise trend capture.
Strategy Principles
The strategy employs 20-day and 50-day EMAs as the primary basis for trend determination. An uptrend is confirmed when the short-term EMA crosses above the long-term EMA, and vice versa. Building on trend confirmation, the RSI indicator is introduced for overbought/oversold judgment, triggering long signals when RSI falls below 30 in oversold territory during uptrends, and short signals when RSI rises above 70 in overbought territory during downtrends. The ATR indicator measures market volatility, executing trades only when ATR exceeds the set threshold to avoid trading in low-volatility environments.
Strategy Advantages
- Multiple technical indicators combination provides more reliable trading signals, effectively reducing false breakout risks
- Dynamic holding period adjustment through ATR enables adaptation to different market environments
- RSI incorporation helps avoid entering during excessive chase-ups or sell-offs
- Fixed holding period design aids risk control and prevents over-holding
- Clear strategy logic with adjustable parameters facilitates optimization for different market conditions
Strategy Risks
- May generate frequent false signals in ranging markets, increasing transaction costs
- Fixed holding periods might lead to early exits in strong trends, missing profit opportunities
- Multiple indicator usage can result in lagging signals, affecting entry timing
- RSI overbought/oversold judgments may not be timely enough in fast-moving markets
- ATR threshold settings require constant adjustment based on market conditions, making parameter optimization challenging
Strategy Optimization Directions
- Introduce adaptive parameter mechanisms to dynamically adjust EMA periods and RSI thresholds based on market volatility
- Add volume indicators as auxiliary confirmation to improve signal reliability
- Develop dynamic holding period mechanisms to automatically adjust based on trend strength
- Incorporate additional market sentiment indicators like MACD or Bollinger Bands to enhance strategy adaptability
- Optimize stop-loss and take-profit mechanisms using trailing stops to improve profitability
Summary
This strategy constructs a relatively complete trading system through comprehensive analysis of EMA trends, RSI overbought/oversold conditions, and ATR volatility. Its core advantage lies in cross-validation of multiple indicators, effectively reducing the impact of false signals. Through parameter optimization and risk control mechanism improvements, the strategy still has significant optimization potential. Traders are advised to adjust parameters according to specific market environments and strictly implement risk control measures when using in live trading.[/trans]
Source (PineScript)
/*backtest
start: 2019-12-23 08:00:00
end: 2025-01-04 08:00:00
period: 1d
basePeriod: 1d
exchanges: [{"eid":"Futures_Binance","currency":"BTC_USDT"}]
*/

//@version=5
strategy("High Win Rate BTC Strategy", overlay=true)

// 参数设置
emaShortLength = input(20, title="Short EMA Length")
emaLongLength = input(50, title="Long EMA Length")
rsiLength = input(14, title="RSI Length")
rsiOverbought = input(70, title="RSI Overbought Level")
rsiOversold = input(30, title="RSI Oversold Level")
atrLength = input(14, title="ATR Length")
atrThreshold = input(1.0, title="ATR Threshold")
holdBars = input(5, title="Hold Bars")

// 计算指标
emaShort = ta.ema(close, emaShortLength)
emaLong = ta.ema(close, emaLongLength)
rsi = ta.rsi(close, rsiLength)
atr = ta.atr(atrLength)

// 趋势确认
uptrend = emaShort > emaLong
downtrend = emaShort < emaLong

// 入场条件
longCondition = uptrend and close > emaShort and rsi < rsiOverbought and atr > atrThreshold
shortCondition = downtrend and close < emaShort and rsi > rsiOversold and atr > atrThreshold

// 出场条件
var int holdCount = 0
if (strategy.position_size > 0 or strategy.position_size < 0)
    holdCount := holdCount + 1
else
    holdCount := 0

exitCondition = holdCount >= holdBars

// 执行交易
if (longCondition)
    strategy.entry("Long", strategy.long)
if (shortCondition)
    strategy.entry("Short", strategy.short)

if (exitCondition)
    strategy.close_all()

// 绘制指标
plot(emaShort, color=color.blue, title="Short EMA")
plot(emaLong, color=color.red, title="Long EMA")
hline(rsiOverbought, "RSI Overbought", color=color.red)
hline(rsiOversold, "RSI Oversold", color=color.green)
plot(rsi, color=color.purple, title="RSI")
Detail
https://www.fmz.com/strategy/477567
Last Modified
2025-01-06 14:10:46