
170 lines
7.0 KiB
Markdown
170 lines
7.0 KiB
Markdown
|
|
> Name
|
|
|
|
多周期均线趋势跟踪与支阻系统结合的混合交易策略-Multi-Period-EMA-Trend-Following-with-Support-Resistance-Hybrid-Trading-System
|
|
|
|
> Author
|
|
|
|
ChaoZhang
|
|
|
|
> Strategy Description
|
|
|
|
|
|
|
|
[trans]
|
|
#### 概述
|
|
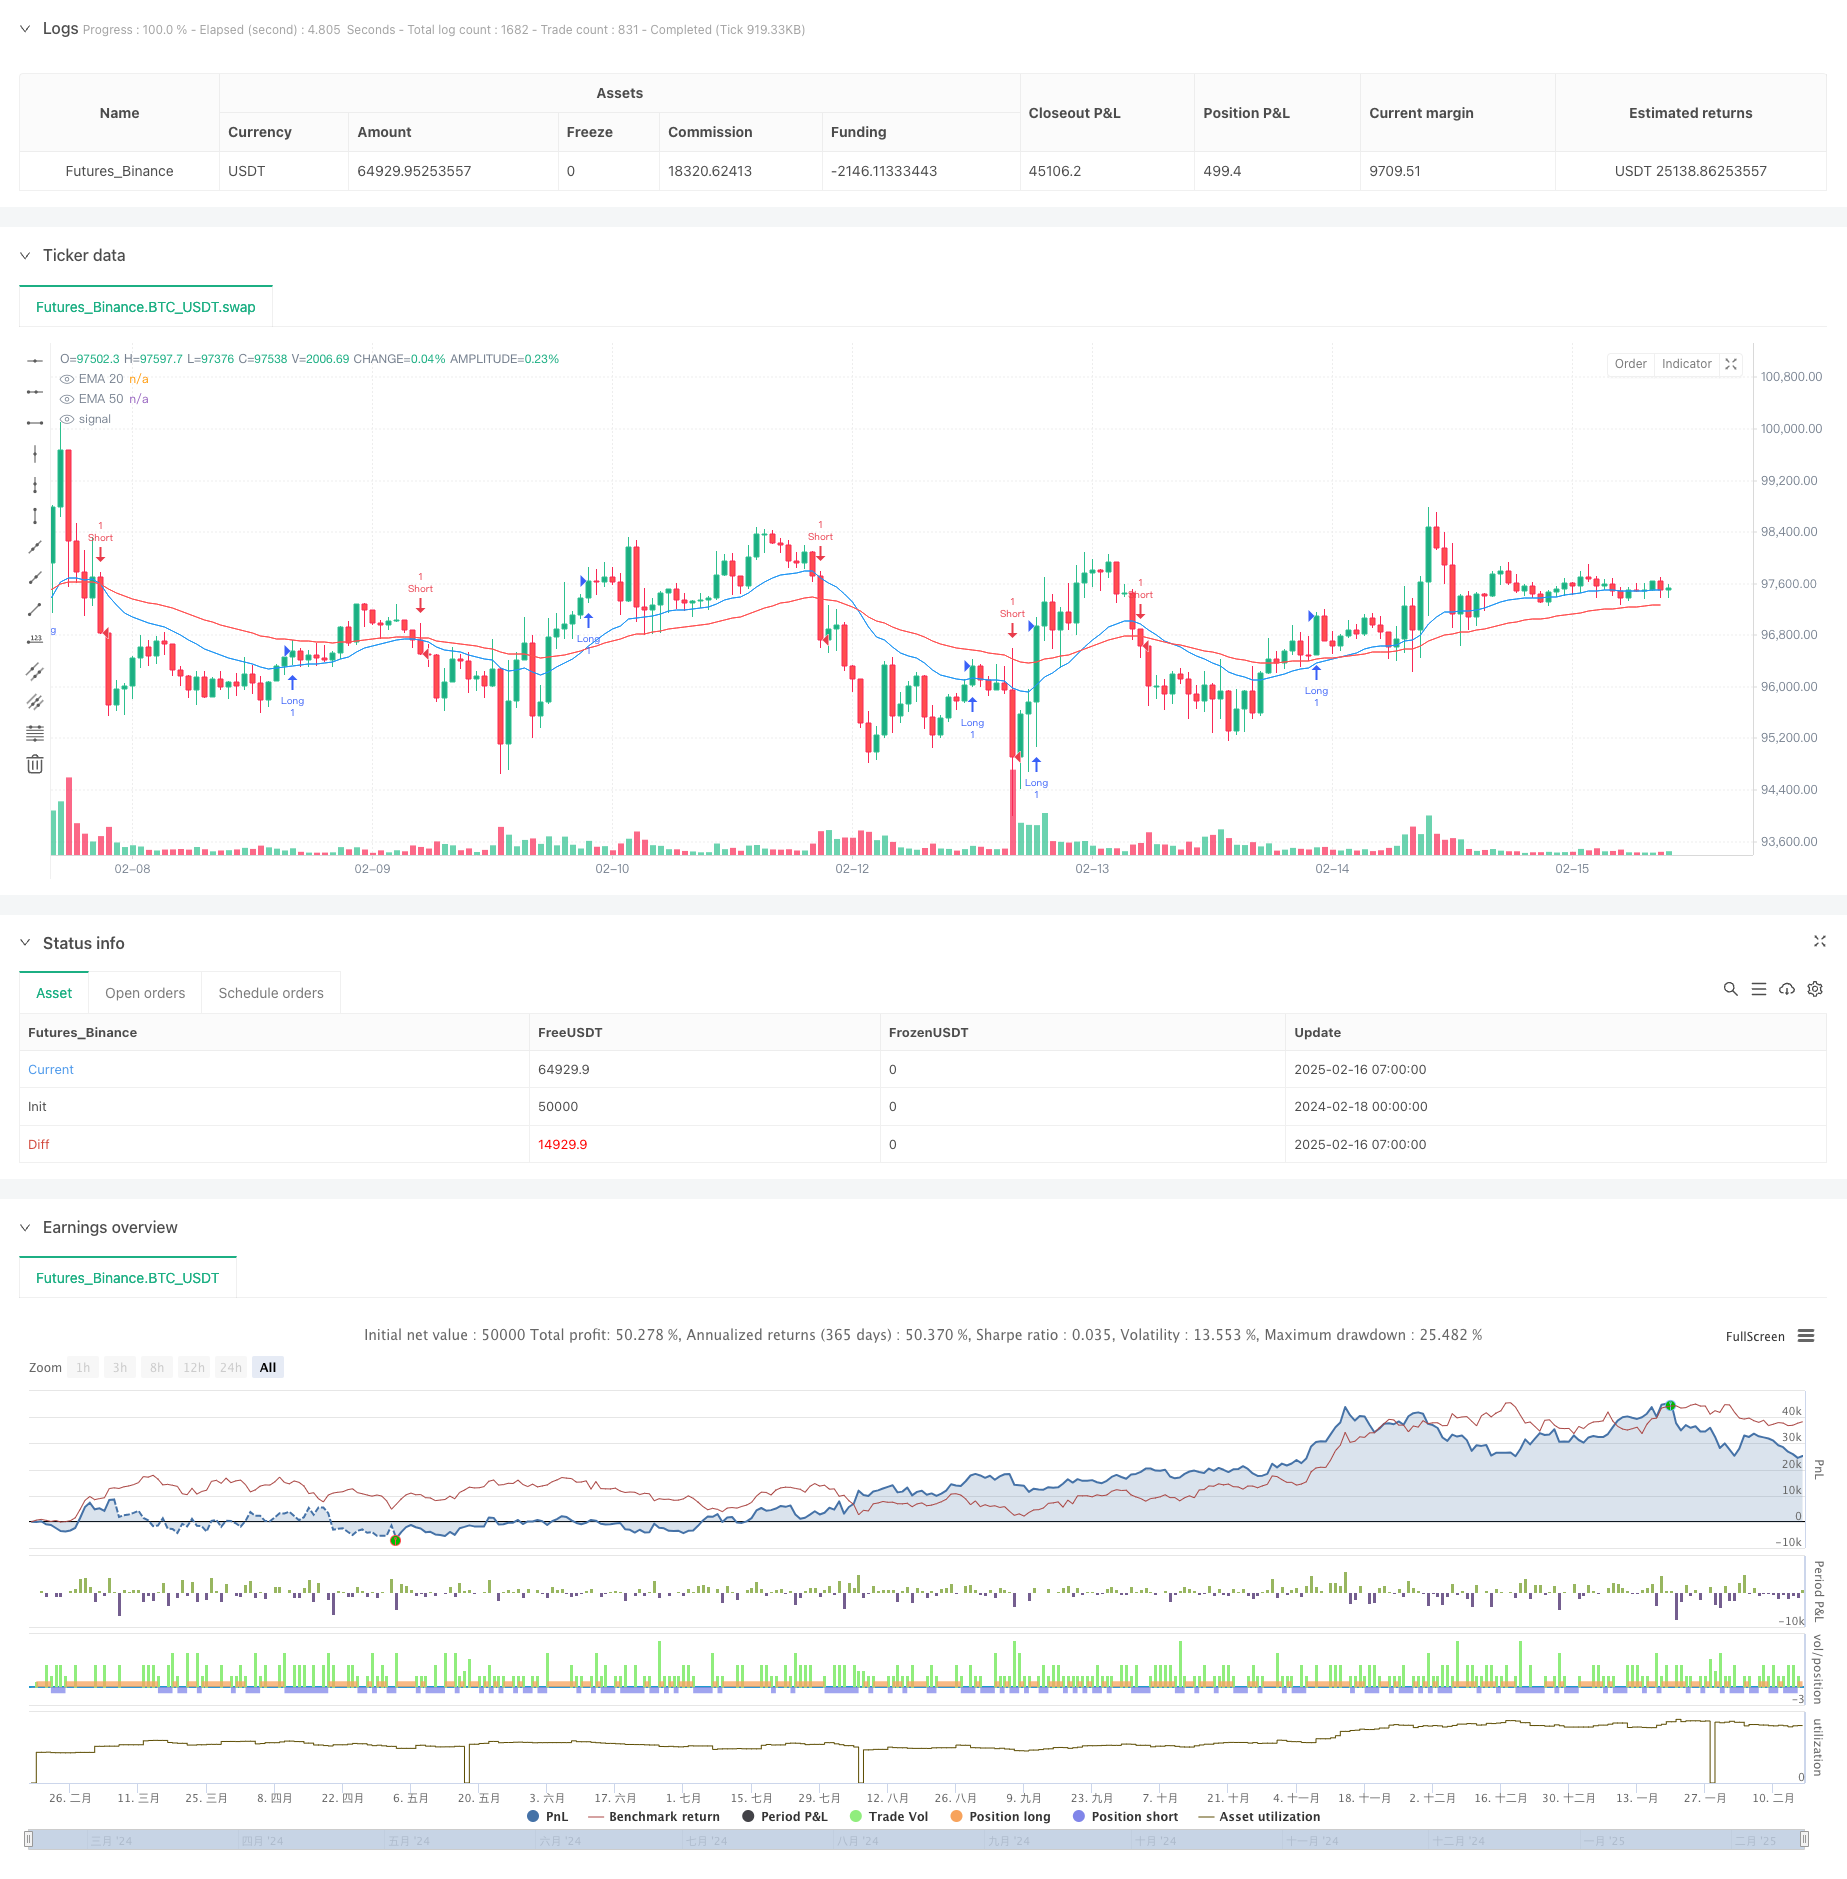
该策略是一个结合了多个技术分析指标的混合交易系统。它主要依托均线系统(EMA)判断市场趋势,同时结合支撑阻力(SR)水平作为入场信号,并使用真实波动幅度(ATR)进行风险控制。策略采用了动态的止损设置,可以根据市场波动性自适应调整止损位置。
|
|
|
|
#### 策略原理
|
|
策略运作基于以下几个核心组件:
|
|
1. 趋势判定系统 - 使用20周期与50周期指数移动平均线(EMA)的空间关系和差值判断趋势强度
|
|
2. 突破信号系统 - 通过9个周期的最高价和最低价构建支撑阻力水平
|
|
3. 风险控制系统 - 采用14周期ATR动态调整止损距离
|
|
4. 入场逻辑包含两个条件:
|
|
- 价格突破支撑阻力水平
|
|
- 处于趋势中且价格在正确的均线方向
|
|
5. 出场逻辑基于ATR的动态止损,止损距离为ATR的10倍
|
|
|
|
#### 策略优势
|
|
1. 多维度确认 - 结合趋势跟踪和突破交易,提高信号可靠性
|
|
2. 自适应性强 - 通过ATR动态调整止损,适应不同市场环境
|
|
3. 风险控制完善 - 具有明确的止损机制,且止损会随市场波动调整
|
|
4. 系统化程度高 - 交易规则明确,不受主观判断影响
|
|
5. 可扩展性好 - 核心框架稳定,易于添加新的交易规则
|
|
|
|
#### 策略风险
|
|
1. 震荡市场风险 - 在横盘市场可能产生频繁虚假信号
|
|
2. 滑点风险 - 突破交易在高波动时期可能面临较大滑点
|
|
3. 止损幅度风险 - ATR倍数设置过大可能导致较大回撤
|
|
4. 信号延迟风险 - 均线系统存在一定滞后性
|
|
5. 参数敏感性 - 多个参数的设置需要充分测试优化
|
|
|
|
#### 策略优化方向
|
|
1. 信号过滤优化
|
|
- 添加成交量确认机制
|
|
- 引入波动率过滤器
|
|
- 结合更多技术指标验证
|
|
|
|
2. 仓位管理优化
|
|
- 实现动态仓位管理
|
|
- 基于波动率调整持仓规模
|
|
- 添加分批建仓机制
|
|
|
|
3. 止损优化
|
|
- 引入移动止损
|
|
- 优化ATR倍数设置
|
|
- 添加盈利保护机制
|
|
|
|
#### 总结
|
|
该策略通过结合多个成熟的技术分析方法,构建了一个完整的交易系统。其核心优势在于系统的自适应性和风险控制能力。通过不断优化和完善,策略有望在不同市场环境下保持稳定表现。建议交易者在实盘使用前,进行充分的历史数据测试和参数优化。 ||
|
|
|
|
#### Overview
|
|
This strategy is a hybrid trading system that combines multiple technical analysis indicators. It primarily uses the Exponential Moving Average (EMA) system to determine market trends, while incorporating Support and Resistance (SR) levels for entry signals and Average True Range (ATR) for risk control. The strategy employs dynamic stop-loss settings that can adaptively adjust based on market volatility.
|
|
|
|
#### Strategy Principles
|
|
The strategy operates based on the following core components:
|
|
1. Trend Determination System - Uses the spatial relationship and difference between 20-period and 50-period EMAs to judge trend strength
|
|
2. Breakthrough Signal System - Constructs support and resistance levels using 9-period high and low prices
|
|
3. Risk Control System - Uses 14-period ATR to dynamically adjust stop-loss distances
|
|
4. Entry logic includes two conditions:
|
|
- Price breaks through support/resistance levels
|
|
- In trend and price is in the correct EMA direction
|
|
5. Exit logic based on ATR dynamic stop-loss, with stop distance set at 10 times ATR
|
|
|
|
#### Strategy Advantages
|
|
1. Multi-dimensional Confirmation - Combines trend following and breakout trading for improved signal reliability
|
|
2. Strong Adaptability - Dynamically adjusts stops through ATR, adapting to different market environments
|
|
3. Comprehensive Risk Control - Has clear stop-loss mechanisms that adjust with market volatility
|
|
4. High Systematization - Clear trading rules, unaffected by subjective judgment
|
|
5. Good Scalability - Stable core framework, easy to add new trading rules
|
|
|
|
#### Strategy Risks
|
|
1. Oscillation Market Risk - May generate frequent false signals in sideways markets
|
|
2. Slippage Risk - Breakout trades may face significant slippage during high volatility
|
|
3. Stop-Loss Range Risk - Large ATR multiplier settings may lead to significant drawdowns
|
|
4. Signal Delay Risk - Moving average system has inherent lag
|
|
5. Parameter Sensitivity - Multiple parameters require thorough testing and optimization
|
|
|
|
#### Strategy Optimization Directions
|
|
1. Signal Filtering Optimization
|
|
- Add volume confirmation mechanism
|
|
- Introduce volatility filters
|
|
- Integrate more technical indicators for verification
|
|
|
|
2. Position Management Optimization
|
|
- Implement dynamic position management
|
|
- Adjust position size based on volatility
|
|
- Add staged position building mechanism
|
|
|
|
3. Stop-Loss Optimization
|
|
- Introduce trailing stops
|
|
- Optimize ATR multiplier settings
|
|
- Add profit protection mechanism
|
|
|
|
#### Summary
|
|
This strategy constructs a complete trading system by combining multiple mature technical analysis methods. Its core advantages lie in system adaptability and risk control capabilities. Through continuous optimization and improvement, the strategy shows promise in maintaining stable performance across different market environments. Traders are advised to conduct thorough historical data testing and parameter optimization before live trading.[/trans]
|
|
|
|
|
|
|
|
> Source (PineScript)
|
|
|
|
``` pinescript
|
|
/*backtest
|
|
start: 2024-02-18 00:00:00
|
|
end: 2025-02-16 08:00:00
|
|
period: 1h
|
|
basePeriod: 1h
|
|
exchanges: [{"eid":"Futures_Binance","currency":"BTC_USDT"}]
|
|
*/
|
|
|
|
//@version=6
|
|
strategy("Multi-Strategy Trader v1 by SUNNY GUHA +91 9836021040 / www.oiesu.com", overlay=true)
|
|
|
|
// Basic Inputs
|
|
supResLookback = input.int(9, "Support/Resistance Lookback")
|
|
atrPeriod = input.int(14, "ATR Period")
|
|
stopMultiplier = input.float(10.0, "Stop Loss ATR Multiplier")
|
|
|
|
// Technical Indicators
|
|
atr = ta.atr(atrPeriod)
|
|
highestHigh = ta.highest(high, supResLookback)
|
|
lowestLow = ta.lowest(low, supResLookback)
|
|
ema20 = ta.ema(close, 20)
|
|
ema50 = ta.ema(close, 50)
|
|
|
|
// Basic Strategy Rules
|
|
isTrending = math.abs(ema20 - ema50) > atr
|
|
longSignal = close > highestHigh[1] or (isTrending and ema20 > ema50 and close > ema20)
|
|
shortSignal = close < lowestLow[1] or (isTrending and ema20 < ema50 and close < ema20)
|
|
|
|
// Entry Logic
|
|
if longSignal and strategy.position_size <= 0
|
|
strategy.entry("Long", strategy.long)
|
|
|
|
if shortSignal and strategy.position_size >= 0
|
|
strategy.entry("Short", strategy.short)
|
|
|
|
// Stop Loss Logic
|
|
longStopPrice = close - (atr * stopMultiplier)
|
|
shortStopPrice = close + (atr * stopMultiplier)
|
|
|
|
// Exit Logic
|
|
if strategy.position_size > 0
|
|
strategy.exit("Long Exit", "Long", stop=longStopPrice)
|
|
if strategy.position_size < 0
|
|
strategy.exit("Short Exit", "Short", stop=shortStopPrice)
|
|
|
|
// Basic Plotting
|
|
plot(ema20, "EMA 20", color.blue)
|
|
plot(ema50, "EMA 50", color.red)
|
|
|
|
```
|
|
|
|
> Detail
|
|
|
|
https://www.fmz.com/strategy/482477
|
|
|
|
> Last Modified
|
|
|
|
2025-02-18 15:52:46
|