
155 lines
8.9 KiB
Markdown
155 lines
8.9 KiB
Markdown
|
|
> Name
|
|
|
|
多周期均线穿越结合RSI动量与ATR波动率的趋势跟踪策略-Multi-Period-EMA-Crossover-with-RSI-Momentum-and-ATR-Volatility-Based-Trend-Following-Strategy
|
|
|
|
> Author
|
|
|
|
ChaoZhang
|
|
|
|
> Strategy Description
|
|
|
|
|
|
|
|
[trans]
|
|
#### 概述
|
|
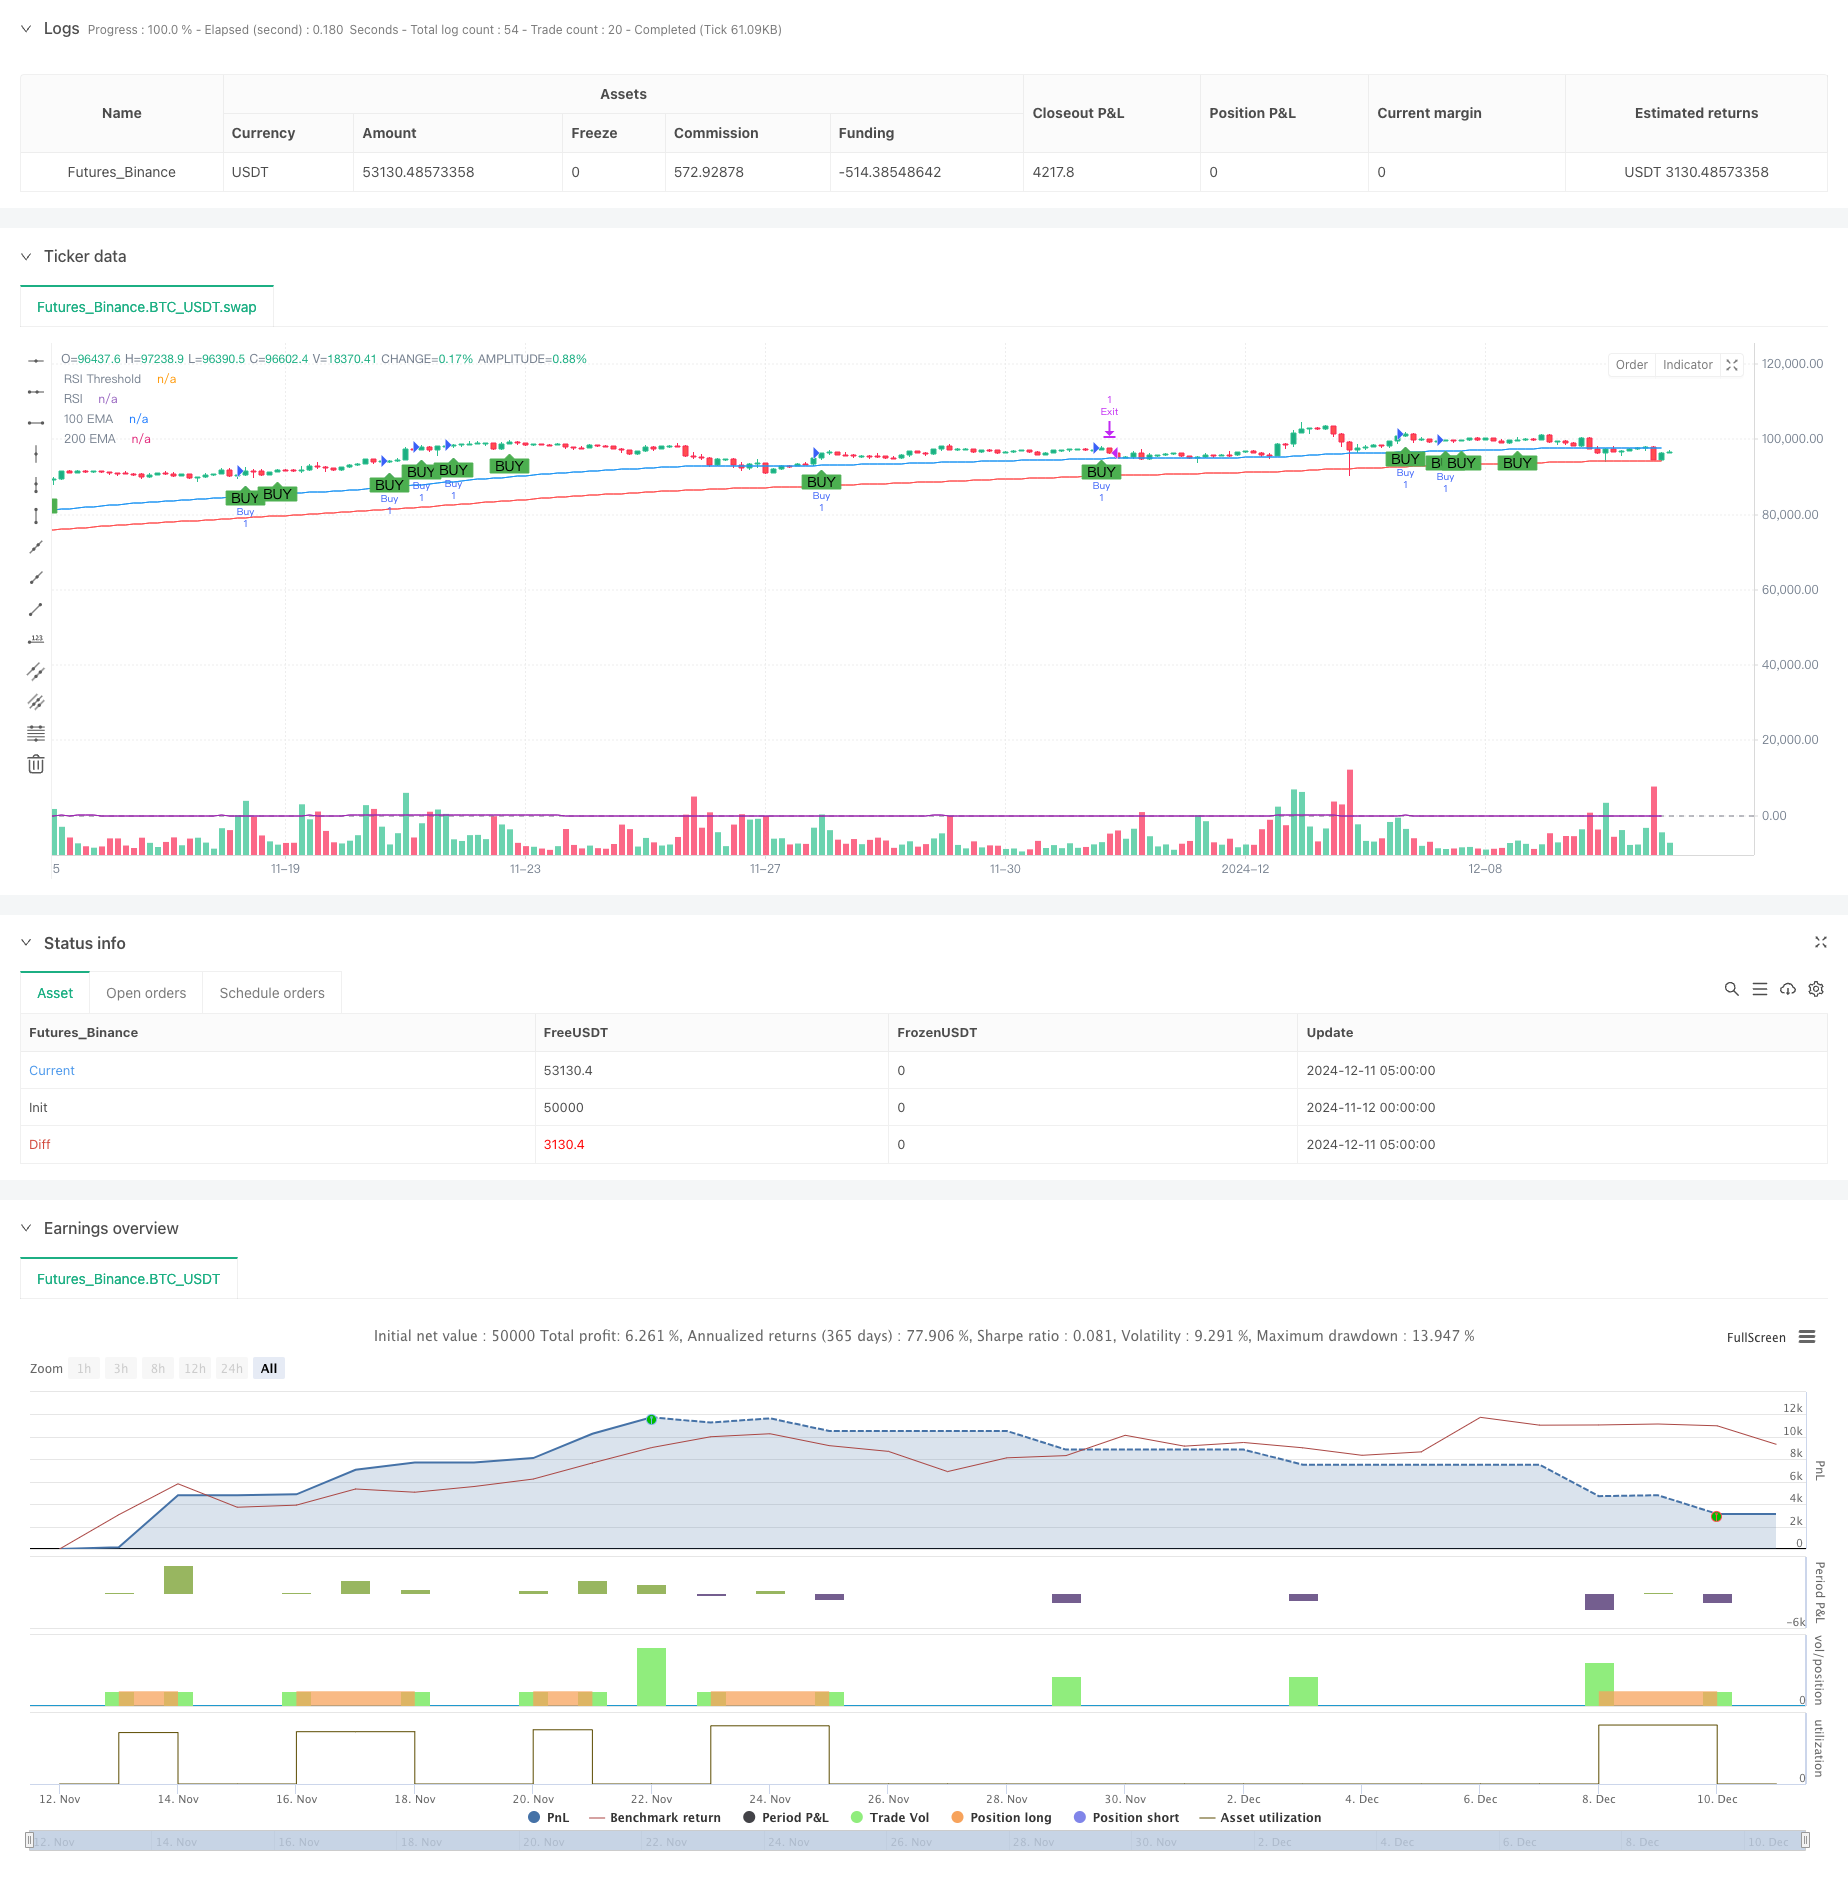
该策略是一个基于技术分析的趋势跟踪系统,结合了均线系统、RSI动量指标和ATR波动率指标,通过多重信号验证来确认交易机会。策略使用多周期均线交叉判断市场趋势,同时结合RSI动量确认价格强度,最后利用ATR动态设置止损和获利点位,形成了一个完整的交易系统。
|
|
|
|
#### 策略原理
|
|
策略的核心逻辑包含三个关键部分:
|
|
1. 趋势判断:使用100周期与200周期的指数移动平均线(EMA)交叉来确认市场趋势方向。当短期EMA位于长期EMA之上时,表明市场处于上升趋势。
|
|
2. 入场信号:在趋势确认的基础上,策略寻找看涨吞没形态作为具体入场点,并使用RSI指标进行信号过滤。当RSI数值大于50时,表明市场具有足够的上升动能。
|
|
3. 仓位管理:使用14周期ATR来度量市场波动性,并据此动态设置止损和获利水平。止损设置为1.1倍ATR,获利目标为2.0倍ATR,这种设置保证了盈亏比大于1。
|
|
|
|
#### 策略优势
|
|
1. 多重信号验证:通过结合趋势、价格形态和动量指标,大大降低了虚假信号的影响。
|
|
2. 动态风险管理:基于ATR的止损和获利设置,能够根据市场波动性自适应调整,避免了固定点位带来的局限性。
|
|
3. 趋势跟踪特性:通过均线系统判断趋势,有效避免了在横盘或下跌市场中的不必要交易。
|
|
4. 完整的交易框架:包含了入场、出场和仓位管理的完整策略体系。
|
|
|
|
#### 策略风险
|
|
1. 趋势延迟:EMA作为滞后指标可能导致入场时机偏晚,在快速波动市场中可能错过最佳入场点。
|
|
2. 盘整市场风险:在横盘市场中,频繁的均线交叉可能导致过度交易。
|
|
3. 假突破风险:看涨吞没形态可能出现假突破,需要通过严格的风险控制来管理。
|
|
4. 止损设置风险:过小的ATR乘数可能导致过于频繁的止损,而过大的乘数则可能承受过大的风险。
|
|
|
|
#### 策略优化方向
|
|
1. 引入成交量指标:可以通过添加成交量确认来提高信号的可靠性。
|
|
2. 优化均线周期:可以根据不同市场特征调整均线周期,使其更好地适应市场节奏。
|
|
3. 完善止损机制:可以考虑添加移动止损,在趋势延续时保护已有利润。
|
|
4. 增加市场环境过滤:引入波动率范围判断,在过度波动的市场环境中降低交易频率。
|
|
5. 优化RSI参数:可以根据历史数据回测,寻找最优的RSI阈值和计算周期。
|
|
|
|
#### 总结
|
|
该策略通过整合多个技术指标,构建了一个逻辑完整的趋势跟踪系统。策略的优势在于多重信号验证和动态风险管理,但同时也需要注意处理趋势延迟和假突破等风险。通过添加成交量确认、优化参数设置等方式,策略仍有较大的改进空间。整体而言,该策略适合在明显趋势市场中运行,对于追踪中长期趋势具有良好的应用价值。 ||
|
|
|
|
#### Overview
|
|
This strategy is a trend-following system based on technical analysis, combining moving averages, RSI momentum indicator, and ATR volatility indicator to validate trading opportunities through multiple signal confirmations. The strategy uses multi-period moving average crossovers to determine market trends, combines RSI momentum to confirm price strength, and finally uses ATR to dynamically set stop-loss and take-profit levels, forming a complete trading system.
|
|
|
|
#### Strategy Principles
|
|
The core logic of the strategy includes three key components:
|
|
1. Trend Determination: Uses 100-period and 200-period Exponential Moving Average (EMA) crossovers to confirm market trend direction. When the short-term EMA is above the long-term EMA, it indicates an upward market trend.
|
|
2. Entry Signals: Based on trend confirmation, the strategy looks for bullish engulfing patterns as specific entry points and uses the RSI indicator for signal filtering. When the RSI value is above 50, it indicates sufficient upward momentum in the market.
|
|
3. Position Management: Uses 14-period ATR to measure market volatility and dynamically sets stop-loss and profit levels accordingly. Stop-loss is set at 1.1 times ATR, and profit target at 2.0 times ATR, ensuring a risk-reward ratio greater than 1.
|
|
|
|
#### Strategy Advantages
|
|
1. Multiple Signal Validation: Combining trend, price patterns, and momentum indicators significantly reduces the impact of false signals.
|
|
2. Dynamic Risk Management: ATR-based stop-loss and profit settings can adaptively adjust according to market volatility, avoiding limitations of fixed levels.
|
|
3. Trend Following Characteristics: Using moving average systems to judge trends effectively avoids unnecessary trades in sideways or downward markets.
|
|
4. Complete Trading Framework: Includes a complete strategy system covering entry, exit, and position management.
|
|
|
|
#### Strategy Risks
|
|
1. Trend Delay: EMA as a lagging indicator may lead to delayed entry timing, potentially missing optimal entry points in rapidly volatile markets.
|
|
2. Sideways Market Risk: Frequent moving average crossovers in sideways markets may lead to overtrading.
|
|
3. False Breakout Risk: Bullish engulfing patterns may produce false breakouts, requiring strict risk control management.
|
|
4. Stop-Loss Setting Risk: Too small ATR multipliers may lead to frequent stop-losses, while too large multipliers may bear excessive risk.
|
|
|
|
#### Strategy Optimization Directions
|
|
1. Introduce Volume Indicators: Can improve signal reliability by adding volume confirmation.
|
|
2. Optimize Moving Average Periods: Can adjust moving average periods according to different market characteristics to better adapt to market rhythm.
|
|
3. Improve Stop-Loss Mechanism: Consider adding trailing stops to protect profits during trend continuation.
|
|
4. Add Market Environment Filtering: Introduce volatility range judgment to reduce trading frequency in excessively volatile market environments.
|
|
5. Optimize RSI Parameters: Can seek optimal RSI thresholds and calculation periods through historical data backtesting.
|
|
|
|
#### Summary
|
|
This strategy constructs a logically complete trend-following system by integrating multiple technical indicators. The strategy's advantages lie in multiple signal validation and dynamic risk management, but attention must also be paid to handling trend delays and false breakouts. Through adding volume confirmation and optimizing parameter settings, the strategy still has significant room for improvement. Overall, this strategy is suitable for operating in clearly trending markets and has good application value for tracking medium to long-term trends.[/trans]
|
|
|
|
|
|
|
|
> Source (PineScript)
|
|
|
|
``` pinescript
|
|
/*backtest
|
|
start: 2024-11-12 00:00:00
|
|
end: 2024-12-11 08:00:00
|
|
period: 3h
|
|
basePeriod: 3h
|
|
exchanges: [{"eid":"Futures_Binance","currency":"BTC_USDT"}]
|
|
*/
|
|
|
|
//@version=5
|
|
strategy("Bullish Engulfing with EMA Crossover and ATR-Based SL/TP with RSI Filter", overlay=true)
|
|
|
|
// Inputs for moving averages
|
|
short_ema_length = input.int(100, title="Short EMA Length")
|
|
long_ema_length = input.int(200, title="Long EMA Length")
|
|
|
|
// RSI Input
|
|
rsi_length = input.int(14, title="RSI Length")
|
|
rsi_threshold = input.float(50, title="RSI Threshold")
|
|
|
|
// Calculate the Exponential Moving Averages (EMAs)
|
|
short_ema = ta.ema(close, short_ema_length)
|
|
long_ema = ta.ema(close, long_ema_length)
|
|
|
|
// Plot EMAs on the chart
|
|
plot(short_ema, color=color.blue, title="100 EMA")
|
|
plot(long_ema, color=color.red, title="200 EMA")
|
|
|
|
// Calculate RSI
|
|
rsi_value = ta.rsi(close, rsi_length)
|
|
|
|
// Plot RSI on a separate panel
|
|
hline(rsi_threshold, "RSI Threshold", color=color.gray)
|
|
plot(rsi_value, color=color.purple, title="RSI")
|
|
|
|
// Bullish Engulfing Pattern
|
|
bullish_engulfing = close > open[1] and open < close[1] and close > open
|
|
|
|
// Define strategy entry condition with RSI filter
|
|
long_condition = bullish_engulfing and short_ema > long_ema and rsi_value > rsi_threshold
|
|
|
|
// Plot a buy signal when conditions are met
|
|
plotshape(long_condition, style=shape.labelup, location=location.belowbar, color=color.green, title="Buy Signal", text="BUY")
|
|
|
|
// ATR Calculation
|
|
atr_length = input.int(14, title="ATR Length")
|
|
atr_value = ta.atr(atr_length)
|
|
|
|
// Define Stop Loss and Take Profit as levels
|
|
stop_loss_level = 1.1 * atr_value
|
|
take_profit_level = 2.0 * atr_value
|
|
|
|
// Execute Strategy Entry
|
|
if (long_condition)
|
|
strategy.entry("Buy", strategy.long)
|
|
|
|
// Adjust SL and TP levels using the entry price
|
|
if (strategy.position_size > 0)
|
|
// Calculate SL and TP relative to the entry price
|
|
stop_price = strategy.position_avg_price - stop_loss_level
|
|
limit_price = strategy.position_avg_price + take_profit_level
|
|
|
|
// Exit strategy with SL and TP
|
|
strategy.exit("Exit", from_entry="Buy", stop=stop_price, limit=limit_price)
|
|
|
|
```
|
|
|
|
> Detail
|
|
|
|
https://www.fmz.com/strategy/474959
|
|
|
|
> Last Modified
|
|
|
|
2024-12-13 10:33:00
|