
266 lines
14 KiB
Markdown
266 lines
14 KiB
Markdown
|
|
> Name
|
|
|
|
多周期均线交叉趋势跟踪策略-Multi-Period-Moving-Average-Crossover-Trend-Following-Strategy
|
|
|
|
> Author
|
|
|
|
ChaoZhang
|
|
|
|
> Strategy Description
|
|
|
|
|
|
|
|
[trans]
|
|
#### 概述
|
|
|
|
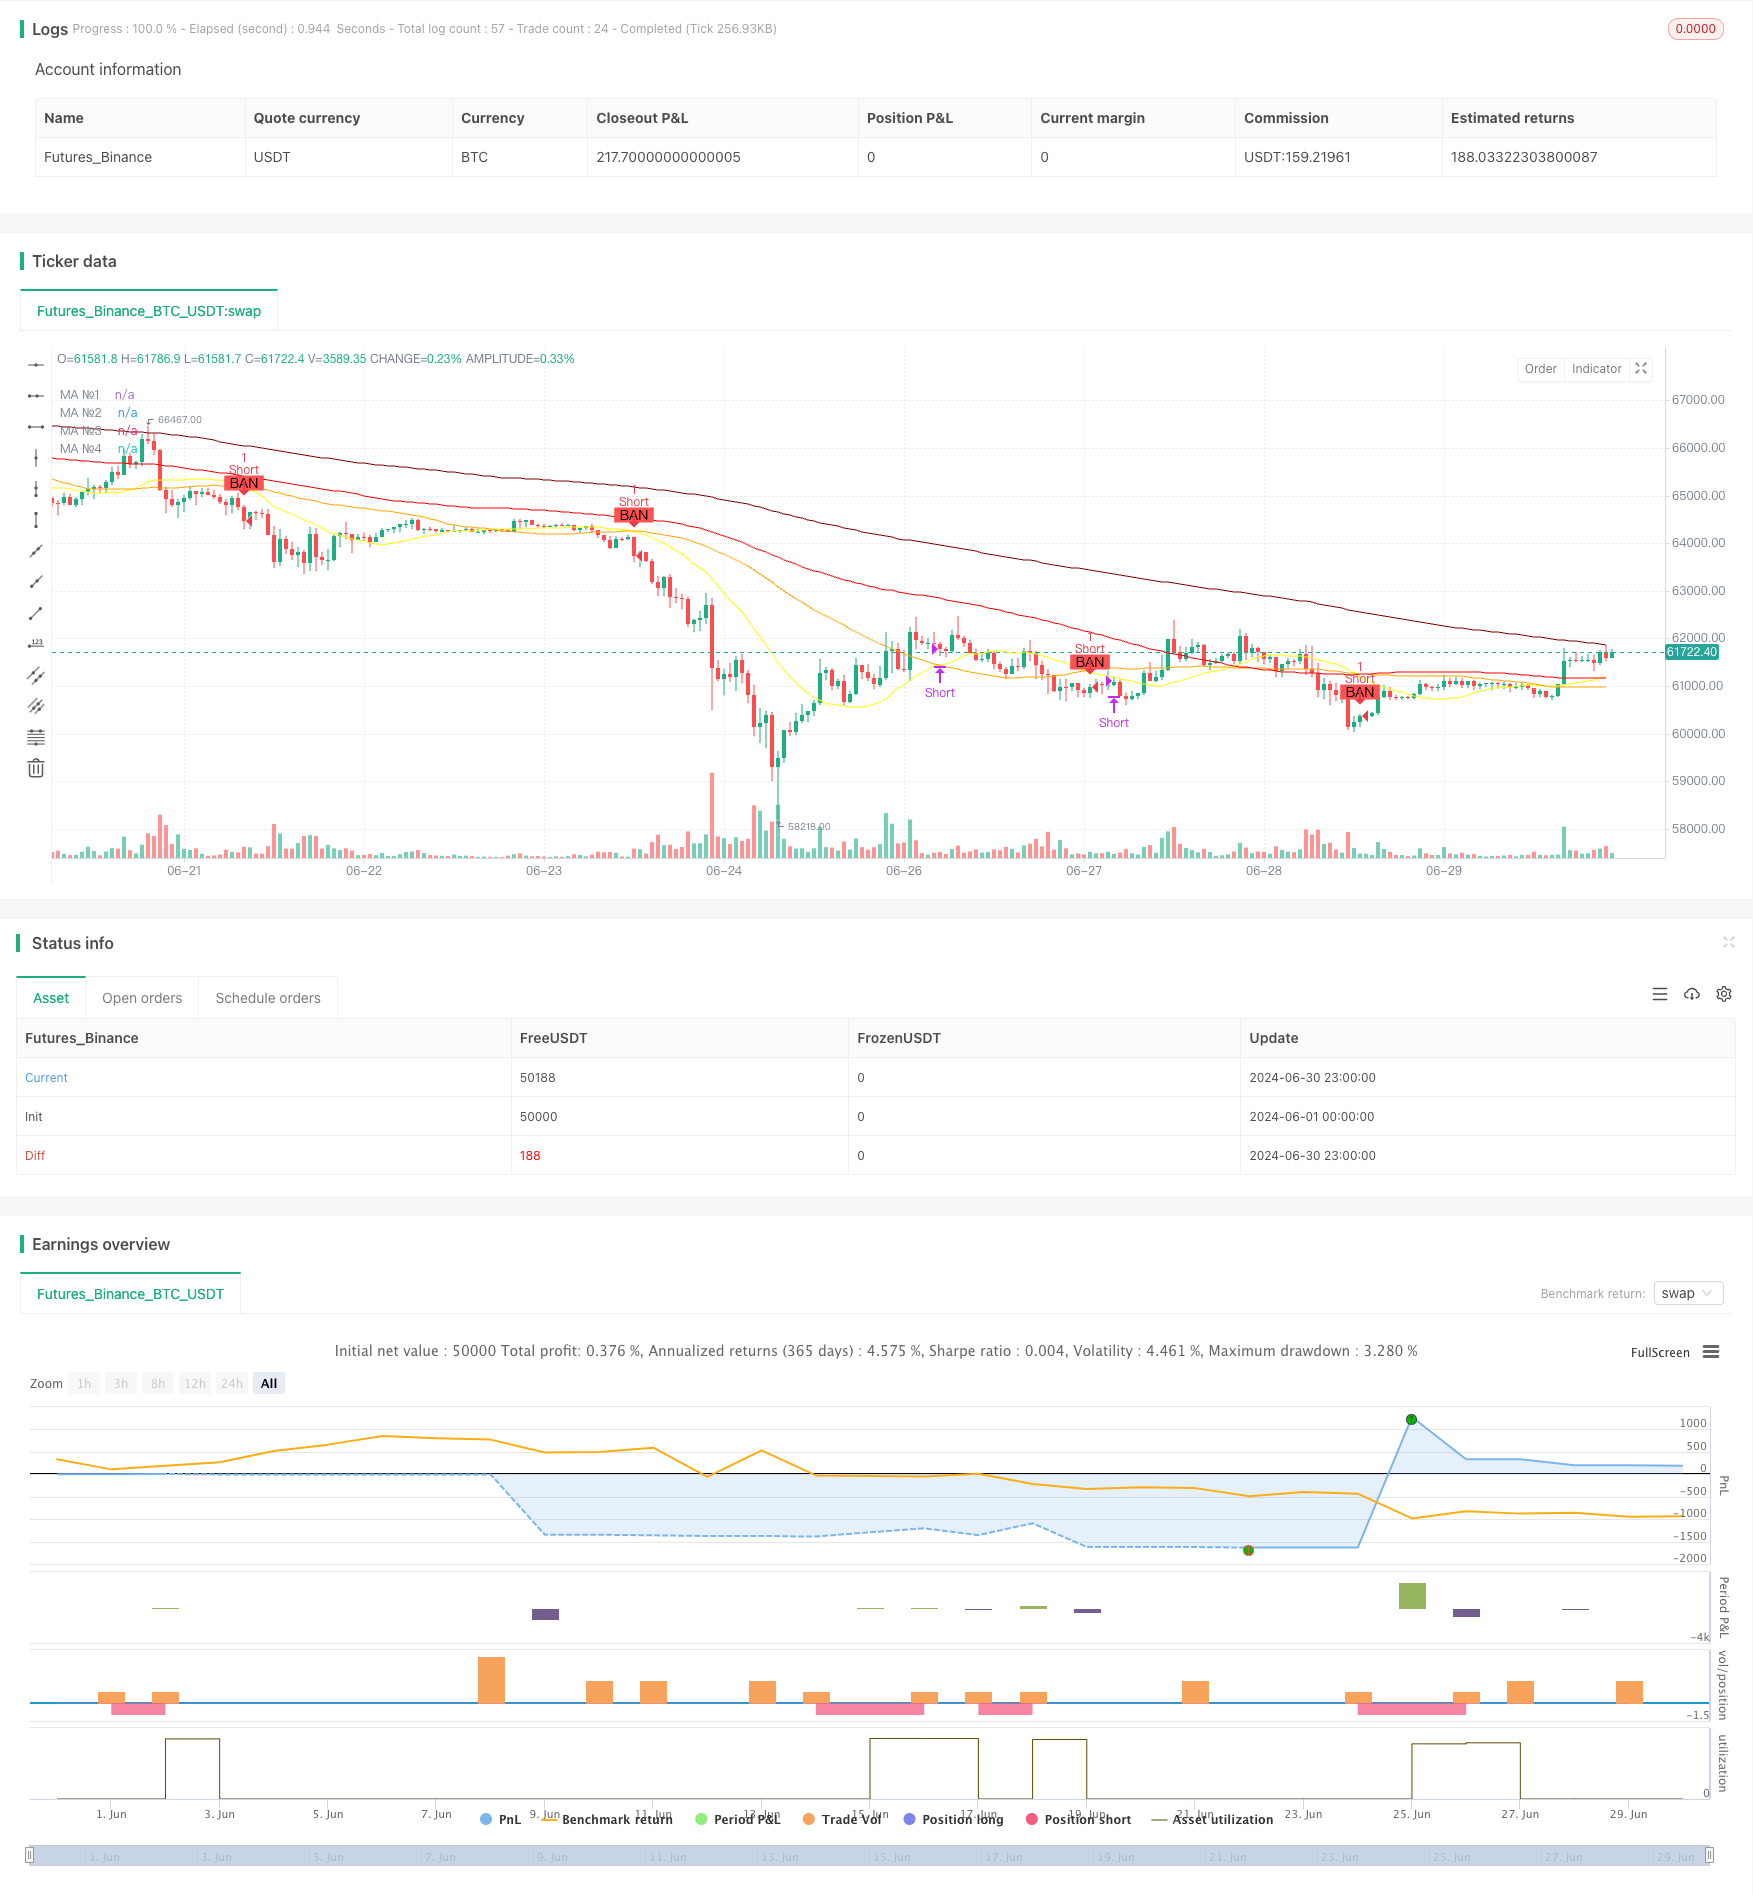
这个策略是一个基于多周期均线交叉的趋势跟踪交易系统。它利用4条不同周期的移动平均线来识别市场趋势,并在短期均线与中期均线发生交叉时产生交易信号。该策略还包含了风险管理机制,通过设置止损来控制下行风险。这种方法旨在捕捉中长期市场趋势,同时通过多重均线的配合来过滤掉短期的市场噪音。
|
|
|
|
#### 策略原理
|
|
|
|
该策略的核心原理是利用多条移动平均线的交叉来判断市场趋势的变化。具体来说:
|
|
|
|
1. 使用4条移动平均线:MA1(20周期)、MA2(50周期)、MA3(100周期)和MA4(200周期)。
|
|
2. 当MA1上穿MA2,且收盘价高于MA4时,产生买入信号。
|
|
3. 当MA1下穿MA2,且收盘价低于MA4时,产生卖出信号。
|
|
4. 入场后,设置止损位于入场点的最低价(多头)或最高价(空头)。
|
|
5. 当出现相反的交叉信号或触及止损时,平仓退出。
|
|
|
|
这种设计利用了短期均线(MA1)对市场变化的敏感性,同时通过中期均线(MA2)和长期均线(MA4)来确认整体趋势,从而减少假突破的风险。
|
|
|
|
#### 策略优势
|
|
|
|
1. 趋势跟踪能力强:通过多条均线的配合,能够有效捕捉中长期市场趋势,减少短期波动的影响。
|
|
|
|
2. 风险管理完善:设置了动态止损机制,有助于控制每笔交易的风险敞口。
|
|
|
|
3. 灵活性高:策略允许用户自定义均线类型和参数,可以根据不同市场和交易品种进行优化。
|
|
|
|
4. 视觉化效果好:通过不同颜色的均线和背景标记,交易者可以直观地观察市场状态和交易信号。
|
|
|
|
5. 适应性强:可以应用于多种时间周期和交易品种,具有广泛的适用性。
|
|
|
|
6. 自动化程度高:策略可以完全自动化执行,减少了人为情绪干扰。
|
|
|
|
#### 策略风险
|
|
|
|
1. 滞后性:移动平均线本质上是滞后指标,可能在趋势反转初期产生较大回撤。
|
|
|
|
2. 震荡市不适用:在横盘震荡市场中,频繁的均线交叉可能导致过度交易和连续亏损。
|
|
|
|
3. 假突破风险:虽然使用了多重均线确认,但仍可能在短期波动中产生假信号。
|
|
|
|
4. 止损设置可能过于严格:使用入场点的最高/最低价作为止损,在波动较大的市场中可能导致过早被止损。
|
|
|
|
5. 忽略了其他市场因素:仅依赖价格和均线,没有考虑成交量、基本面等其他重要因素。
|
|
|
|
6. 参数敏感性:不同的均线参数可能导致显著不同的结果,存在过度拟合的风险。
|
|
|
|
#### 策略优化方向
|
|
|
|
1. 引入动态止损:可以考虑使用ATR(平均真实波幅)来设置更合理的止损位置,以适应市场波动性的变化。
|
|
|
|
2. 增加趋势强度过滤:引入ADX(平均趋向指标)等指标来衡量趋势强度,只在强趋势市场中开仓。
|
|
|
|
3. 考虑成交量因素:将成交量作为交易信号的确认条件,提高信号的可靠性。
|
|
|
|
4. 优化入场时机:可以在均线交叉后等待一定的确认期,或者结合其他技术指标(如RSI)来优化入场点。
|
|
|
|
5. 加入移动止盈:设置追踪止盈,以便在趋势持续的情况下获得更多利润。
|
|
|
|
6. 参数自适应:考虑使用自适应参数方法,如基于市场波动性动态调整均线周期。
|
|
|
|
7. 结合基本面分析:在重要经济数据发布或特殊事件期间调整策略行为,以应对潜在的异常波动。
|
|
|
|
#### 总结
|
|
|
|
多周期均线交叉趋势跟踪策略是一个经典而有效的量化交易方法。它通过多重均线的配合,既能捕捉中长期趋势,又能在一定程度上过滤短期噪音。该策略的核心优势在于其对趋势的敏感性和风险管理的完整性。然而,作为一个纯技术分析驱动的系统,它也面临着滞后性和震荡市表现不佳等固有缺陷。
|
|
|
|
未来的优化方向应该集中在提高信号质量、改进风险管理和增强策略的适应性上。通过引入更多的技术指标和市场因素,可以构建一个更全面、更稳健的交易系统。同时,策略的参数优化和自适应机制也是提升性能的关键所在。
|
|
|
|
总的来说,这个策略为趋势跟踪交易提供了一个坚实的基础框架。通过持续的优化和改进,它有潜力成为一个高效、可靠的自动化交易系统。然而,投资者在使用此策略时,仍需谨慎评估市场环境,并根据个人风险偏好和投资目标进行适当的调整。
|
|
|
|
||
|
|
|
|
#### Overview
|
|
|
|
This strategy is a trend-following trading system based on multi-period moving average crossovers. It utilizes four moving averages of different periods to identify market trends and generates trading signals when the short-term moving average crosses the medium-term moving average. The strategy also incorporates risk management mechanisms by setting stop-losses to control downside risk. This approach aims to capture medium to long-term market trends while filtering out short-term market noise through the combination of multiple moving averages.
|
|
|
|
#### Strategy Principles
|
|
|
|
The core principle of this strategy is to use crossovers of multiple moving averages to determine changes in market trends. Specifically:
|
|
|
|
1. It uses four moving averages: MA1 (20 periods), MA2 (50 periods), MA3 (100 periods), and MA4 (200 periods).
|
|
2. A buy signal is generated when MA1 crosses above MA2 and the closing price is above MA4.
|
|
3. A sell signal is generated when MA1 crosses below MA2 and the closing price is below MA4.
|
|
4. After entry, a stop-loss is set at the lowest price (for long positions) or highest price (for short positions) at the entry point.
|
|
5. The position is closed when an opposite crossover signal occurs or the stop-loss is hit.
|
|
|
|
This design leverages the sensitivity of the short-term moving average (MA1) to market changes while using the medium-term (MA2) and long-term (MA4) moving averages to confirm the overall trend, thereby reducing the risk of false breakouts.
|
|
|
|
#### Strategy Advantages
|
|
|
|
1. Strong trend-following capability: The combination of multiple moving averages effectively captures medium to long-term market trends, reducing the impact of short-term fluctuations.
|
|
|
|
2. Robust risk management: The dynamic stop-loss mechanism helps control the risk exposure for each trade.
|
|
|
|
3. High flexibility: The strategy allows users to customize the type and parameters of moving averages, enabling optimization for different markets and trading instruments.
|
|
|
|
4. Good visualization: Traders can intuitively observe market conditions and trading signals through different colored moving averages and background markers.
|
|
|
|
5. High adaptability: The strategy can be applied to various time frames and trading instruments, demonstrating broad applicability.
|
|
|
|
6. High degree of automation: The strategy can be fully automated, reducing human emotional interference.
|
|
|
|
#### Strategy Risks
|
|
|
|
1. Lag: Moving averages are inherently lagging indicators, which may result in significant drawdowns during early trend reversals.
|
|
|
|
2. Ineffective in ranging markets: Frequent moving average crossovers in sideways markets may lead to overtrading and consecutive losses.
|
|
|
|
3. False breakout risk: Despite using multiple moving averages for confirmation, false signals may still occur during short-term fluctuations.
|
|
|
|
4. Potentially strict stop-loss settings: Using the highest/lowest price at entry as a stop-loss may result in premature exits in volatile markets.
|
|
|
|
5. Ignores other market factors: Relying solely on price and moving averages, the strategy doesn't consider other important factors such as volume and fundamentals.
|
|
|
|
6. Parameter sensitivity: Different moving average parameters can lead to significantly different results, posing a risk of overfitting.
|
|
|
|
#### Strategy Optimization Directions
|
|
|
|
1. Introduce dynamic stop-losses: Consider using ATR (Average True Range) to set more reasonable stop-loss levels that adapt to changes in market volatility.
|
|
|
|
2. Add trend strength filtering: Incorporate indicators like ADX (Average Directional Index) to measure trend strength and only enter positions in strong trend markets.
|
|
|
|
3. Consider volume factors: Use volume as a confirmation condition for trading signals to improve signal reliability.
|
|
|
|
4. Optimize entry timing: Wait for a confirmation period after moving average crossovers or combine with other technical indicators (such as RSI) to optimize entry points.
|
|
|
|
5. Add trailing stop-losses: Implement trailing stops to capture more profit in sustained trends.
|
|
|
|
6. Parameter adaptation: Consider using adaptive parameter methods, such as dynamically adjusting moving average periods based on market volatility.
|
|
|
|
7. Integrate fundamental analysis: Adjust strategy behavior during important economic data releases or special events to address potential abnormal fluctuations.
|
|
|
|
#### Conclusion
|
|
|
|
The multi-period moving average crossover trend-following strategy is a classic and effective quantitative trading method. By combining multiple moving averages, it can capture medium to long-term trends while filtering out short-term noise to some extent. The core advantages of this strategy lie in its sensitivity to trends and completeness of risk management. However, as a purely technical analysis-driven system, it also faces inherent flaws such as lag and poor performance in ranging markets.
|
|
|
|
Future optimization directions should focus on improving signal quality, enhancing risk management, and increasing strategy adaptability. By introducing more technical indicators and market factors, a more comprehensive and robust trading system can be constructed. Meanwhile, strategy parameter optimization and adaptive mechanisms are key to performance improvement.
|
|
|
|
Overall, this strategy provides a solid foundational framework for trend-following trading. Through continuous optimization and improvement, it has the potential to become an efficient and reliable automated trading system. However, investors should still carefully evaluate market conditions when using this strategy and make appropriate adjustments based on individual risk preferences and investment objectives.
|
|
|
|
[/trans]
|
|
|
|
|
|
|
|
> Source (PineScript)
|
|
|
|
``` pinescript
|
|
//@version=5
|
|
strategy("Moving Average Ribbon with Orders", shorttitle="MA Ribbon Orders", overlay=true)
|
|
|
|
// Hàm tính toán các loại MA
|
|
ma(source, length, type) =>
|
|
type == "SMA" ? ta.sma(source, length) :
|
|
type == "EMA" ? ta.ema(source, length) :
|
|
type == "SMMA (RMA)" ? ta.rma(source, length) :
|
|
type == "WMA" ? ta.wma(source, length) :
|
|
type == "VWMA" ? ta.vwma(source, length) :
|
|
na
|
|
|
|
// MA1
|
|
show_ma1 = input(true , "MA №1", inline="MA #1")
|
|
ma1_type = input.string("SMA" , "" , inline="MA #1", options=["SMA", "EMA", "SMMA (RMA)", "WMA", "VWMA"])
|
|
ma1_source = input(close , "" , inline="MA #1")
|
|
ma1_length = input.int(20 , "" , inline="MA #1", minval=1)
|
|
ma1_color = input(color.new(color.yellow, 0), "" , inline="MA #1")
|
|
ma1 = ma(ma1_source, ma1_length, ma1_type)
|
|
plot(show_ma1 ? ma1 : na, color = ma1_color, title="MA №1")
|
|
|
|
// MA2
|
|
show_ma2 = input(true , "MA №2", inline="MA #2")
|
|
ma2_type = input.string("SMA" , "" , inline="MA #2", options=["SMA", "EMA", "SMMA (RMA)", "WMA", "VWMA"])
|
|
ma2_source = input(close , "" , inline="MA #2")
|
|
ma2_length = input.int(50 , "" , inline="MA #2", minval=1)
|
|
ma2_color = input(color.new(color.orange, 0), "" , inline="MA #2")
|
|
ma2 = ma(ma2_source, ma2_length, ma2_type)
|
|
plot(show_ma2 ? ma2 : na, color = ma2_color, title="MA №2")
|
|
|
|
// MA3
|
|
show_ma3 = input(true , "MA №3", inline="MA #3")
|
|
ma3_type = input.string("SMA" , "" , inline="MA #3", options=["SMA", "EMA", "SMMA (RMA)", "WMA", "VWMA"])
|
|
ma3_source = input(close , "" , inline="MA #3")
|
|
ma3_length = input.int(100 , "" , inline="MA #3", minval=1)
|
|
ma3_color = input(color.new(color.red, 0), "" , inline="MA #3")
|
|
ma3 = ma(ma3_source, ma3_length, ma3_type)
|
|
plot(show_ma3 ? ma3 : na, color = ma3_color, title="MA №3")
|
|
|
|
// MA4
|
|
show_ma4 = input(true , "MA №4", inline="MA #4")
|
|
ma4_type = input.string("SMA" , "" , inline="MA #4", options=["SMA", "EMA", "SMMA (RMA)", "WMA", "VWMA"])
|
|
ma4_source = input(close , "" , inline="MA #4")
|
|
ma4_length = input.int(200 , "" , inline="MA #4", minval=1)
|
|
ma4_color = input(color.new(color.maroon, 0), "" , inline="MA #4")
|
|
ma4 = ma(ma4_source, ma4_length, ma4_type)
|
|
plot(show_ma4 ? ma4 : na, color = ma4_color, title="MA №4")
|
|
|
|
// Điều kiện điểm MUA và BAN
|
|
buy_signal = ta.crossover(ma1, ma2) and close > ma4
|
|
sell_signal = ta.crossunder(ma1, ma2) and close < ma4
|
|
|
|
// Vẽ các điểm MUA và BAN
|
|
plotshape(series=buy_signal, location=location.belowbar, color=color.green, style=shape.labelup, title="Buy Signal", text="MUA")
|
|
plotshape(series=sell_signal, location=location.abovebar, color=color.red, style=shape.labeldown, title="Sell Signal", text="BAN")
|
|
|
|
// Quản lý trạng thái lệnh
|
|
var float entry_price_long = na
|
|
var float stop_price_long = na
|
|
var float entry_price_short = na
|
|
var float stop_price_short = na
|
|
|
|
if (buy_signal)
|
|
entry_price_long := close
|
|
stop_price_long := low
|
|
strategy.entry("Long", strategy.long)
|
|
|
|
if (sell_signal)
|
|
entry_price_short := close
|
|
stop_price_short := high
|
|
strategy.entry("Short", strategy.short)
|
|
|
|
// Điều kiện thoát lệnh
|
|
exit_condition_long = ta.crossunder(ma1, ma2) or close < stop_price_long
|
|
exit_condition_short = ta.crossover(ma1, ma2) or close > stop_price_short
|
|
|
|
if (exit_condition_long)
|
|
strategy.exit("Exit Long", "Long", stop=stop_price_long)
|
|
strategy.close("Long")
|
|
|
|
if (exit_condition_short)
|
|
strategy.exit("Exit Short", "Short", stop=stop_price_short)
|
|
strategy.close("Short")
|
|
|
|
// Vẽ vùng MUA và BAN
|
|
var float buy_price = na
|
|
var float sell_price = na
|
|
|
|
if (buy_signal)
|
|
buy_price := close
|
|
|
|
if (sell_signal)
|
|
sell_price := close
|
|
|
|
bgcolor(buy_price and na(sell_price) ? color.new(color.green, 90) : na)
|
|
bgcolor(sell_price and na(buy_price) ? color.new(color.red, 90) : na)
|
|
|
|
```
|
|
|
|
> Detail
|
|
|
|
https://www.fmz.com/strategy/458133
|
|
|
|
> Last Modified
|
|
|
|
2024-07-30 10:54:14
|