
286 lines
20 KiB
Markdown
286 lines
20 KiB
Markdown
|
||
> Name
|
||
|
||
多信号组合自适应交易策略-Multi-Signal-Adaptive-Trading-Strategy
|
||
|
||
> Author
|
||
|
||
ianzeng123
|
||
|
||
> Strategy Description
|
||
|
||
|
||
|
||
|
||
|
||
|
||
[trans]
|
||
|
||
#### 概述
|
||
多信号组合自适应交易策略是一种综合性量化交易系统,它融合了多种技术分析指标来生成交易信号。该策略主要利用EMA交叉、RSI超买超卖以及MACD指标三大核心技术指标,并结合了交易量过滤器和更高时间框架确认机制,形成了一个完整的交易系统。该策略还包含风险管理模块,使用固定百分比止损、止盈以及ATR追踪止损,可以有效地控制每笔交易的风险。
|
||
|
||
#### 策略原理
|
||
该策略的核心原理是通过多种交易信号的组合来提高交易决策的准确性。具体实现方式如下:
|
||
|
||
1. **EMA交叉信号**:使用快速EMA(默认9周期)和慢速EMA(默认21周期)的交叉来识别趋势变化。当快速EMA上穿慢速EMA时产生买入信号,当快速EMA下穿慢速EMA时产生卖出信号。
|
||
|
||
2. **RSI超买超卖信号**:利用相对强弱指标(RSI)识别市场的超买超卖状态。当RSI低于30(默认)时视为超卖,产生买入信号;当RSI高于70(默认)时视为超买,产生卖出信号。
|
||
|
||
3. **MACD信号**:使用MACD指标的主线与信号线的交叉来确认趋势方向。当MACD主线上穿信号线时产生买入信号,当MACD主线下穿信号线时产生卖出信号。
|
||
|
||
4. **信号组合逻辑**:策略提供了两种组合方式 - "Any"(任一信号触发)和"All"(所有启用的信号同时触发)。在"Any"模式下,只要有一个启用的信号触发,就会产生交易信号;在"All"模式下,必须所有启用的信号同时触发才会产生交易信号。
|
||
|
||
5. **过滤器机制**:
|
||
- 交易量过滤器:确保只在交易量高于移动平均线时进行交易。
|
||
- 更高时间框架确认:使用更高时间框架的EMA来确认总体趋势方向,只在趋势方向一致时进行交易。
|
||
|
||
6. **仓位管理**:策略使用资金百分比方法确定每笔交易的仓位大小,默认使用账户权益的10%。
|
||
|
||
7. **风险管理**:
|
||
- 固定百分比止损和止盈
|
||
- ATR追踪止损,使用ATR的倍数来设置动态止损位
|
||
|
||
#### 策略优势
|
||
1. **多维信号分析**:通过结合多种技术指标,该策略能够从不同角度分析市场,减少假信号的影响,提高交易决策的可靠性。
|
||
|
||
2. **灵活的信号组合**:用户可以选择"Any"或"All"的信号组合模式,适应不同的交易风格和市场条件。在波动性较大的市场中,"All"模式可以减少错误信号;在明确趋势中,"Any"模式可以更敏感地捕捉机会。
|
||
|
||
3. **多层次过滤机制**:交易量过滤器和更高时间框架确认机制增加了额外的验证层,有效减少了错误交易信号,特别是在市场横盘整理时。
|
||
|
||
4. **完善的风险管理**:该策略拥有完整的风险控制系统,包括百分比止损止盈和ATR追踪止损,能够适应市场波动性变化自动调整止损位置,有效保护资金。
|
||
|
||
5. **高度可定制性**:策略允许用户调整各种参数,包括EMA长度、RSI阈值、MACD参数等,使交易者可以根据自己的交易风格和目标市场进行优化。
|
||
|
||
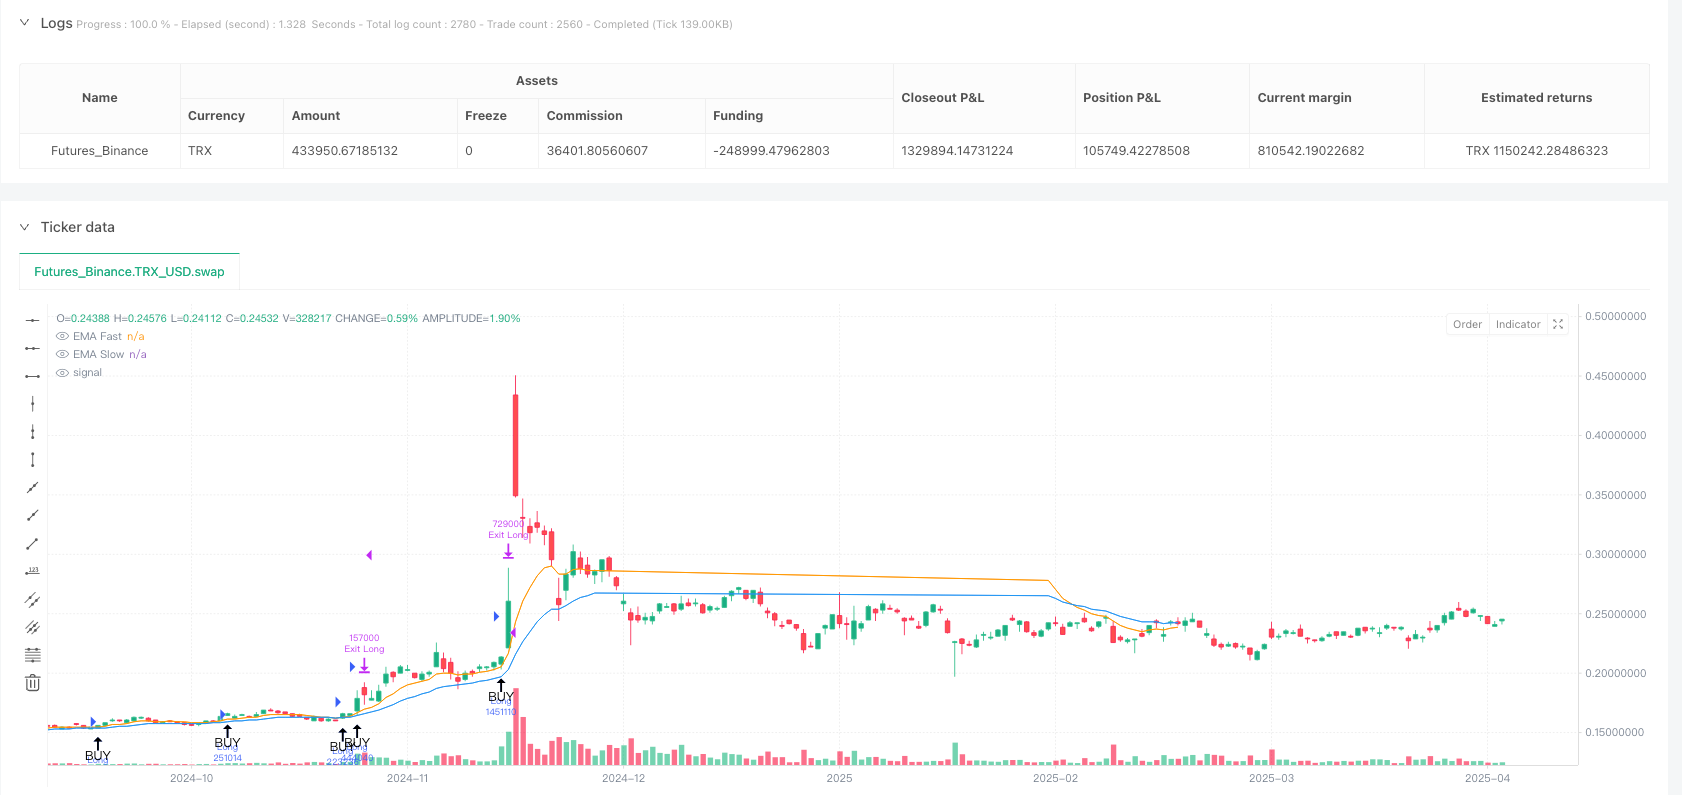
6. **直观的视觉反馈**:策略提供了清晰的图表指示,包括EMA线和买卖信号箭头,便于交易者直观地理解和评估交易信号。
|
||
|
||
#### 策略风险
|
||
1. **参数优化过度**:过度优化参数可能导致策略在历史测试中表现良好,但在实际交易中表现不佳(过拟合风险)。解决方法是使用足够长的回测周期和进行稳健性测试。
|
||
|
||
2. **信号冲突**:在某些市场条件下,不同的信号可能相互矛盾,导致混淆。例如,EMA可能指示上升趋势,而RSI已经处于超买区域。解决方法是明确信号优先级或使用"All"模式确保一致性。
|
||
|
||
3. **滞后性问题**:所有使用的技术指标都存在一定程度的滞后性,特别是EMA和MACD。在快速变化的市场中,这可能导致入场或出场时机不理想。解决方法是考虑缩短指标周期或结合价格行为分析。
|
||
|
||
4. **市场适应性限制**:该策略在趋势明显的市场中表现较好,但在区间震荡市场中可能产生较多错误信号。解决方法是增加趋势强度过滤器或在识别出震荡市场时暂停交易。
|
||
|
||
5. **资金风险**:虽然策略包含止损机制,但在极端市场条件下(如大幅跳空或流动性不足),止损可能无法按预期执行。解决方法是适当降低每笔交易的资金比例和使用更保守的止损设置。
|
||
|
||
#### 策略优化方向
|
||
1. **增加趋势强度过滤器**:添加ADX或类似指标来衡量趋势强度,只在趋势明确时进行交易,可以显著减少震荡市场中的假信号。这一改进能够解决策略在横盘市场中容易产生错误信号的问题。
|
||
|
||
2. **增加时间过滤器**:市场在不同时段的特性不同,添加时间过滤器可以避免在低效率时段交易。例如,可以避开市场开盘和收盘的高波动期,或者仅在特定的交易时段活动。
|
||
|
||
3. **动态参数调整**:基于市场波动率自动调整指标参数。例如,在高波动率环境中延长EMA周期,在低波动率环境中缩短周期。这种适应性调整可以提高策略在不同市场条件下的适应能力。
|
||
|
||
4. **增加机器学习组件**:引入机器学习算法来优化信号权重分配,根据历史表现动态调整各信号的重要性。这可以使策略随着市场条件变化自动调整其决策逻辑。
|
||
|
||
5. **改进仓位管理**:实现基于波动率的仓位调整,在低波动率环境中增加仓位,在高波动率环境中减少仓位。这样可以在保持风险相对恒定的同时,提高资金利用效率。
|
||
|
||
6. **添加基本面过滤器**:对于某些市场,结合基本面指标(如财报季节、经济数据发布等)可以避免在重大不确定性事件前后进行交易,减少潜在风险。
|
||
|
||
7. **改进止损策略**:实现基于支撑位和阻力位的智能止损,而不仅仅依赖于固定百分比或ATR倍数。这种方法可以更好地适应市场结构,避免因市场噪音而被不必要地止损。
|
||
|
||
#### 总结
|
||
多信号组合自适应交易策略是一个全面且灵活的交易系统,通过结合多种技术指标和过滤机制,提供了相对可靠的交易信号。该策略的核心优势在于其综合分析能力和完善的风险管理体系,使其能够在不同市场条件下保持一定的有效性。
|
||
|
||
然而,该策略也存在一些固有的风险和局限性,如参数优化过度和信号滞后等问题。通过实施建议的优化方向,特别是增加趋势强度过滤器和实现动态参数调整,可以进一步提高策略的稳健性和适应性。
|
||
|
||
最终,无论多么完善的策略都需要根据具体市场环境和个人交易目标进行调整。持续监控策略表现,定期评估和优化,是保持策略长期有效性的关键。该策略为量化交易者提供了一个良好的起点,可以在此基础上进一步发展出更加复杂和个性化的交易系统。 ||
|
||
|
||
#### Overview
|
||
The Multi-Signal Adaptive Trading Strategy is a comprehensive quantitative trading system that combines multiple technical analysis indicators to generate trading signals. The strategy primarily utilizes three core technical indicators: EMA crossover, RSI overbought/oversold conditions, and MACD signals, complemented by volume filters and higher timeframe confirmation mechanisms to form a complete trading system. The strategy also includes a risk management module using fixed percentage stop-loss, take-profit, and ATR trailing stops to effectively control risk on each trade.
|
||
|
||
#### Strategy Principle
|
||
The core principle of this strategy is to improve trading decision accuracy through the combination of multiple trading signals. The specific implementation is as follows:
|
||
|
||
1. **EMA Crossover Signal**: Uses the crossover between fast EMA (default 9 periods) and slow EMA (default 21 periods) to identify trend changes. A buy signal is generated when the fast EMA crosses above the slow EMA, and a sell signal is generated when the fast EMA crosses below the slow EMA.
|
||
|
||
2. **RSI Overbought/Oversold Signal**: Utilizes the Relative Strength Index (RSI) to identify market overbought and oversold conditions. When RSI falls below 30 (default), it's considered oversold, generating a buy signal; when RSI rises above 70 (default), it's considered overbought, generating a sell signal.
|
||
|
||
3. **MACD Signal**: Uses the crossover between the MACD line and signal line to confirm trend direction. A buy signal is generated when the MACD line crosses above the signal line, and a sell signal is generated when the MACD line crosses below the signal line.
|
||
|
||
4. **Signal Combination Logic**: The strategy provides two combination methods - "Any" (triggered by any signal) and "All" (triggered only when all enabled signals align). In "Any" mode, a trading signal is generated when any enabled signal is triggered; in "All" mode, all enabled signals must be triggered simultaneously to generate a trading signal.
|
||
|
||
5. **Filter Mechanisms**:
|
||
- Volume Filter: Ensures trading only when volume is above its moving average.
|
||
- Higher Timeframe Confirmation: Uses a higher timeframe EMA to confirm the overall trend direction, trading only when the trend direction aligns.
|
||
|
||
6. **Position Management**: The strategy uses a percentage of equity method to determine position size for each trade, defaulting to 10% of account equity.
|
||
|
||
7. **Risk Management**:
|
||
- Fixed percentage stop-loss and take-profit
|
||
- ATR trailing stop, using a multiple of ATR to set dynamic stop-loss levels
|
||
|
||
#### Strategy Advantages
|
||
1. **Multi-dimensional Signal Analysis**: By combining multiple technical indicators, the strategy can analyze the market from different angles, reducing the impact of false signals and improving the reliability of trading decisions.
|
||
|
||
2. **Flexible Signal Combination**: Users can choose between "Any" or "All" signal combination modes, adapting to different trading styles and market conditions. In highly volatile markets, "All" mode can reduce false signals; in clear trends, "Any" mode can more sensitively capture opportunities.
|
||
|
||
3. **Multi-level Filtering Mechanism**: The volume filter and higher timeframe confirmation mechanism add additional validation layers, effectively reducing erroneous trading signals, especially during market consolidation.
|
||
|
||
4. **Comprehensive Risk Management**: The strategy has a complete risk control system, including percentage stop-loss/take-profit and ATR trailing stops, which can automatically adjust stop positions based on market volatility changes, effectively protecting capital.
|
||
|
||
5. **High Customizability**: The strategy allows users to adjust various parameters, including EMA lengths, RSI thresholds, MACD parameters, etc., enabling traders to optimize according to their trading style and target market.
|
||
|
||
6. **Intuitive Visual Feedback**: The strategy provides clear chart indications, including EMA lines and buy/sell signal arrows, allowing traders to intuitively understand and evaluate trading signals.
|
||
|
||
#### Strategy Risks
|
||
1. **Parameter Over-optimization**: Excessive parameter optimization may lead to the strategy performing well in historical tests but poorly in actual trading (overfitting risk). The solution is to use sufficiently long backtesting periods and conduct robustness tests.
|
||
|
||
2. **Signal Conflicts**: Under certain market conditions, different signals may contradict each other, leading to confusion. For example, EMA might indicate an uptrend while RSI is already in the overbought zone. The solution is to clearly define signal priorities or use "All" mode to ensure consistency.
|
||
|
||
3. **Lagging Issue**: All technical indicators used have a certain degree of lag, especially EMA and MACD. In rapidly changing markets, this may result in suboptimal entry or exit timing. The solution is to consider shortening indicator periods or incorporating price action analysis.
|
||
|
||
4. **Market Adaptability Limitations**: The strategy performs well in markets with clear trends but may generate more false signals in range-bound markets. The solution is to add trend strength filters or pause trading when range-bound markets are identified.
|
||
|
||
5. **Capital Risk**: Although the strategy includes stop-loss mechanisms, in extreme market conditions (such as large gaps or liquidity shortages), stops may not execute as expected. The solution is to appropriately reduce the percentage of funds per trade and use more conservative stop settings.
|
||
|
||
#### Strategy Optimization Directions
|
||
1. **Add Trend Strength Filter**: Adding ADX or similar indicators to measure trend strength and only trading in clear trends can significantly reduce false signals in oscillating markets. This improvement can solve the problem of the strategy generating false signals in sideways markets.
|
||
|
||
2. **Add Time Filter**: Markets have different characteristics at different times; adding a time filter can avoid trading during inefficient periods. For example, avoiding the high volatility periods at market open and close, or only trading during specific sessions.
|
||
|
||
3. **Dynamic Parameter Adjustment**: Automatically adjust indicator parameters based on market volatility. For example, lengthening EMA periods in high volatility environments and shortening them in low volatility environments. This adaptive adjustment can improve the strategy's adaptability under different market conditions.
|
||
|
||
4. **Add Machine Learning Component**: Introduce machine learning algorithms to optimize signal weight allocation, dynamically adjusting the importance of each signal based on historical performance. This can enable the strategy to automatically adjust its decision logic as market conditions change.
|
||
|
||
5. **Improve Position Management**: Implement volatility-based position sizing, increasing positions in low volatility environments and reducing them in high volatility environments. This can improve capital efficiency while keeping relative risk constant.
|
||
|
||
6. **Add Fundamental Filters**: For certain markets, incorporating fundamental indicators (such as earnings seasons, economic data releases, etc.) can avoid trading before and after major uncertainty events, reducing potential risks.
|
||
|
||
7. **Improve Stop-Loss Strategy**: Implement intelligent stop-loss based on support and resistance levels, rather than relying solely on fixed percentages or ATR multiples. This approach can better adapt to market structure and avoid unnecessary stops due to market noise.
|
||
|
||
#### Summary
|
||
The Multi-Signal Adaptive Trading Strategy is a comprehensive and flexible trading system that provides relatively reliable trading signals by combining multiple technical indicators and filtering mechanisms. The core advantages of the strategy lie in its comprehensive analysis capabilities and complete risk management system, allowing it to maintain effectiveness under different market conditions.
|
||
|
||
However, the strategy also has some inherent risks and limitations, such as parameter over-optimization and signal lag issues. By implementing the suggested optimization directions, especially adding trend strength filters and implementing dynamic parameter adjustments, the robustness and adaptability of the strategy can be further improved.
|
||
|
||
Ultimately, no matter how sophisticated a strategy is, it needs to be adjusted according to specific market environments and personal trading goals. Continuous monitoring of strategy performance, regular evaluation, and optimization are key to maintaining long-term effectiveness. This strategy provides a good starting point for quantitative traders, on which more complex and personalized trading systems can be further developed.[/trans]
|
||
|
||
|
||
|
||
> Source (PineScript)
|
||
|
||
``` pinescript
|
||
/*backtest
|
||
start: 2024-04-22 00:00:00
|
||
end: 2025-04-21 00:00:00
|
||
period: 1d
|
||
basePeriod: 1d
|
||
exchanges: [{"eid":"Futures_Binance","currency":"TRX_USD"}]
|
||
*/
|
||
|
||
//@version=5
|
||
strategy("Full‑Featured Multi‑Signal Strategy By Andi Tan", overlay=true)
|
||
|
||
// === POSITION SIZE ===
|
||
posPct = input.float(10, "Position Size (% Equity)", minval=0.1, step=0.1)
|
||
|
||
// === INPUTS SIGNALS ===
|
||
useEMA = input.bool(true, "Enable EMA Crossover")
|
||
emaFastLen = input.int(9, "EMA Fast Length", minval=1)
|
||
emaSlowLen = input.int(21, "EMA Slow Length", minval=1)
|
||
|
||
useRSI = input.bool(true, "Enable RSI Signal")
|
||
rsiLen = input.int(14, "RSI Length", minval=1)
|
||
rsiOB = input.int(70, "RSI Overbought", minval=50, maxval=100)
|
||
rsiOS = input.int(30, "RSI Oversold", minval=0, maxval=50)
|
||
|
||
useMACD = input.bool(true, "Enable MACD Signal")
|
||
macdFast = input.int(12, "MACD Fast Length", minval=1)
|
||
macdSlow = input.int(26, "MACD Slow Length", minval=1)
|
||
macdSig = input.int(9, "MACD Signal Length", minval=1)
|
||
|
||
mode = input.string("Any", "Signal Combination", options=["Any","All"])
|
||
showArrows = input.bool(true, "Show Buy/Sell Arrows")
|
||
|
||
// === RISK MANAGEMENT ===
|
||
slPct = input.float(1.0, "Stop‑Loss (%)", minval=0) / 100
|
||
tpPct = input.float(2.0, "Take‑Profit (%)", minval=0) / 100
|
||
|
||
useTrail = input.bool(true, "Enable ATR Trailing Stop")
|
||
atrLen = input.int(14, "ATR Length", minval=1)
|
||
trailMul = input.float(1.5, "ATR Multiplier", minval=0.1)
|
||
|
||
// === FILTERS ===
|
||
useVolFilt = input.bool(true, "Enable Volume Filter")
|
||
volLen = input.int(20, "Volume MA Length", minval=1)
|
||
|
||
useHigherTF = input.bool(true, "Enable Higher‑TF Confirmation")
|
||
higherTF = input.string("60", "Higher‑TF Timeframe", options=["5","15","60","240","D","W"])
|
||
|
||
// === CALCULATIONS ===
|
||
// EMA crossover
|
||
emaFast = ta.ema(close, emaFastLen)
|
||
emaSlow = ta.ema(close, emaSlowLen)
|
||
emaUp = ta.crossover(emaFast, emaSlow)
|
||
emaDown = ta.crossunder(emaFast, emaSlow)
|
||
|
||
// RSI
|
||
rsiVal = ta.rsi(close, rsiLen)
|
||
rsiBuy = rsiVal < rsiOS
|
||
rsiSell = rsiVal > rsiOB
|
||
|
||
// MACD
|
||
[macdLine, macdSignal, _] = ta.macd(close, macdFast, macdSlow, macdSig)
|
||
macdBuy = ta.crossover(macdLine, macdSignal)
|
||
macdSell = ta.crossunder(macdLine, macdSignal)
|
||
|
||
// Combine base signals with if…else (bukan ternary terpecah)
|
||
var bool buyBase = false
|
||
var bool sellBase = false
|
||
if mode == "Any"
|
||
buyBase := (useEMA and emaUp) or (useRSI and rsiBuy) or (useMACD and macdBuy)
|
||
sellBase := (useEMA and emaDown) or (useRSI and rsiSell) or (useMACD and macdSell)
|
||
else
|
||
buyBase := ((not useEMA) or emaUp) and ((not useRSI) or rsiBuy) and ((not useMACD) or macdBuy)
|
||
sellBase := ((not useEMA) or emaDown) and ((not useRSI) or rsiSell) and ((not useMACD) or macdSell)
|
||
|
||
// Volume filter
|
||
volMA = ta.sma(volume, volLen)
|
||
buyF = buyBase and (not useVolFilt or volume > volMA)
|
||
sellF = sellBase and (not useVolFilt or volume > volMA)
|
||
|
||
// ——— HIGHER‑TF EMA (dipanggil di top‑scope) ———
|
||
htEMA = request.security(syminfo.tickerid, higherTF, ta.ema(close, emaSlowLen))
|
||
|
||
// Final buy/sell signals
|
||
buySignal = buyF and (not useHigherTF or close > htEMA)
|
||
sellSignal = sellF and (not useHigherTF or close < htEMA)
|
||
|
||
// ATR untuk trailing
|
||
atrVal = ta.atr(atrLen)
|
||
|
||
// === ORDERS ===
|
||
if buySignal
|
||
float qty = (strategy.equity * posPct/100) / close
|
||
strategy.entry("Long", strategy.long, qty=qty)
|
||
if sellSignal
|
||
float qty = (strategy.equity * posPct/100) / close
|
||
strategy.entry("Short", strategy.short, qty=qty)
|
||
|
||
strategy.exit("Exit Long", from_entry="Long",
|
||
loss=slPct * close, profit=tpPct * close,
|
||
trail_points = useTrail ? atrVal * trailMul : na)
|
||
|
||
strategy.exit("Exit Short", from_entry="Short",
|
||
loss=slPct * close, profit=tpPct * close,
|
||
trail_points = useTrail ? atrVal * trailMul : na)
|
||
|
||
// === PLOTS ===
|
||
plot(useEMA ? emaFast : na, title="EMA Fast", color=color.orange)
|
||
plot(useEMA ? emaSlow : na, title="EMA Slow", color=color.blue)
|
||
|
||
plotshape(showArrows and buySignal, title="Buy", location=location.belowbar,
|
||
style=shape.arrowup, text="BUY")
|
||
plotshape(showArrows and sellSignal, title="Sell", location=location.abovebar,
|
||
style=shape.arrowdown, text="SELL")
|
||
```
|
||
|
||
> Detail
|
||
|
||
https://www.fmz.com/strategy/491645
|
||
|
||
> Last Modified
|
||
|
||
2025-04-22 17:17:09
|