
170 lines
8.8 KiB
Markdown
170 lines
8.8 KiB
Markdown
|
|
> Name
|
|
|
|
增强型动态布林带交易策略-Enhanced-Dynamic-Bollinger-Bands-Trading-Strategy
|
|
|
|
> Author
|
|
|
|
ChaoZhang
|
|
|
|
> Strategy Description
|
|
|
|
|
|
[trans]
|
|
#### 概述
|
|
|
|
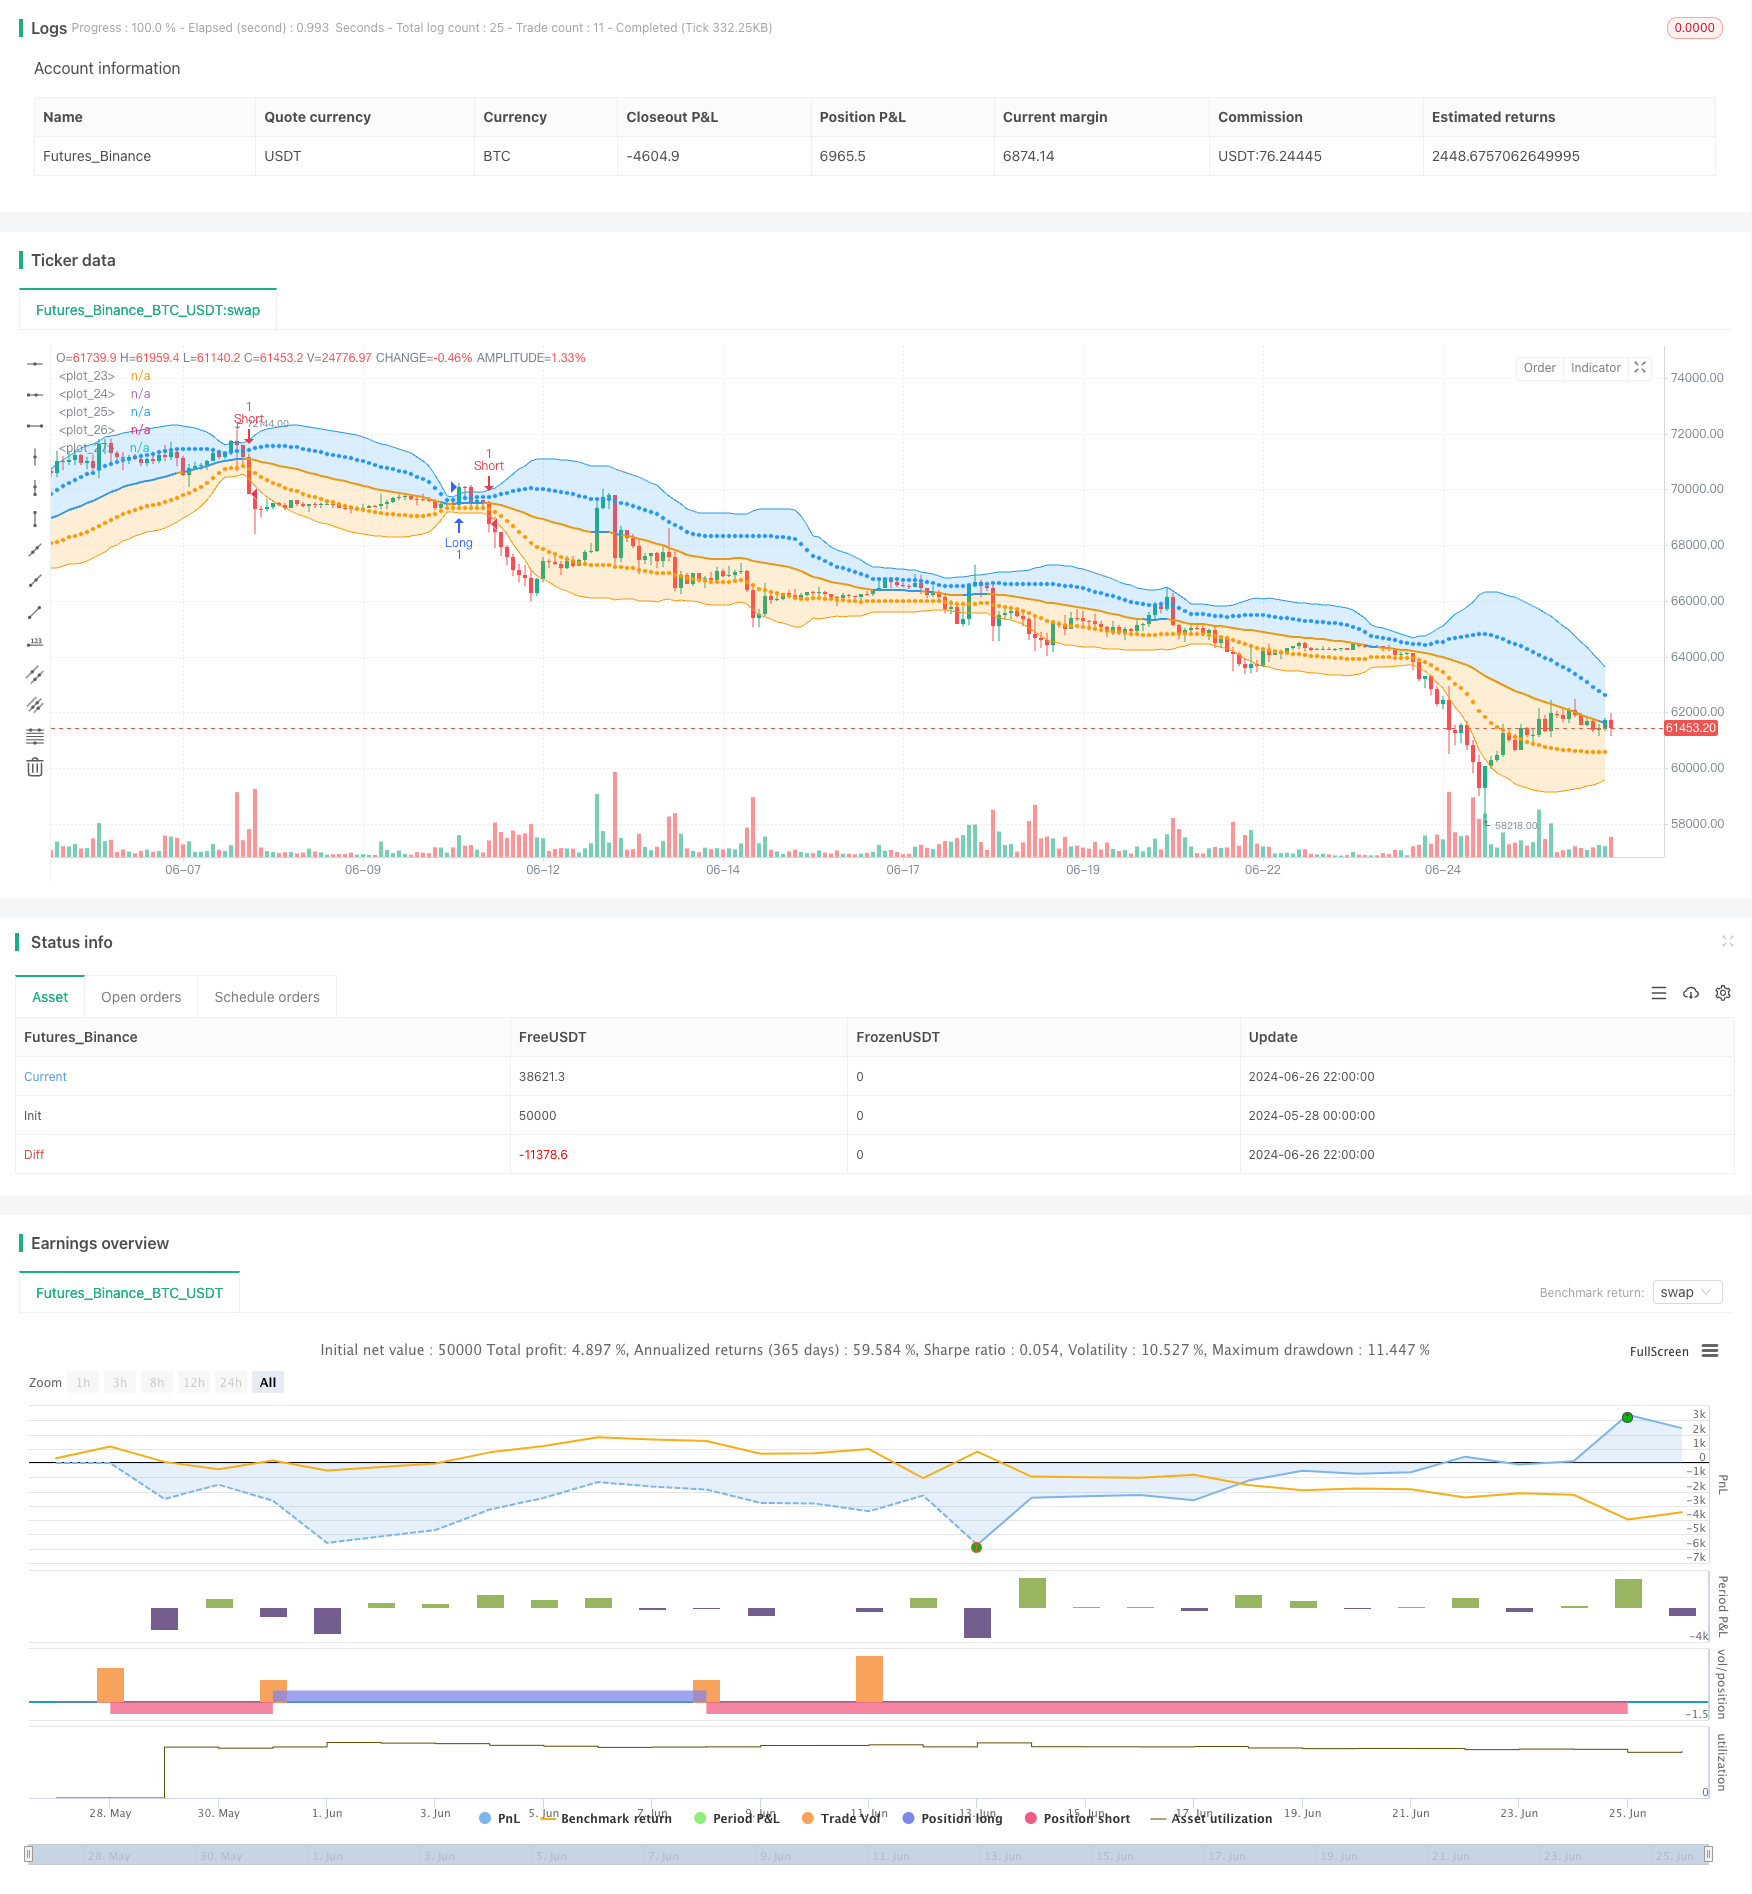
本策略是一个基于布林带指标的增强型交易系统,通过使用双重标准差带来优化传统布林带策略。该策略利用价格与不同标准差水平的交互来生成交易信号,旨在捕捉市场的趋势和反转机会。
|
|
|
|
#### 策略原理
|
|
|
|
该策略的核心是使用两个不同级别的布林带:
|
|
|
|
1. 基于34周期简单移动平均线(SMA)计算布林带。
|
|
2. 内层布林带使用1个标准差,外层布林带使用2个标准差。
|
|
3. 当价格突破外层布林带上轨时,触发做多信号;突破下轨时,触发做空信号。
|
|
4. 当价格回落至外层布林带下轨时,平掉多头仓位;回升至上轨时,平掉空头仓位。
|
|
|
|
这种双层布林带设计允许策略在不同的市场条件下灵活运作,既能捕捉强劲趋势,又能识别潜在的反转点。
|
|
|
|
#### 策略优势
|
|
|
|
1. 动态适应性:布林带会根据市场波动性自动调整,使策略能够适应不同的市场环境。
|
|
2. 趋势跟踪与反转:该策略既能跟随强劲趋势,又能在极端情况下寻找反转机会。
|
|
3. 风险管理:使用外层布林带作为止损点,有助于控制每笔交易的风险。
|
|
4. 视觉反馈:策略提供清晰的视觉反馈,帮助交易者直观理解市场状况。
|
|
5. 灵活性:参数可调整,允许交易者根据不同的市场和个人偏好进行优化。
|
|
|
|
#### 策略风险
|
|
|
|
1. 假突破:在横盘市场中,价格可能频繁触及布林带边界,导致过多的假信号。
|
|
2. 滞后性:作为滞后指标,布林带可能在快速变化的市场中反应不及时。
|
|
3. 过度交易:在高波动性市场中,可能产生过多的交易信号,增加交易成本。
|
|
4. 趋势依赖:在无明显趋势的市场中,策略表现可能不佳。
|
|
5. 参数敏感性:策略性能高度依赖于所选择的参数,不同市场可能需要不同的优化设置。
|
|
|
|
#### 策略优化方向
|
|
|
|
1. 引入额外过滤器:结合其他技术指标(如RSI或MACD)来确认信号,减少假突破。
|
|
2. 动态参数调整:根据市场波动性自动调整布林带参数,提高策略适应性。
|
|
3. 加入成交量分析:将成交量作为辅助指标,提高信号的可靠性。
|
|
4. 实现自适应周期:使用自适应周期而非固定周期,以更好地捕捉市场节奏。
|
|
5. 优化仓位管理:根据布林带宽度动态调整仓位大小,在高确定性时增加仓位。
|
|
6. 加入市场状态识别:在策略中加入市场状态(趋势/震荡)的判断,以适应不同市场条件。
|
|
|
|
#### 总结
|
|
|
|
增强型动态布林带交易策略是一个灵活而强大的交易系统,通过使用双层布林带结构,有效地平衡了趋势跟踪和反转交易的需求。该策略的主要优势在于其动态适应性和清晰的视觉反馈,使其成为适合各种市场条件的有力工具。然而,交易者需要注意假突破和过度交易的风险,并考虑引入额外的过滤器和动态参数调整来优化策略性能。通过持续的测试和优化,这个策略有潜力成为一个可靠的交易系统,为交易者提供稳定的盈利机会。
|
|
|
|
||
|
|
|
|
#### Overview
|
|
|
|
This strategy is an enhanced trading system based on the Bollinger Bands indicator, optimizing the traditional Bollinger Bands strategy by using double standard deviation bands. The strategy utilizes price interactions with different standard deviation levels to generate trading signals, aiming to capture both trend and reversal opportunities in the market.
|
|
|
|
#### Strategy Principle
|
|
|
|
The core of this strategy lies in using two different levels of Bollinger Bands:
|
|
|
|
1. Bollinger Bands are calculated based on a 34-period Simple Moving Average (SMA).
|
|
2. The inner Bollinger Bands use 1 standard deviation, while the outer Bollinger Bands use 2 standard deviations.
|
|
3. A long signal is triggered when the price breaks above the outer upper Bollinger Band; a short signal is triggered when it breaks below the lower band.
|
|
4. Long positions are closed when the price falls back to the outer lower Bollinger Band; short positions are closed when it rises back to the upper band.
|
|
|
|
This dual-layer Bollinger Band design allows the strategy to operate flexibly under different market conditions, capturing strong trends while also identifying potential reversal points.
|
|
|
|
#### Strategy Advantages
|
|
|
|
1. Dynamic Adaptability: Bollinger Bands automatically adjust based on market volatility, enabling the strategy to adapt to different market environments.
|
|
2. Trend Following and Reversal: The strategy can both follow strong trends and seek reversal opportunities in extreme cases.
|
|
3. Risk Management: Using the outer Bollinger Bands as stop-loss points helps control risk for each trade.
|
|
4. Visual Feedback: The strategy provides clear visual feedback, helping traders intuitively understand market conditions.
|
|
5. Flexibility: Parameters can be adjusted, allowing traders to optimize according to different markets and personal preferences.
|
|
|
|
#### Strategy Risks
|
|
|
|
1. False Breakouts: In ranging markets, prices may frequently touch Bollinger Band boundaries, leading to excessive false signals.
|
|
2. Lag: As a lagging indicator, Bollinger Bands may not react timely in rapidly changing markets.
|
|
3. Overtrading: In highly volatile markets, the strategy may generate too many trading signals, increasing transaction costs.
|
|
4. Trend Dependency: The strategy may not perform well in markets without clear trends.
|
|
5. Parameter Sensitivity: Strategy performance highly depends on chosen parameters, which may require different optimization settings for various markets.
|
|
|
|
#### Strategy Optimization Directions
|
|
|
|
1. Introduce Additional Filters: Combine with other technical indicators (such as RSI or MACD) to confirm signals and reduce false breakouts.
|
|
2. Dynamic Parameter Adjustment: Automatically adjust Bollinger Band parameters based on market volatility to improve strategy adaptability.
|
|
3. Incorporate Volume Analysis: Use volume as an auxiliary indicator to enhance signal reliability.
|
|
4. Implement Adaptive Periods: Use adaptive periods instead of fixed periods to better capture market rhythms.
|
|
5. Optimize Position Management: Dynamically adjust position sizes based on Bollinger Band width, increasing positions when certainty is high.
|
|
6. Add Market State Recognition: Incorporate market state (trend/range) judgment in the strategy to adapt to different market conditions.
|
|
|
|
#### Summary
|
|
|
|
The Enhanced Dynamic Bollinger Bands Trading Strategy is a flexible and powerful trading system that effectively balances trend-following and reversal trading needs through a dual-layer Bollinger Band structure. The strategy's main advantages lie in its dynamic adaptability and clear visual feedback, making it a potent tool suitable for various market conditions. However, traders need to be aware of the risks of false breakouts and overtrading, and consider introducing additional filters and dynamic parameter adjustments to optimize strategy performance. Through continuous testing and optimization, this strategy has the potential to become a reliable trading system, providing traders with stable profit opportunities.
|
|
|
|
[/trans]
|
|
|
|
|
|
|
|
> Source (PineScript)
|
|
|
|
``` pinescript
|
|
/*backtest
|
|
start: 2024-05-28 00:00:00
|
|
end: 2024-06-27 00:00:00
|
|
period: 2h
|
|
basePeriod: 15m
|
|
exchanges: [{"eid":"Futures_Binance","currency":"BTC_USDT"}]
|
|
*/
|
|
|
|
//@version=5
|
|
// Bollinger Bands: Madrid : 14/SEP/2014 11:07 : 2.0
|
|
// This displays the traditional Bollinger Bands, the difference is
|
|
// that the 1st and 2nd StdDev are outlined with two colors and two
|
|
// different levels, one for each Standard Deviation
|
|
|
|
strategy(shorttitle='MBB', title='Bollinger Bands', overlay=true)
|
|
src = input(close)
|
|
length = input.int(34, minval=1)
|
|
mult = input.float(2.0, minval=0.001, maxval=50)
|
|
|
|
basis = ta.sma(src, length)
|
|
dev = ta.stdev(src, length)
|
|
dev2 = mult * dev
|
|
|
|
upper1 = basis + dev
|
|
lower1 = basis - dev
|
|
upper2 = basis + dev2
|
|
lower2 = basis - dev2
|
|
|
|
colorBasis = src >= basis ? color.blue : color.orange
|
|
|
|
pBasis = plot(basis, linewidth=2, color=colorBasis)
|
|
pUpper1 = plot(upper1, color=color.new(color.blue, 0), style=plot.style_circles)
|
|
pUpper2 = plot(upper2, color=color.new(color.blue, 0))
|
|
pLower1 = plot(lower1, color=color.new(color.orange, 0), style=plot.style_circles)
|
|
pLower2 = plot(lower2, color=color.new(color.orange, 0))
|
|
|
|
fill(pBasis, pUpper2, color=color.new(color.blue, 80))
|
|
fill(pUpper1, pUpper2, color=color.new(color.blue, 80))
|
|
fill(pBasis, pLower2, color=color.new(color.orange, 80))
|
|
fill(pLower1, pLower2, color=color.new(color.orange, 80))
|
|
|
|
|
|
if (close > upper2)
|
|
strategy.entry("Long", strategy.long)
|
|
if (close < lower2)
|
|
strategy.entry("Short", strategy.short)
|
|
if (close <= lower2)
|
|
strategy.close("Long")
|
|
if (close >= upper2)
|
|
strategy.close("Short")
|
|
```
|
|
|
|
> Detail
|
|
|
|
https://www.fmz.com/strategy/455366
|
|
|
|
> Last Modified
|
|
|
|
2024-06-28 15:31:19
|