
203 lines
7.6 KiB
Markdown
203 lines
7.6 KiB
Markdown
|
|
> Name
|
|
|
|
基于RSI指标的趋势跟随策略RSI-Trend-Following-Strategy
|
|
|
|
> Author
|
|
|
|
ChaoZhang
|
|
|
|
> Strategy Description
|
|
|
|
|
|
|
|
[trans]
|
|
|
|
|
|
## 概述
|
|
|
|
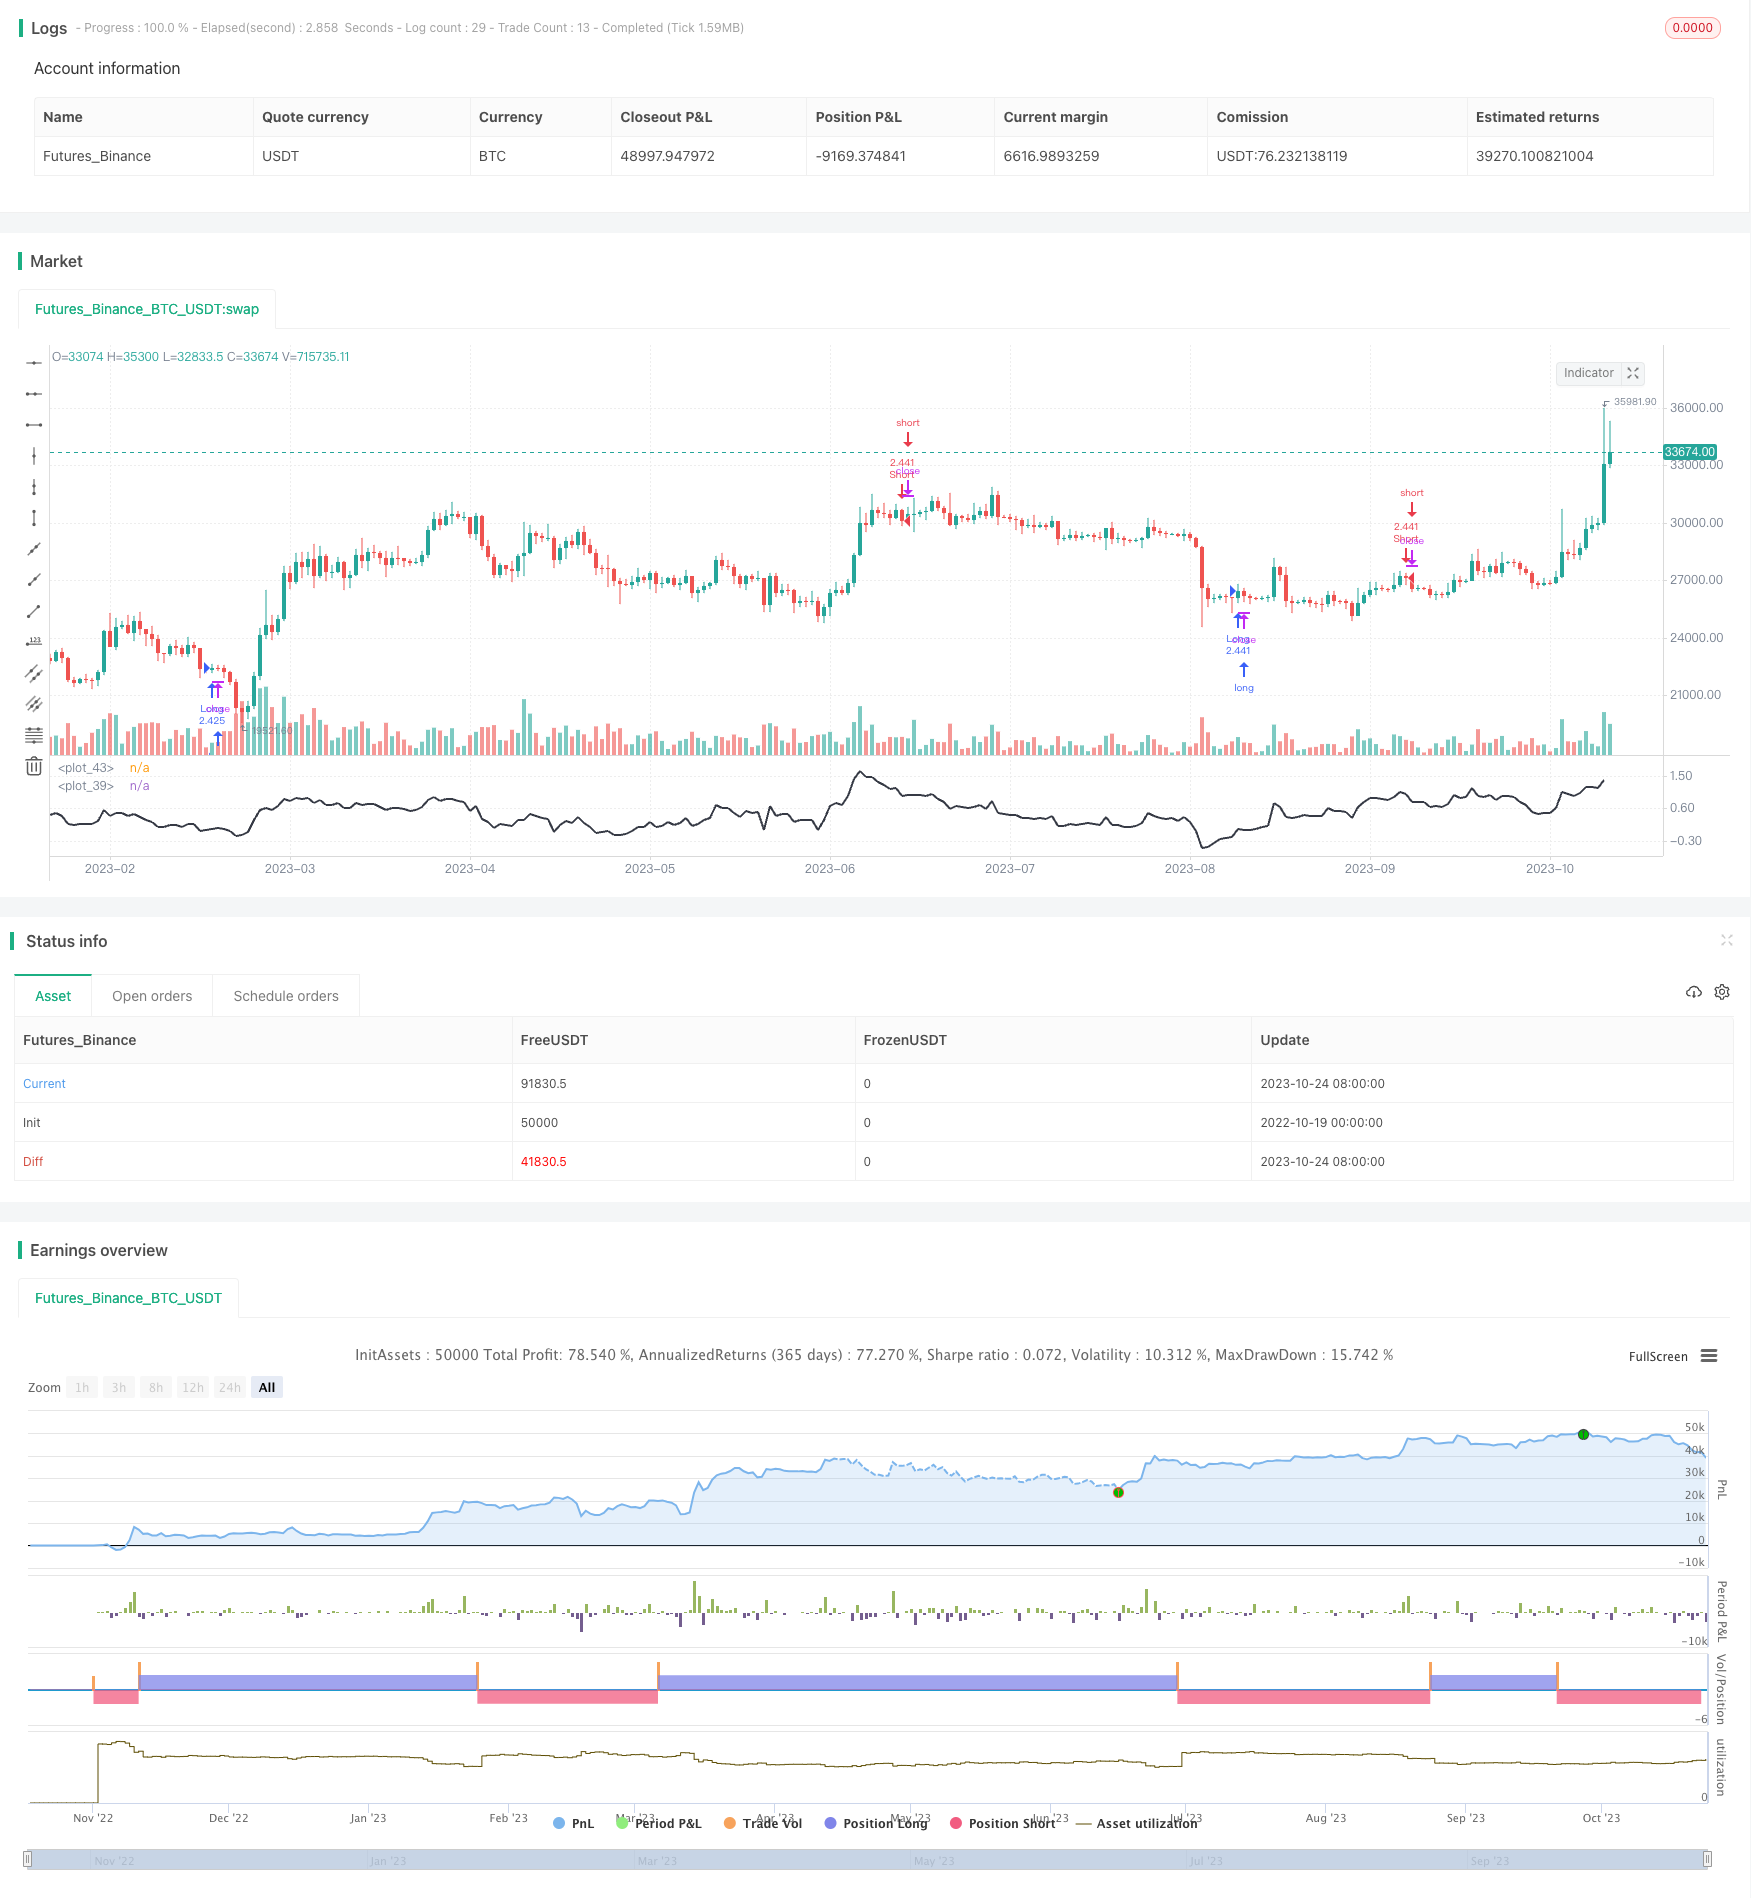
本策略基于RSI指标设计了一个简单的趋势跟随交易系统,可以在特定日期范围内,通过RSI指标判断市场趋势方向,实现自动做多做空。
|
|
|
|
## 策略原理
|
|
|
|
该策略使用RSI指标判断市场趋势,以及布林带通道判断超买超卖区域。
|
|
|
|
首先,计算RSI值,然后通过RSI的移动平均线及标准差计算出布林带上下轨。RSI指标在0-1之间波动,布林带通过标准差确定超买超卖区间,RSI高于上轨时为超买区,低于下轨时为超卖区。
|
|
|
|
当RSI从下轨突破到上轨时产生买入信号,从上轨突破到下轨时产生卖出信号,实现趋势跟随。策略进场后,不设置止损止盈,直到指定日期结束时平仓。
|
|
|
|
该策略简单有效地利用RSI指标判断趋势方向,辅以布林带确定具体的交易时机。通过限定交易日期范围,可以避免不必要的风险。
|
|
|
|
## 优势分析
|
|
|
|
- 使用RSI指标判断趋势方向简单有效
|
|
- 结合布林带确认交易信号,避免假突破
|
|
- 限定交易日期范围,有助于规避市场风险
|
|
- 不设置止损止盈,最大限度跟踪趋势
|
|
- 可灵活调整参数,适用于多种市场环境
|
|
|
|
## 风险及优化
|
|
|
|
- 市场可能出现剧烈波动,导致亏损
|
|
- 未设置止损止盈,无法有效控制风险
|
|
- 参数设置不当可能导致交易频繁或错过机会
|
|
|
|
优化方向:
|
|
|
|
- 加入止损止盈策略,控制风险
|
|
- 优化参数设置,提高胜率
|
|
- 结合其他指标过滤信号,避免假突破
|
|
- 动态调整仓位规模
|
|
|
|
## 总结
|
|
|
|
本策略总体来说是一个非常简单直接的趋势跟随策略。使用RSI判断趋势,布林带过滤信号,限定交易日期范围,可以有效跟踪趋势并控制风险。但策略可以进一步优化,在保持简单有效的基础上,通过止损止盈、参数优化、信号过滤等方法进一步完善,使策略更适合实盘交易。
|
|
|
|
|
|
||
|
|
|
|
|
|
## Overview
|
|
|
|
This strategy designs a simple trend following trading system based on the RSI indicator, which can determine the market trend direction through RSI and implement automated long and short positions within a specific date range.
|
|
|
|
## Strategy Logic
|
|
|
|
The strategy uses RSI indicator to determine market trend, and Bollinger Bands to confirm overbought and oversold zones.
|
|
|
|
Firstly, RSI value is calculated. The upper and lower bands of Bollinger Bands are calculated based on moving average and standard deviation of RSI. RSI fluctuates between 0-1, and Bollinger Bands identifies overbought and oversold zones through standard deviation. When RSI is higher than the upper band, it's overbought zone, and when lower than the lower band, it's oversold zone.
|
|
|
|
When RSI breaks through from the lower to the upper band, a buy signal is generated. When RSI breaks through from the upper to the lower band, a sell signal is generated, to follow the trend. After entering the market, no stop loss or take profit is set until positions are closed at the end of the specified date range.
|
|
|
|
The strategy simply and effectively uses RSI to determine trend direction, and Bollinger Bands to identify specific trading opportunities. By defining the date range, unnecessary risks can be avoided.
|
|
|
|
## Advantage Analysis
|
|
|
|
- Using RSI to determine trend direction is simple and effective
|
|
- Combining Bollinger Bands to confirm trading signals avoids false breakouts
|
|
- Defining trading date range helps avoid market risks
|
|
- No stop loss or take profit, maximizes trend following
|
|
- Flexible parameter adjustment, adapts to various market environments
|
|
|
|
## Risks and Optimization
|
|
|
|
- Market may have violent swings, leading to losses
|
|
- No stop loss or take profit fails to effectively control risks
|
|
- Improper parameter settings may cause overtrading or missing opportunities
|
|
|
|
Optimization Directions:
|
|
|
|
- Add stop loss and take profit to control risks
|
|
- Optimize parameter settings to improve win rate
|
|
- Add other indicators to filter signals and avoid false breakouts
|
|
- Dynamically adjust position sizing
|
|
|
|
## Summary
|
|
|
|
In summary, this is a very simple and direct trend following strategy. Using RSI to determine trend, Bollinger Bands to filter signals, and defining trading date range, can effectively follow trends and control risks. But the strategy can be further optimized. While keeping it simple and effective, methods like stop loss, parameter optimization and signal filtering can be added to make it more suitable for live trading.
|
|
|
|
[/trans]
|
|
|
|
> Strategy Arguments
|
|
|
|
|
|
|
|
|Argument|Default|Description|
|
|
|----|----|----|
|
|
|v_input_1|true|Long|
|
|
|v_input_2|true|Short|
|
|
|v_input_3|100|Lot, %|
|
|
|v_input_4_close|0|source: close|high|low|open|hl2|hlc3|hlcc4|ohlc4|
|
|
|v_input_5|14|RSI or MFI length|
|
|
|v_input_6|true|use RSI or MFI|
|
|
|v_input_7|2018|From Year|
|
|
|v_input_8|2100|To Year|
|
|
|v_input_9|true|From Month|
|
|
|v_input_10|12|To Month|
|
|
|v_input_11|true|From Day|
|
|
|v_input_12|31|To Day|
|
|
|v_input_13|50|BB length|
|
|
|v_input_14|1.618|mult|
|
|
|
|
|
|
> Source (PineScript)
|
|
|
|
``` pinescript
|
|
/*backtest
|
|
start: 2022-10-19 00:00:00
|
|
end: 2023-10-25 00:00:00
|
|
period: 1d
|
|
basePeriod: 1h
|
|
exchanges: [{"eid":"Futures_Binance","currency":"BTC_USDT"}]
|
|
*/
|
|
|
|
//Gidra
|
|
//2018
|
|
|
|
//@version=2
|
|
strategy(title = "Gidra's RSI or MFI Strategy v0.1", shorttitle = "Gidra's RSI or MFI v0.1", overlay = false, default_qty_type = strategy.percent_of_equity, default_qty_value = 100, pyramiding = 1)
|
|
|
|
//Settings
|
|
needlong = input(true, defval = true, title = "Long")
|
|
needshort = input(true, defval = true, title = "Short")
|
|
capital = input(100, defval = 100, minval = 1, maxval = 10000, title = "Lot, %")
|
|
src = input(close, title="source")
|
|
lengthRSI = input(14, title="RSI or MFI length")
|
|
// RSI %B
|
|
useRSI = input(true, title="use RSI or MFI")
|
|
fromyear = input(2018, defval = 2018, minval = 1900, maxval = 2100, title = "From Year")
|
|
toyear = input(2100, defval = 2100, minval = 1900, maxval = 2100, title = "To Year")
|
|
frommonth = input(01, defval = 01, minval = 01, maxval = 12, title = "From Month")
|
|
tomonth = input(12, defval = 12, minval = 01, maxval = 12, title = "To Month")
|
|
fromday = input(01, defval = 01, minval = 01, maxval = 31, title = "From Day")
|
|
today = input(31, defval = 31, minval = 01, maxval = 31, title = "To Day")
|
|
|
|
//MFI
|
|
upper = sum(volume * (change(src) <= 0 ? 0 : src), lengthRSI)
|
|
lower = sum(volume * (change(src) >= 0 ? 0 : src), lengthRSI)
|
|
mf = rsi(upper, lower)
|
|
|
|
//RSI
|
|
rsi = useRSI?rsi(src, lengthRSI): mf
|
|
|
|
// %B
|
|
length = input(50, minval=1, title="BB length")
|
|
mult = input(1.618, minval=0.001, maxval=50)
|
|
basis = sma(rsi, length)
|
|
dev = mult * stdev(rsi, length)
|
|
upperr = basis + dev
|
|
lowerr = basis - dev
|
|
bbr = (rsi - lowerr)/(upperr - lowerr)
|
|
|
|
plot(bbr, color=black, transp=0, linewidth=2)
|
|
// band1 = hline(1, color=white, linestyle=dashed)
|
|
// band0 = hline(0, color=white, linestyle=dashed)
|
|
// fill(band1, band0, color=teal)
|
|
hline(0.5, color=white)
|
|
|
|
//Signals
|
|
up = bbr >= 0 and bbr[1] < 0
|
|
dn = bbr <= 1 and bbr[1] > 1
|
|
//exit = ((bbr[1] < 0.5 and bbr >= 0.5) or (bbr[1] > 0.5 and bbr <= 0.5))
|
|
|
|
lot = strategy.position_size == 0 ? strategy.equity / close * capital / 100 : lot[1]
|
|
|
|
//Trading
|
|
if up
|
|
strategy.entry("Long", strategy.long, needlong == false ? 0 : lot, when=(time > timestamp(fromyear, frommonth, fromday, 00, 00) and time < timestamp(toyear, tomonth, today, 23, 59)))
|
|
|
|
if dn
|
|
strategy.entry("Short", strategy.short, needshort == false ? 0 : lot, when=(time > timestamp(fromyear, frommonth, fromday, 00, 00) and time < timestamp(toyear, tomonth, today, 23, 59)))
|
|
|
|
if time > timestamp(toyear, tomonth, today, 23, 59)// or exit
|
|
strategy.close_all()
|
|
```
|
|
|
|
> Detail
|
|
|
|
https://www.fmz.com/strategy/430252
|
|
|
|
> Last Modified
|
|
|
|
2023-10-26 15:44:15
|